. 2016 May;35(19):2529-41.
doi: 10.1038/onc.2015.325. Epub 2015 Sep 21.

The mRNA-binding protein HuR promotes hypoxia-induced chemoresistance through posttranscriptional regulation of the proto-oncogene PIM1 in pancreatic cancer cells

Affiliations

The mRNA-binding protein HuR promotes hypoxia-induced chemoresistance through posttranscriptional regulation of the proto-oncogene PIM1 in pancreatic cancer cells

F F Blanco et al. Oncogene. 2016 May.

Abstract

Previously, it has been shown that pancreatic ductal adenocarcinoma (PDA) tumors exhibit high levels of hypoxia, characterized by low oxygen pressure (pO2) and decreased O2 intracellular perfusion. Chronic hypoxia is strongly associated with resistance to cytotoxic chemotherapy and chemoradiation in an understudied phenomenon known as hypoxia-induced chemoresistance. The hypoxia-inducible, pro-oncogenic, serine-threonine kinase PIM1 (Proviral Integration site for Moloney murine leukemia virus 1) has emerged as a key regulator of hypoxia-induced chemoresistance in PDA and other cancers. Although its role in therapeutic resistance has been described previously, the molecular mechanism behind PIM1 overexpression in PDA is unknown. Here, we demonstrate that cis-acting AU-rich elements (ARE) present within a 38-base pair region of the PIM1 mRNA 3'-untranslated region mediate a regulatory interaction with the mRNA stability factor HuR (Hu antigen R) in the context of tumor hypoxia. Predominantly expressed in the nucleus in PDA cells, HuR translocates to the cytoplasm in response to hypoxic stress and stabilizes the PIM1 mRNA transcript, resulting in PIM1 protein overexpression. A reverse-phase protein array revealed that HuR-mediated regulation of PIM1 protects cells from hypoxic stress through phosphorylation and inactivation of the apoptotic effector BAD and activation of MEK1/2. Importantly, pharmacological inhibition of HuR by MS-444 inhibits HuR homodimerization and its cytoplasmic translocation, abrogates hypoxia-induced PIM1 overexpression and markedly enhances PDA cell sensitivity to oxaliplatin and 5-fluorouracil under physiologic low oxygen conditions. Taken together, these results support the notion that HuR has prosurvival properties in PDA cells by enabling them with growth advantages in stressful tumor microenvironment niches. Accordingly, these studies provide evidence that therapeutic disruption of HuR's regulation of PIM1 may be a key strategy in breaking an elusive chemotherapeutic resistance mechanism acquired by PDA cells that reside in hypoxic PDA microenvironments.


Conflict of interest statement

CONFLICT OF INTEREST

The authors declare no conflict of interest.

Figures
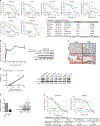
Figure 1.
Figure 1.
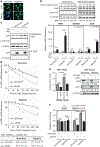
The proto-oncogene, serine–threonine kinase PIM1 promotes hypoxia-induced chemoresistance. (a) PDA cell lines were treated with the indicated doses of oxaliplatin in normoxia or hypoxia for 72 h. Cell survival was calculated by measurement of dsDNA content using PicoGreen, and dose–response curves were fitted based on a sigmoidal dose–response model. Each data point represents the mean of four independent experiments ± s.e.m. The table depicts IC50 values derived from dose–response curves. (b) MiaPaCa2 cells were incubated in hypoxia for the indicated times and PIM1 mRNA expression was determined by qPCR using 18S rRNA as a loading control (*P ⩽ 0.01, error bars s.e.m.). PIM1 protein expression was analyzed by western blot using α-tubulin as a loading control. Densitometric analysis was carried out by ImageJ. (c) Human PDA specimens were stained for PIM1 and carbonic anhydrase 9. Scale bar = 200 μM. (d) PDA cell lines were incubated in normoxia (N) or hypoxia (H) for 24 h and PIM1 expression was assayed by western blot analysis. The fold induction of PIM1 expression (densitometry by ImageJ) was plotted against the hypoxia IC50 values and fitted to a linear regression to determine the Pearson’s r. The two-tailed P-value indicates the statistical significance of the relationship between PIM1 induction and hypoxia IC50 values. (e) MiaPaCa2 cells were transfected in triplicates with siRNA against PIM1 (siPIM1). PIM1 mRNA and protein expression were measured by qPCR and western blot analysis, respectively (*P ⩽ 0.01, error bars s.e.m.). (f) PicoGreen-based drug sensitivity assays to oxaliplatin were carried out in MiaPaCa2 cells transfected with siPIM1 and incubated in normoxia or hypoxia for 72 h. IC50 values derived from dose–response curves are shown in the table.
Figure 2.
Figure 2.
The mRNA stability factor HuR regulates PIM1 expression in response to hypoxic stress. (a) Immunofluorescence of HuR localization in MiaPaCa2 cells subjected to hypoxia for 24 h (green signal, HuR). Cellular nuclei were stained with Hoechst33258 (blue signal). Magnification x40, scale bar = 10 μM. (b) Western blot analysis of fractionated MiaPaCa2 lysates prepared from cells subjected to hypoxia for the indicated times. Lamin A/C and α-tubulin were used as controls to determine the integrity of the lysates. Densitometric analysis was accomplished using ImageJ. (c) Messenger ribonucleoprotein immunoprecipitation (mRNP-IP) assay was accomplished by isolation of cytoplasmic fractions of MiaPaCa2 cells subjected to hypoxia or normoxia for 24 h. HuR was immunoprecipitated (IP) using a rabbit polyclonal antibody, and IP was validated by a mouse monoclonal antibody through western blot analysis. α-Tubulin was used as a loading control for the input and a negative control for the IP samples. Lamin A/C was used as a control to detect nuclear contamination in the input. The relative abundance of PIM1 mRNA bound to HuR was assayed in triplicates by qPCR using 18S rRNA as a loading control. Results were normalized to IgG isotype controls and represented as means of three independent experiments ± s.e.m. GAPDH (glyceraldehyde 3-phosphate dehydrogenase) was used as a negative control and dCK as a positive control (*P ⩽ 0.05, **P ⩽ 0.01, NS not significant). (d) MiaPaCa2 cells were transfected with control siRNA (siControl) or siRNA against HuR (siHuR), and incubated in normoxia or hypoxia for 24 h. Actinomycin D (5 μg/ml) was added for the indicated times 20 h after hypoxic treatment, after which PIM1 mRNA stability was assayed by qPCR using 18 S rRNA as a loading control. Each value represents an average of triplicates ± s.e.m. (e) MiaPaCa2 cells were transfected with control siRNA (siControl) or siRNA against HuR (siHuR), and incubated in normoxia or hypoxia for 24 h. HuR and PIM1 protein expression was assayed by western blot using α-tubulin as a loading control. (f) MiaPaCa2 cells were co-transfected with a control siRNA or siHuR and luciferase reporter constructs without the PIM1 3′-UTR (LucΔ3′-UTR) or fused to the full-length PIM1 3′-UTR (Luc+PIM1 3′-UTR) and subjected to hypoxia or normoxia for 24 h. Renilla luciferase activity was normalized to firefly luciferase activity and is the average of three experiments ± s.e.m. (***P ⩽ 0.001, NS not significant).
Figure 3.
Figure 3.
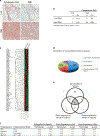
PIM1 overexpression correlates with cytoplasmic HuR status in PDA tumors. (a) Immunohistochemical detection of HuR and PIM1 in formalin-fixed, paraffin-embedded (FFPE) PDA tumors. (b) Blinded quantification and distribution of immunoreactivity scores. (c) Hierarchical cluster analysis of changes in total, cleavage or phosphorylation status of cancer-associated proteins by RPPA. (d) Changes in total protein expression, cleavage or phosphorylation status between normoxia and hypoxia were classified by function and represented in a pie chart. (e) Venn diagram demonstrating overlaps between proteins whose expression, cleavage or phosphorylation status were significantly increased in hypoxia, and negated by HuR or PIM1 silencing. (f) Identification of the four overlapping hits identified in (e).
Figure 4.
Figure 4.
HuR-mediated regulation of PIM1 promotes PDA cell survival under hypoxia. (a) MiaPaCa2 cells were transfected with control siRNA or siPIM1 and grown in normoxia or hypoxia for 5 days. PicoGreen analysis of cell survival was performed at the indicated time points. (b) MiaPaCa2 cells were transfected with control siRNA, siHuR or siPIM1 and cultured in normoxia or hypoxia for 24 h. Upon harvest, cells were immunostained with anti-Ki67 antibody to visualize proliferative cells (green signal). Hoechst was used to visualize nuclei. Bar = 10 μM. Cells positive for Ki67 were quantified by determining the average number of Ki67-positive cells per x40 field of view (FOV) for 10 individual fields. Results are represented as an average of the percentage of Ki67-positive cells per x20 FOV ± s.e.m. (c) MiaPaCa2 cells transfected as in (a) were subjected to western blot analysis of HuR, PIM1 and cleaved caspase-3. α-Tubulin was used as a loading control. (d) MiaPaCa2 cells were transfected with control siRNA or siHuR for 48 h and subjected to hypoxia or normoxia for 24 h. HuR, PIM1, total BAD, p-BAD (Ser-112), total MEK and p-MEK (S217/221) were analyzed by western blot using α-tubulin as a loading control.
Figure 5.
Figure 5.
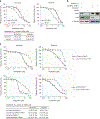
HuR regulates PIM1 to promote hypoxia-induced chemoresistance. (a) PicoGreen-based drug sensitivity assays to oxaliplatin were carried out in MiaPaCa2 cells transfected with siHuR and incubated in normoxia or hypoxia for 72 h. Dose–response curves were fitted based on a sigmoidal dose–response model. Each data point represents the mean of four independent experiments ± s.e.m. IC50 values were derived from dose–response curves. (b) PIM1 expression rescue experiments were carried out in MiaPaCa2 by transiently transfecting siRNAs to HuR (or scrambled control, siControl) and overexpressing His-tagged PIM1 (or control empty vector, pcDNA3.1) for 72 h. (c) PicoGreen-based drug sensitivity assays to oxaliplatin were carried out in MiaPaCa2 cells transfected as in (b). Dose–response curves were fitted based on a sigmoidal dose–response model. Each data point represents the mean of four independent experiments ± s.e.m. IC50 values were derived from dose–response curves.
Figure 6.
Figure 6.
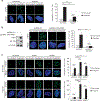
HuR-mediated regulation of PIM1 prevents DNA damage induced by oxaliplatin. (a) MiaPaCa2 cells were subjected to normoxia or hypoxia for 24 h, during which cells were treated with 1 μM oxaliplatin for 16 h. Double-stranded DNA breaks were visualized by immunofluorescence analysis of γH2AX (green signal), and blindly quantified using single plane images, and plotted ± s.d. (n = 40, NS, nonsignificant, ***P < 0.001). (b) MiaPaCa2 cells were transiently transfected with His-PIM1 for 48 h. Subsequently, cells were subjected to hypoxia or normoxia for 24 h, during which cells were treated with 1 μM oxaliplatin for 16 h. Double-stranded DNA breaks were visualized by immunofluorescence analysis of γH2AX (green signal), and blindly quantified using single plane images, and plotted ± s.d. (n = 40, NS, nonsignificant, ***P < 0.001). (c) MiaPaCa2 cells were transfected with a control non-targeting siRNA, or siRNA against HuR (siHuR) or PIM1 (siPIM1). Cells were subjected to hypoxia or normoxia for 24 h, during which cells were treated with 1μM oxaliplatin for 16 h. Double-stranded DNA breaks were visualized by immunofluorescence analysis of γH2AX (green signal), and blindly quantified using single plane images, and plotted ± s.d. (n = 40, ***P < 0.001).
Figure 7.
Figure 7.
Pharmacological HuR inhibition by the small-molecule MS-444 disrupts HuR-mediated stabilization of PIM1 and sensitizes cells to DNA-damaging chemotherapeutics. (a) MiaPaCa2 cells were treated with the indicated doses of MS-444 for 24 h and subjected to hypoxia. Non-treated cells in normoxia were used as controls. Whole-cell and cytoplasmic protein lysates were collected. HuR expression was assayed by western blot analysis in cytoplasmic lysates using Lamin A/C as a negative control. PIM1 expression was assayed by western blot analysis of whole-cell lysates. (b) PicoGreen-based drug sensitivity assays were carried out in MiaPaCa2 cells cotreated with a sublethal dose of MS-444 (5 μM) and increasing doses of oxaliplatin or 5-FU, respectively. Dose–response curves were fitted based on a sigmoidal dose–response model. Each data point represents the mean of four independent experiments ± s.e.m. (c) IC50 values derived from dose–response curves in (b). (d) A schematic model of hypoxia-mediated HuR cytoplasmic localization and subsequent stabilization of the PIM1 mRNA. The HuR-PIM1 axis promotes chemoresistance through potentiation of cell survival and DNA repair mediated by the oncogenic activity of the PIM1 kinase.

Similar articles

Cited by

References

    1. ACS. Cancer Facts & Figures 2013. American Cancer Society: Atlanta, GA, USA, 2014. Available at http://www.cancer.org/acs/groups/content/@editorial/documents/document/a....
    1. Rahib L, Smith BD, Aizenberg R, Rosenzweig AB, Fleshman JM, Matrisian LM. Projecting cancer incidence and deaths to 2030: the unexpected burden of thyroid, liver, and pancreas cancers in the United States. Cancer Res 2014; 74: 2913–2921. - PubMed
    1. Conroy T, Desseigne F, Ychou M, Bouche O, Guimbaud R, Becouarn Y et al. FOLFIRINOX versus gemcitabine for metastatic pancreatic cancer. N Engl J Med 2011; 364: 1817–1825. - PubMed
    1. Von Hoff DD, Ervin T, Arena FP, Chiorean EG, Infante J, Moore M et al. Increased survival in pancreatic cancer with nab-paclitaxel plus gemcitabine. N Engl J Med 2013; 369: 1691–1703. - PMC - PubMed
    1. Jones S, Zhang X, Parsons DW, Lin JC, Leary RJ, Angenendt P et al. Core signaling pathways in human pancreatic cancers revealed by global genomic analyses. Science 2008; 321: 1801–1806. - PMC - PubMed