. 2015 Oct 5;25(19):2518-26.
doi: 10.1016/j.cub.2015.08.007. Epub 2015 Sep 17.

The Role of Recent Admixture in Forming the Contemporary West Eurasian Genomic Landscape

Affiliations

The Role of Recent Admixture in Forming the Contemporary West Eurasian Genomic Landscape

George B J Busby et al. Curr Biol. .

Erratum in

  • The Role of Recent Admixture in Forming the Contemporary West Eurasian Genomic Landscape.
    Busby GBJ, Hellenthal G, Montinaro F, Tofanelli S, Bulayeva K, Rudan I, Zemunik T, Hayward C, Toncheva D, Karachanak-Yankova S, Nesheva D, Anagnostou P, Cali F, Brisighelli F, Romano V, Lefranc G, Buresi C, Ben Chibani J, Haj-Khelil A, Denden S, Ploski R, Krajewski P, Hervig T, Moen T, Herrera RJ, Wilson JF, Myers S, Capelli C. Busby GBJ, et al. Curr Biol. 2015 Nov 2;25(21):2878. doi: 10.1016/j.cub.2015.10.037. Epub 2015 Nov 2. Curr Biol. 2015. PMID: 28843288 Free PMC article. No abstract available.

Abstract

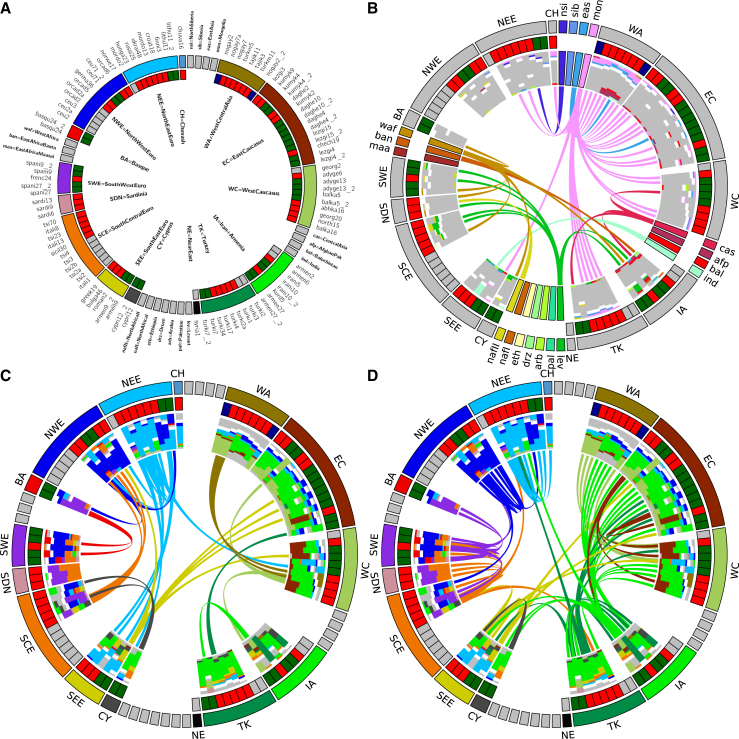
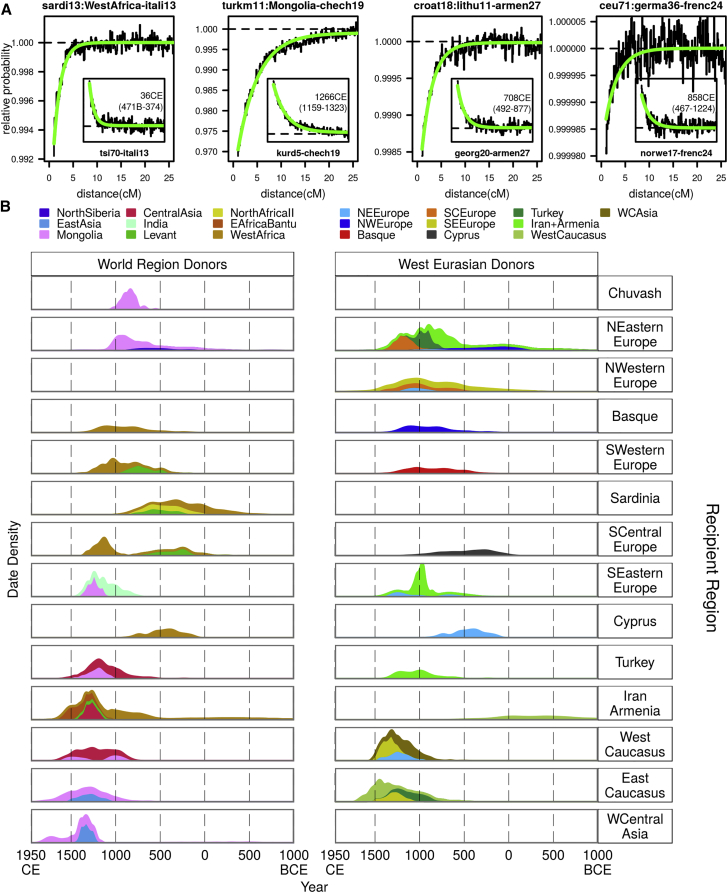
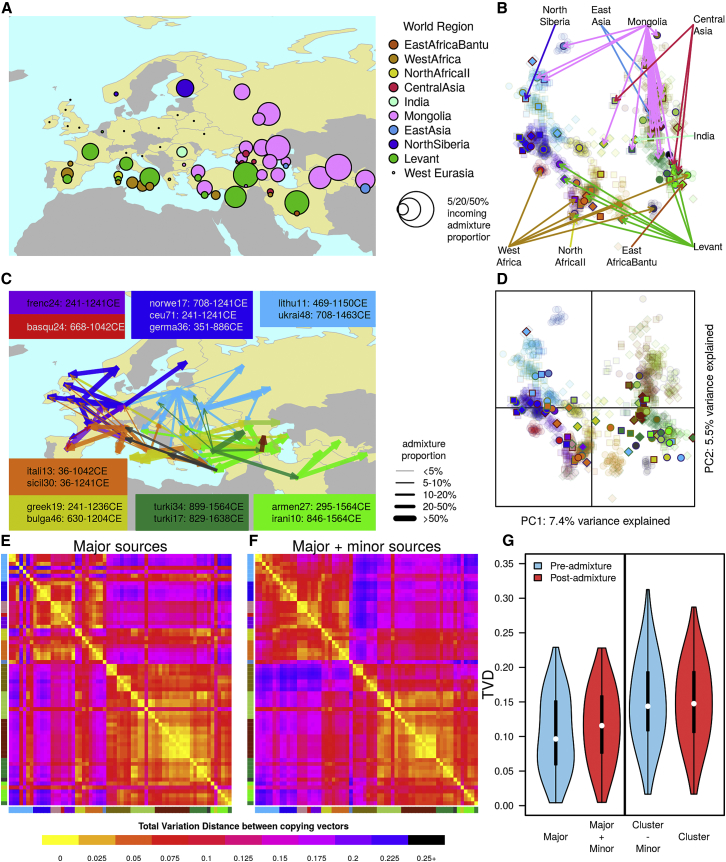
Over the past few years, studies of DNA isolated from human fossils and archaeological remains have generated considerable novel insight into the history of our species. Several landmark papers have described the genomes of ancient humans across West Eurasia, demonstrating the presence of large-scale, dynamic population movements over the last 10,000 years, such that ancestry across present-day populations is likely to be a mixture of several ancient groups [1-7]. While these efforts are bringing the details of West Eurasian prehistory into increasing focus, studies aimed at understanding the processes behind the generation of the current West Eurasian genetic landscape have been limited by the number of populations sampled or have been either too regional or global in their outlook [8-11]. Here, using recently described haplotype-based techniques [11], we present the results of a systematic survey of recent admixture history across Western Eurasia and show that admixture is a universal property across almost all groups. Admixture in all regions except North Western Europe involved the influx of genetic material from outside of West Eurasia, which we date to specific time periods. Within Northern, Western, and Central Europe, admixture tended to occur between local groups during the period 300 to 1200 CE. Comparisons of the genetic profiles of West Eurasians before and after admixture show that population movements within the last 1,500 years are likely to have maintained differentiation among groups. Our analysis provides a timeline of the gene flow events that have generated the contemporary genetic landscape of West Eurasia.


Figures

Figure 1
Figure 1
Structure and Relationships in West Eurasia (A) Map of West Eurasia showing the colors assigned to each major West Eurasian region. A full list of geographical populations used in the analysis is shown in Table S1. (B) The fineSTRUCTURE tree of the dataset showing the clusters used in the analysis. Cluster labels contain an alphabetical prefix relating to the geographical population label of the majority of individuals within a cluster. The numerical suffix describes the total number of individuals within a cluster. A full description of the identity of the individuals in each cluster is shown in Table S3. (C) Principal-component analysis (PCA) of the chunkcounts coancestry matrix used in fineSTRUCTURE. Each point is an individual and is labeled according to the fineSTRUCTURE cluster that it groups into as in (B).
Figure 2
Figure 2
Summary of Eurasian Admixture Events Inferred by GLOBETROTTER (A) Key showing the position of each cluster in the circos plot. The inner circle describes the type of event inferred in each cluster: gray = no admixture; red = one date; green = one date multiway, blue = two dates. For the latter two types of events, two sets of sources are shown. Second event sources are suffixed with a 2. Clusters are ordered clockwise by increasing date within regions around the circle. Labels for plots B–D are shown in bold in (A) for West Eurasian source regions inside the circle and World Regions sources around the edge. (B) All events involving minor World Region sources. For each event, the two sources are shown as barplots; each source is split by whitespace, and the size of the two sources reflects the proportion that that source contributes to the admixture event. Each source is made up from a number of components whose colors reflect the World Region that the source component comes from. All Eurasian source components are grayed out. Although made up of components, each source can also be represented by a “best-matching” source, and the central links join the best-matching source (thick end of the link) to the recipient cluster (thin end). (C and D) Equivalent plots to (B) showing West Eurasian admixture components in color and World Region components in gray. Links in (C) join the best-matching minor West Eurasian sources to the clusters. Links in (D) join the best-matching major admixture source, which is always from West Eurasia, to the relevant cluster. Colors in (C) and (D) represent different regions to those in (B).
Figure 3
Figure 3
Dates of Eurasian Admixture Events Inferred by GLOBETROTTER (A) Example co-ancestry curves that we use to infer the date of admixture and composition of sources. For a given cluster, CHROMOPAINTER identifies the chunks of DNA within each individual’s genome that are most closely related ancestrally to each donor group. GLOBETROTTER measures the decay of association versus genetic distance between the chunks copied from a given pair of donor groups. Assuming a single pulse of admixture between two or more distinct admixing source groups, theoretical considerations predict that this decay will be exponentially distributed with rate equal to the time (in generations) that this admixture occurred [22]. GLOBETROTTER jointly fits an exponential distribution to the decay curves for all pairwise combinations of donor groups and determines the single best fitting rate, hence determining the most likely single admixture event and estimating the date it occurred. GLOBETROTTER aims to infer the haplotype composition of each source group for the admixture as a linear combination of those carried by sampled groups. This results in the admixed groups themselves automatically being represented in the same form—as a mixture of mixtures. The left-most plot of the four large plots shows the relative probability of jointly copying two chunks from West Africa and North Italian (itali13) donors, at varying genetic distances, in a Sardinian cluster (sardi13). The curves closely fit an exponential decay (green line) with a rate of 65 generations, or 36 CE. The negative slope for this WestAfrica-itali13 curve suggests that these donors contribute to different sides of an admixture event. The inset tsi70-itali13 curve has a positive slope, showing that tsi70 and itali13 contribute to the same side of the admixture event. We show similar pairs of curves for three other groups (turkm11, croat18, and ceu71) with varying dates and donors of admixture. (B) We define each admixture event by the West Eurasian region that the recipient group comes from (rows) and the identity of the best-matching current-day group to the minor admixture source (colors). We show dates separately for events involving World Region minor sources (left, events shown by links in Figure 2B) and West Eurasian minor sources (right, events shown by links in Figure 2C). For each region, all date bootstraps for events involving a best-matching source from the specified donor region are combined to generate a density. The integrals of the densities are proportional to the number of admixture events used to generate them.
Figure 4
Figure 4
The Impact of Recent Admixture in West Eurasia (A) For each geographic sampling location, we estimated the proportion of ancestry coming from outside of West Eurasia by averaging GLOBETROTTER’s admixture inference across individuals from a sampling location. The sampling locations of each point are shown in Figure S4A; Caucasus populations are spread out to aid visibility. Points are stacked vertically in cases where multiple ancestries are present in a population. (B) Copying vectors of 82 West Eurasian fineSTRUCTURE clusters projected onto PCA based on the copying vectors of 1,000 West Eurasian individuals (faded colors; symbols and colors are as in Figure 1B); lines link World Region admixture sources to the clusters in which admixture from them is inferred. (C) Gene flow within West Eurasia is shown by lines linking the best-matching donor group to the sources of admixture with recipient clusters (arrowhead). Line colors represent the regional identity of the donor group, and line thickness represents the proportion of DNA coming from the donor group. Ranges of the dates (point estimates) for events involving sources most similar to selected donor groups are shown. (D and E) The pre-admixture structure of West Eurasian groups is shown by projecting all admixture source copying vectors that most closely match a West Eurasian group (n = 81) and the cluster copying vectors where we do not infer admixture (n = 18) onto the same PCA as (B). Heatmaps show pairwise total variation distance (TVD) between the Major admixture source copying vectors of all clusters where we infer admixture (n = 64; E) and copying vectors generated by combining the Major and Minor admixture sources at inferred admixture proportions. (F) In cases where we infer one date multiway or two dates, we show the major source for the first and/or most recent event only. Clusters are in the same order from top to bottom as in the tree in Figure 1, and axis colors describe the geographical origin of the cluster. (G) Violin plots comparing the distribution of TVD between the same two sets of copying vectors. The white point indicates the median value; the box shows the 25–75 percentiles; and the plots are truncated at the 2.5 and 97.5 percentiles. The colored shapes show kernel densities.

Similar articles

Cited by

References

    1. Haak W., Balanovsky O., Sanchez J.J., Koshel S., Zaporozhchenko V., Adler C.J., Der Sarkissian C.S., Brandt G., Schwarz C., Nicklisch N., Members of the Genographic Consortium Ancient DNA from European early neolithic farmers reveals their near eastern affinities. PLoS Biol. 2010;8:e1000536. - PMC - PubMed
    1. Skoglund P., Malmström H., Raghavan M., Storå J., Hall P., Willerslev E., Gilbert M.T., Götherström A., Jakobsson M. Origins and genetic legacy of Neolithic farmers and hunter-gatherers in Europe. Science. 2012;336:466–469. - PubMed
    1. Malmström H., Gilbert M.T.P., Thomas M.G., Brandström M., Storå J., Molnar P., Andersen P.K., Bendixen C., Holmlund G., Götherström A., Willerslev E. Ancient DNA reveals lack of continuity between neolithic hunter-gatherers and contemporary Scandinavians. Curr. Biol. 2009;19:1758–1762. - PubMed
    1. Lazaridis I., Patterson N., Mittnik A., Renaud G., Mallick S., Kirsanow K., Sudmant P.H., Schraiber J.G., Castellano S., Lipson M. Ancient human genomes suggest three ancestral populations for present-day Europeans. Nature. 2014;513:409–413. - PMC - PubMed
    1. Haak W., Lazaridis I., Patterson N., Rohland N., Mallick S., Llamas B., Brandt G., Nordenfelt S., Harney E., Stewardson K. Massive migration from the steppe was a source for Indo-European languages in Europe. Nature. 2015;522:207–211. - PMC - PubMed

Publication types

Substances

Associated data