

Passive Transport Disrupts Grid Signals in the Parahippocampal Cortex
- PMID: 26387719
- PMCID: PMC4596791
- DOI: 10.1016/j.cub.2015.08.034
Passive Transport Disrupts Grid Signals in the Parahippocampal Cortex
Abstract
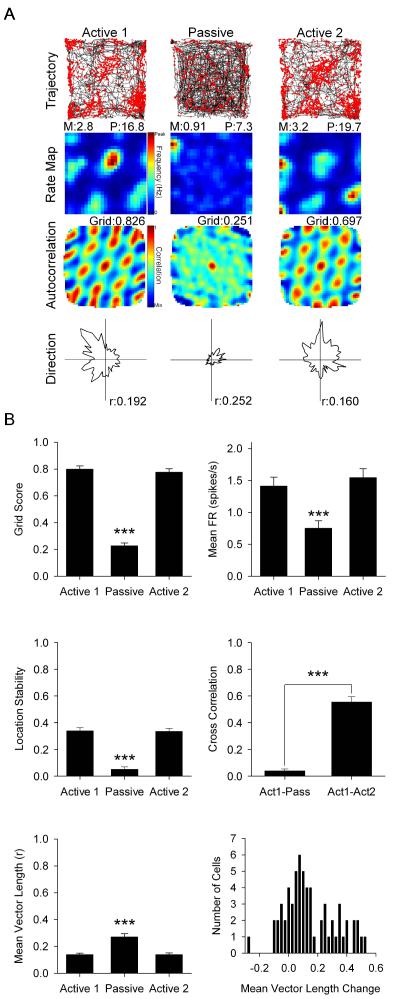
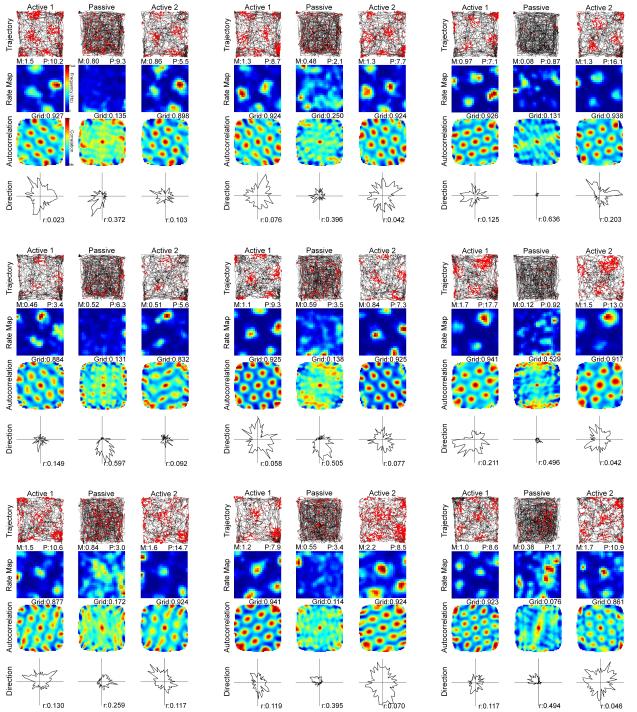
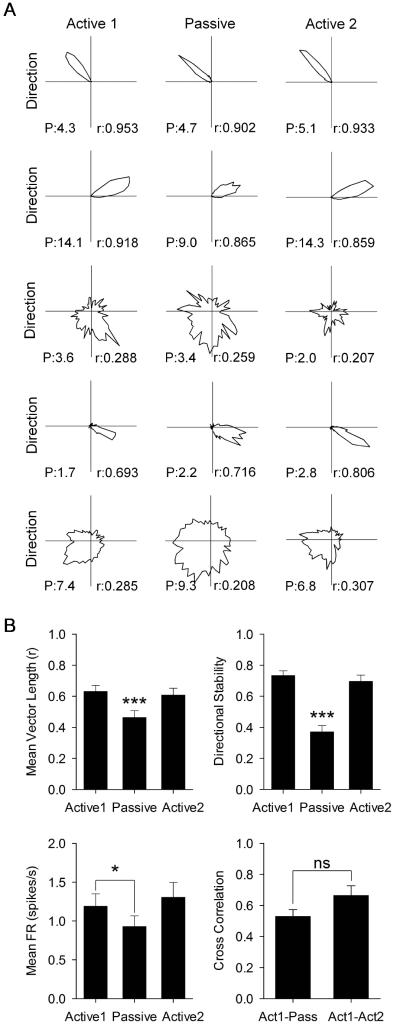
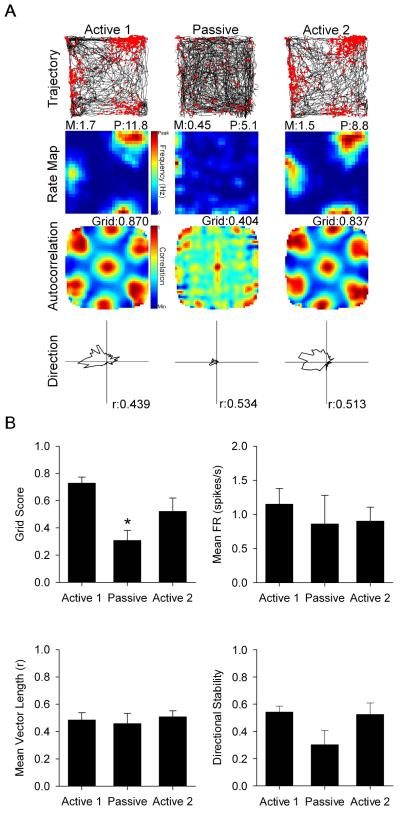
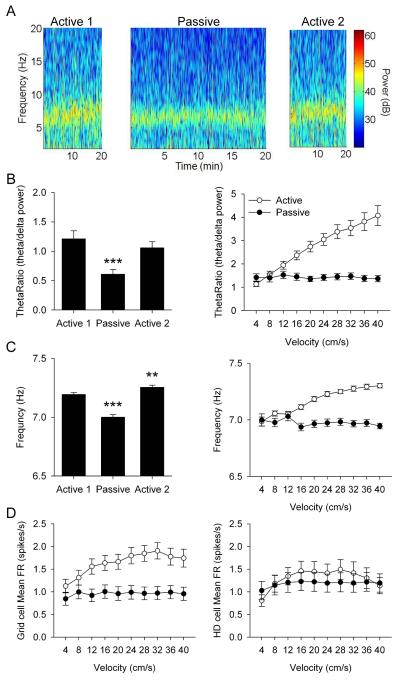
Navigation is usually thought of relative to landmarks, but neural signals representing space also use information generated by an animal's movements. These signals include grid cells, which fire at multiple locations, forming a repeating grid pattern. Grid cell generation depends upon theta rhythm, a 6-10 Hz electroencephalogram (EEG) oscillation that is modulated by the animals' movement velocity. We passively moved rats in a clear cart to eliminate motor related self-movement cues that drive moment-to-moment changes in theta rhythmicity. We found that passive movement maintained theta power and frequency at levels equivalent to low active movement velocity, spared overall head-direction (HD) cell characteristics, but abolished both velocity modulation of theta rhythmicity and grid cell firing patterns. These results indicate that self-movement motor cues are necessary for generating grid-specific firing patterns, possibly by driving velocity modulation of theta rhythmicity, which may be used as a speed signal to generate the repeating pattern of grid cells.
Keywords: grid cell; head-direction cell; passive transport; self-movement cues; theta rhythm.
Copyright © 2015 Elsevier Ltd. All rights reserved.
Figures
Comment in
-
Spatial Cognition: Grid Cell Firing Depends on Self-Motion Cues.Curr Biol. 2015 Oct 5;25(19):R827-9. doi: 10.1016/j.cub.2015.08.020. Curr Biol. 2015. PMID: 26439335
References
-
- Fyhn M, Molden S, Witter MP, Moser EI, Moser MB. Spatial representation in the entorhinal cortex. Science. 2004;305:1258–1264. - PubMed
-
- Hafting T, Fyhn M, Modlen S, Moser MB, Moser EI. Microstructure of a spatial map in the entorhinal cortex. Nature. 2005;436:801–806. - PubMed
-
- Boccara CN, Sargolini F, Thoresen VH, Solstad T, Witter MP, Moser EI, Moser MB. Grid cells in pre- and parasubiculum. Nature Neurosci. 2010;13:987–994. - PubMed
-
- McNaughton BL, Battaglia FP, Jensen O, Moser EI, Moser MB. Path integration and the neural basis of the ‘cognitive map’. Nat. Rev. Neurosci. 2006;7:663–678. - PubMed
-
- Moser EI, Kropff E, Moser MB. Place cells, grid cells, and the brain’s spatial representation system. Annu. Rev. Neurosci. 2008;31:69–89. - PubMed
Publication types
MeSH terms
Grants and funding
LinkOut - more resources
Full Text Sources
Other Literature Sources
