. 2015 Sep 21:16:178.
doi: 10.1186/s13059-015-0739-5.

Single-cell transcriptomic reconstruction reveals cell cycle and multi-lineage differentiation defects in Bcl11a-deficient hematopoietic stem cells

Affiliations

Single-cell transcriptomic reconstruction reveals cell cycle and multi-lineage differentiation defects in Bcl11a-deficient hematopoietic stem cells

Jason C H Tsang et al. Genome Biol. .

Abstract

Background: Hematopoietic stem cells (HSCs) are a rare cell type with the ability of long-term self-renewal and multipotency to reconstitute all blood lineages. HSCs are typically purified from the bone marrow using cell surface markers. Recent studies have identified significant cellular heterogeneities in the HSC compartment with subsets of HSCs displaying lineage bias. We previously discovered that the transcription factor Bcl11a has critical functions in the lymphoid development of the HSC compartment.

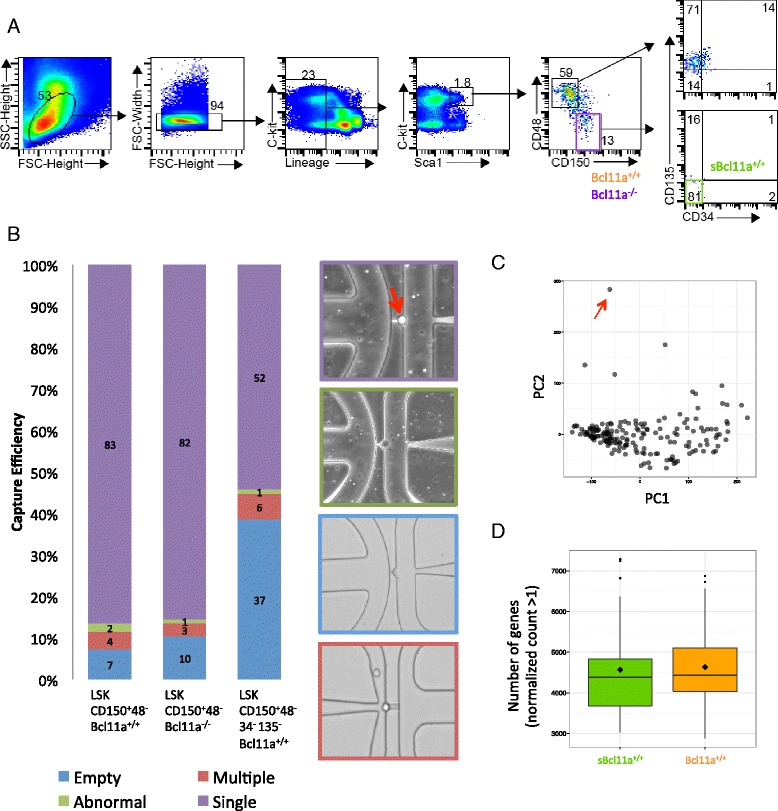
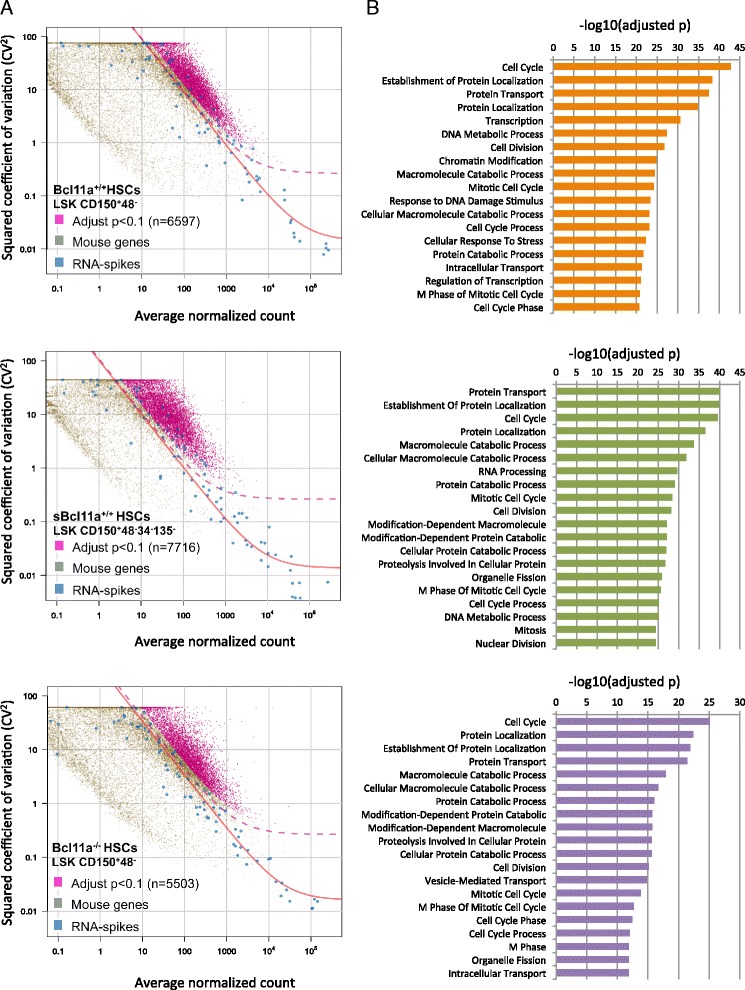
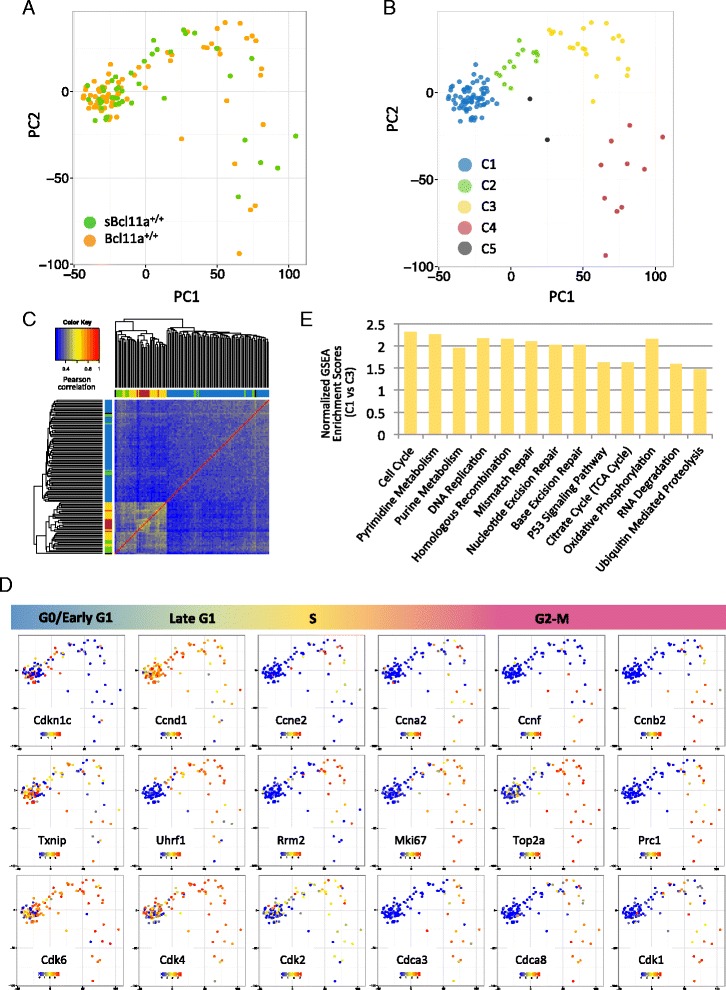
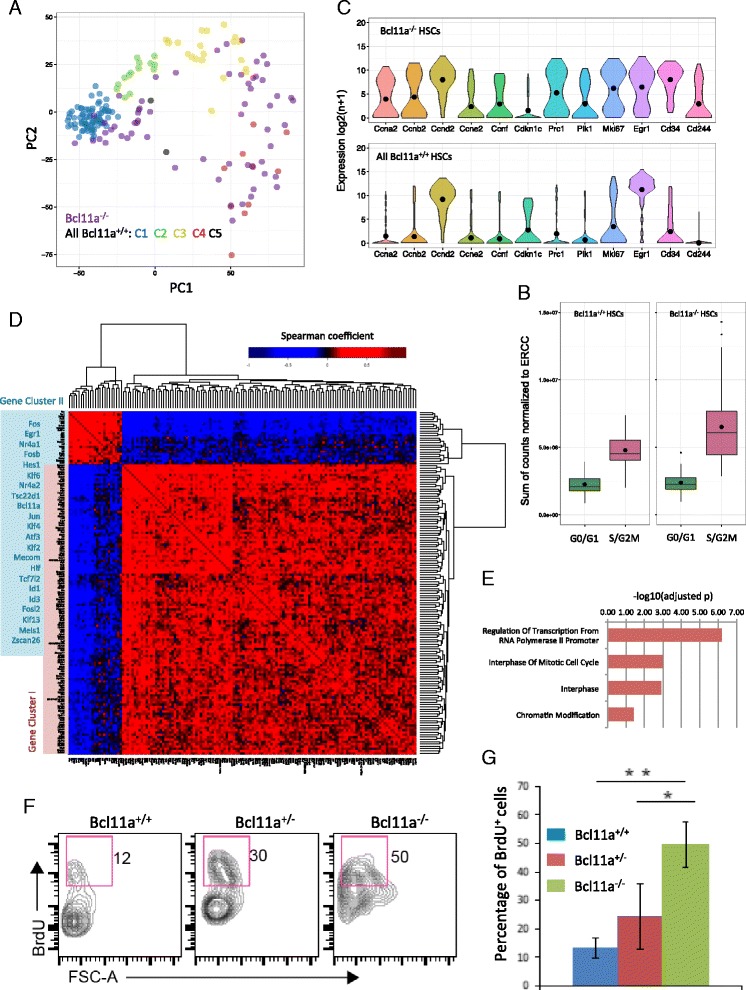
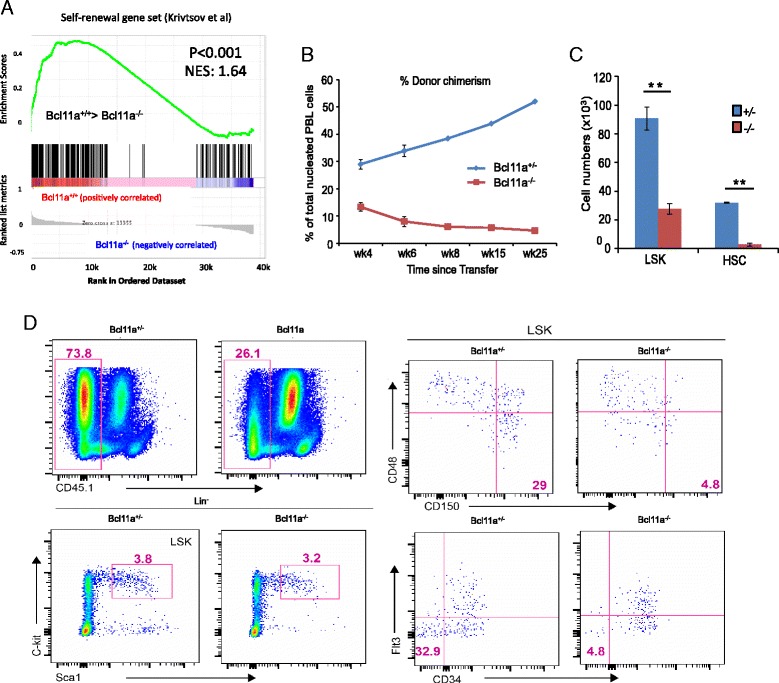
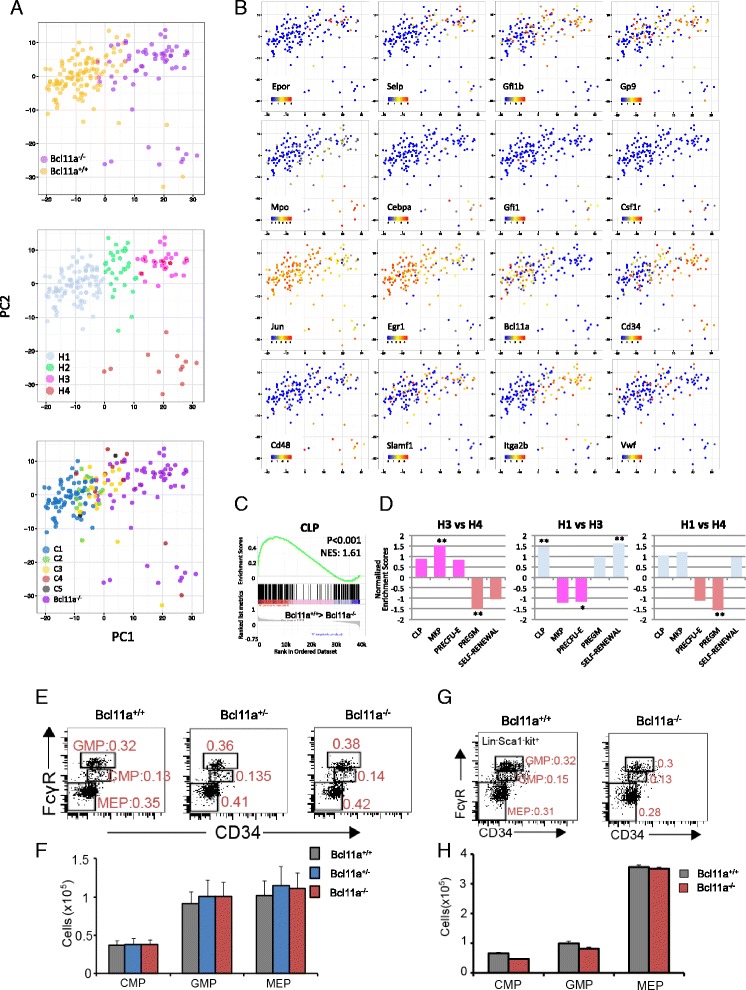
Results: In this report, we employ single-cell transcriptomic analysis to dissect the molecular heterogeneities in HSCs. We profile the transcriptomes of 180 highly purified HSCs (Bcl11a (+/+) and Bcl11a (-/-)). Detailed analysis of the RNA-seq data identifies cell cycle activity as the major source of transcriptomic variation in the HSC compartment, which allows reconstruction of HSC cell cycle progression in silico. Single-cell RNA-seq profiling of Bcl11a (-/-) HSCs reveals abnormal proliferative phenotypes. Analysis of lineage gene expression suggests that the Bcl11a (-/-) HSCs are constituted of two distinct myeloerythroid-restricted subpopulations. Remarkably, similar myeloid-restricted cells could also be detected in the wild-type HSC compartment, suggesting selective elimination of lymphoid-competent HSCs after Bcl11a deletion. These defects are experimentally validated in serial transplantation experiments where Bcl11a (-/-) HSCs are myeloerythroid-restricted and defective in self-renewal.

Conclusions: Our study demonstrates the power of single-cell transcriptomics in dissecting cellular process and lineage heterogeneities in stem cell compartments, and further reveals the molecular and cellular defects in the Bcl11a-deficient HSC compartment.


Figures

Fig. 1
Fig. 1
Single-cell transcriptome profiling of mouse HSCs by microfluidic system. a Gating strategy for HSC purification. Bcl11a +/+ and Bcl11a −/− HSCs were isolated by sorting markers LSK CD150+48 and sBcl11a +/+ HSCs by markers LSK CD150+4834135. Lineage markers used for enrichment included B220, CD19, CD3, CD4, CD8, TCRγδ, TCRβ, NK1.1, CD11b, Gr-1, Ter119. FSC: Forward scatter, SSC: Side scatter. b Single-cell capturing efficiency by the C1 AutoPrep microfluidic system and representative microscopic images of individual capture sites. A representative high-quality single HSC at an individual capture site is indicated by the red arrow. Representative pictures of poor quality cells, an empty capture site and a multiplet capture site are framed in colors as indicated in the key. c Principal component analysis of the transcriptome of all 181 HSCs passed initial computational quality control. One significant outlier from the Bcl11a +/+ dataset was identified (marked by red arrow). It was removed from subsequent analysis. d Boxplot comparing the number of genes detected (normalized count >1) in the sBcl11a +/+ and Bcl11a +/+ datasets. The two datasets were comparable, despite low sequencing depth of the sBcl11a +/+ dataset
Fig. 2
Fig. 2
Identification of cell cycle activity as the dominant source of transcriptional heterogeneities in the HSC compartment. a Identification of highly variable genes in Bcl11a +/+ (upper panel), sBcl11a +/+ (middle panel) and Bcl11a −/− (lower panel) HSCs. The expression variability of individual genes measured by the squared coefficient of variation (CV2) is plotted against the mean expression level (normalized counts). Magenta points indicate mouse genes (Bcl11a +/+, 6597; sBcl11a +/+, 7716; Bcl11a −/−, 5503) showing higher than expected expression variability compared with external RNA spike-ins (blue) (adjusted p value <0.1). The red line is the fitted line of the spike-ins and the dashed line marks the margin for genes with 50 % biological CV. b The top 20 gene ontology terms enriched in the highly variable genes among Bcl11a +/+ (upper panel), sBcl11a +/+ (middle panel) and Bcl11a −/− (lower panel) HSCs. The p value was adjusted by the Benjamini and Hochberg method for multiple testing
Fig. 3
Fig. 3
Transcriptomic reconstruction of cell cycle progression by single-cell RNA-seq. a PCA of Bcl11a +/+ HSCs based on the expression of 2212 cell cycle-related genes annotated in the GO, Cyclebase database and Oki et al. [19]. The loading plot of the first two principal components is shown. Each point represents one HSC. b Subgrouping of Bcl11a +/+ HSCs by PCA. The Bcl11a +/+ HSCs were grouped into five different clusters (C1–5) based on their proximity in the PCA loading plot as in (a). c Hierarchical clustering and Pearson correlation heatmap of Bcl11a +/+ HSCs. Correlation between Bcl11a +/+ HSCs was estimated by the Pearson correlation coefficients. The column and row colors shown above and to the left correspond to the five subgroups by PCA as in (b). d PCA loading plots of Bcl11a +/+ HSCs as in (a) with expression of selected cell cycle stage-specific genes overlaid. The expression level was calculated as log10 (normalized counts +1). e The normalized enrichment scores of significantly enriched gene sets (p < 0.05, false discovery rate < 0.05) in the C3 cluster compared with the C1 cluster curated by the Kyoto Encyclopedia of Genes and Genomes (KEGG) database. GSEA gene set enrichment analysis
Fig. 4
Fig. 4
Bcl11a-deficient HSCs showed significant proliferative changes in the HSC compartment. a Distribution of Bcl11a −/− HSCs (purple) and cell cycle reconstructed-Bcl11a +/+ HSC clusters (C1–C5) in a PCA loading plot of the first two principal components. b Boxplots comparing the transcriptional activity of G0/G1 stage (C1 and C2) and S/G2/M stage (C3 and C4) HSCs in the Bcl11a +/+ and Bcl11a −/− datasets, estimated by the total number of read counts normalized by ERCC size factor per cell. c Violin plots of gene expression of selected cyclin genes, progenitor markers and cell cycle stage-associated genes in Bcl11a +/+ and Bcl11a −/− HSCs. The black dots represent the mean expression for each gene. d Heatmap showing expression correlations of selected transcription regulators in the HSC compartment. Correlation coefficient was calculated by Spearman correlation coefficient and clustering was performed by complete linkage. Gene correlation cluster II (blue) is magnified. e Enriched GO terms in gene correlation cluster I [red in (d)]. f Validation of cell cycle changes in Bcl11a −/− HSCs by 5-bromodeoxyuridine (BrdU) staining. The purple box marks the BrdU+ fraction in the HSC compartment of different genotypes. FSC-A: Forward scatter area. g The dose-dependent changes in BrdU+ cell number in the HSC compartment in different Bcl11a genotypes. HSCs were harvested and sorted from adult mouse bone marrow 5 days after tamoxifen-induced Bcl11a ablation. *p < 0.05, **p < 0.01, n = 3 mice for each group. Bcl11a +/−, CreERT2; Bcl11a +/flox (treated with tamoxifen); Bcl11a −/−, CreERT2; Bcl11a flox/flox (treated with tamoxifen). The error bar represented mean ± 1 standard deviation
Fig. 5
Fig. 5
Bcl11a-deficient HSCs show self-renewal defects. a Gene set enrichment analysis showing significant depletion of the self-renewal gene signature in Bcl11a −/− HSCs (p < 0.001). The normalized enrichment score (NES) of 1.64 indicates significantly higher self-renewal gene expression in the Bcl11a +/+ HSCs compared with Bcl11a −/− HSCs. b Percentage of donor cells in total nucleated peripheral blood (PBL) cells along with time after transfer. We injected 2000 Bcl11a +/− or Bcl11a −/− LSKs (CD45.1) with 1.0 × 10⁶ bone marrow (BM) cells (CD45.1+) into sublethally irradiated recipient mice (CD45.1+). c Comparison of the number of donor LSK cells and HSCs in secondary recipient mice 18 weeks post-secondary transfer; *p < 0.05, **p < 0.01. d FACS dot plot of donor Bcl11a +/− and Bcl11a −/− HSCs (LSK CD150+48 and LSK CD34135(Flt3)) in secondary recipient mice. BM cells were analyzed 18 weeks post-secondary transfer. Bcl11a +/−, CreERT2; Bcl11a +/flox (treated with tamoxifen); Bcl11a −/−, CreERT2; Bcl11a flox/flox (treated with tamoxifen). In panels (b) and (c), at least three mice were used for each time point or each cell type in independent experiments. The error bar represented mean ± 1 standard deviation
Fig. 6
Fig. 6
The Bcl11a-deficient HSC compartment contained two distinct myeloerythroid subpopulations and showed myeloerythroid-restriction in lineage reconstitution. a PCA loading plot of HSCs based on their expression of hematopoietic genes. Upper panel: the HSCs were labeled based on their corresponding genotypes. Middle panel: HSCs were grouped into four different subgroups and colored based on their locations in the loading plot. Lower panel: HSCs were labeled based on their cell cycle stages defined in Fig. 3b. b PCA loading plot of HSCs with expression of selected hematopoietic genes overlaid. The expression level is calculated as log10(Normalized counts + 1). c GSEA showing significant depletion of the common lymphoid progenitor signature in Bcl11a −/− HSCs (p < 0.001). The normalized enrichment score (NES) of 1.61 indicates significantly higher lymphoid signature in the Bcl11a +/+ HSCs compared with Bcl11a −/− HSCs. d Normalized enrichment scores of different lineage progenitor signatures in different subgroup pair-wise comparisons. *: p <0.05, **: p <0.01 e Analysis of the number of bone marrow (BM) CMPs, GMPs and MEPs with different genotypes by flow cytometry one week after tamoxifen injection. Numbers refer to percentages in total BM nucleated cells. Lin BM cells were analyzed and n = 4 mice for each genotype. f Comparison of the numbers of myeloerythroid progenitors with different genotypes as in (e). g Analysis of the number of BM CMPs, GMPs and MEPs in primary recipient by flow cytometry 8 weeks after LSK and helper BM cells transplantation from donors (CD45.1) with different genotypes. Numbers refer to percentages of progenitors in total BM nucleated cells. h Comparison of the cell numbers of myeloerythroid progenitors in different genotypes as in (g). Cells were harvested from the two femurs of each mouse (n = 4/genotype). The error bar represented mean ± 1 standard deviation

Similar articles

Cited by

References

    1. Orkin SH, Zon LI. Hematopoiesis: an evolving paradigm for stem cell biology. Cell. 2008;132:631–44. doi: 10.1016/j.cell.2008.01.025. - DOI - PMC - PubMed
    1. Spangrude GJ, Heimfeld S, Weissman IL. Purification and characterization of mouse hematopoietic stem cells. Science. 1988;241:58–62. doi: 10.1126/science.2898810. - DOI - PubMed
    1. Ogawa M, Matsuzaki Y, Nishikawa S, Hayashi S, Kunisada T, Sudo T, et al. Expression and function of c-kit in hemopoietic progenitor cells. J Exp Med. 1991;174:63–71. doi: 10.1084/jem.174.1.63. - DOI - PMC - PubMed
    1. Christensen JL, Weissman IL. Flk-2 is a marker in hematopoietic stem cell differentiation: a simple method to isolate long-term stem cells. Proc Natl Acad Sci U S A. 2001;98:14541–6. doi: 10.1073/pnas.261562798. - DOI - PMC - PubMed
    1. Kiel MJ, Yilmaz OH, Iwashita T, Yilmaz OH, Terhorst C, Morrison SJ. SLAM family receptors distinguish hematopoietic stem and progenitor cells and reveal endothelial niches for stem cells. Cell. 2005;121:1109–21. doi: 10.1016/j.cell.2005.05.026. - DOI - PubMed

Publication types