. 2015 Dec 1;22(6):1009-19.
doi: 10.1016/j.cmet.2015.09.003. Epub 2015 Sep 17.

MYC Disrupts the Circadian Clock and Metabolism in Cancer Cells

Affiliations

MYC Disrupts the Circadian Clock and Metabolism in Cancer Cells

Brian J Altman et al. Cell Metab. .

Abstract

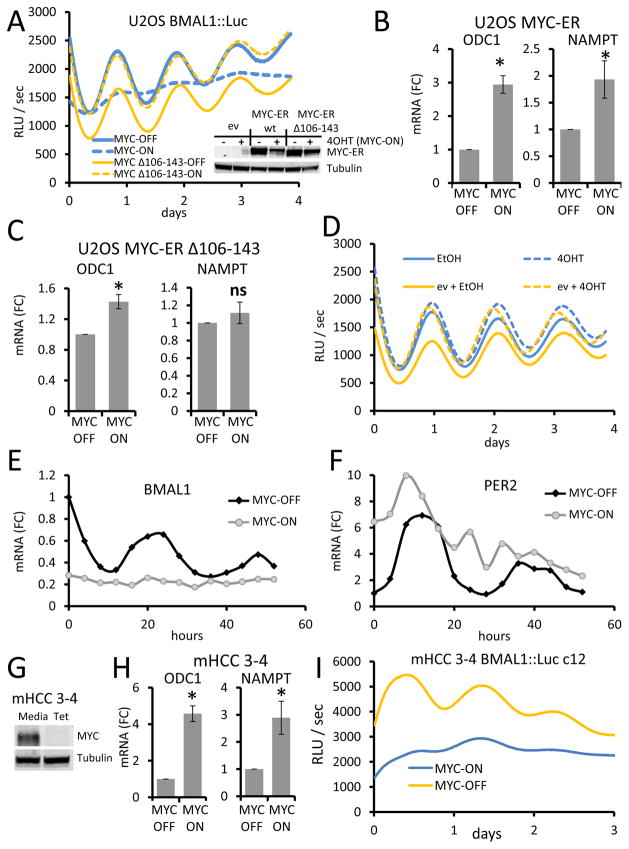
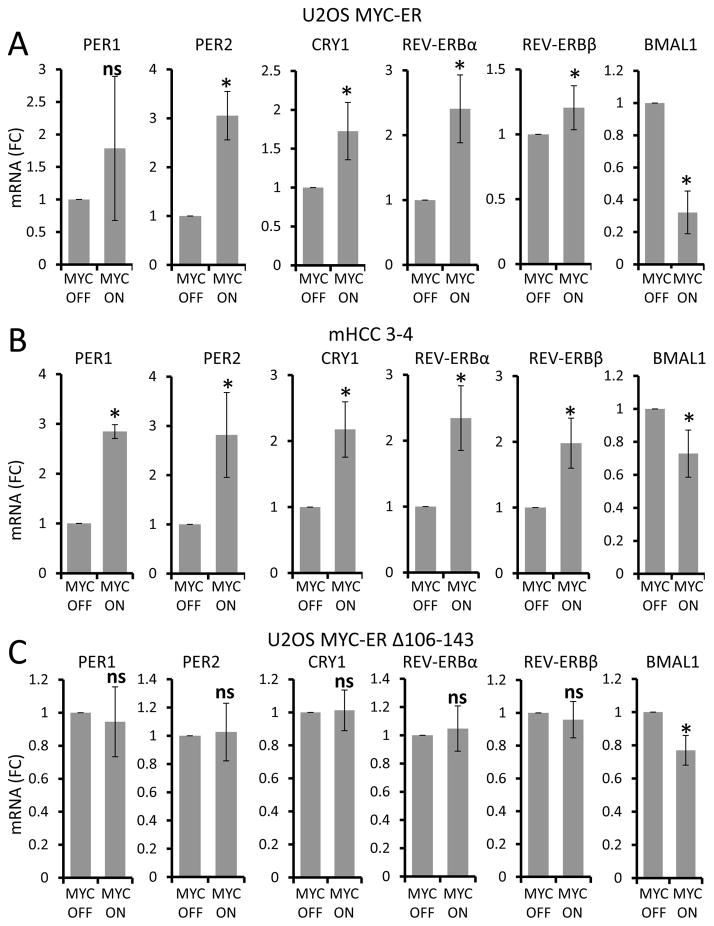
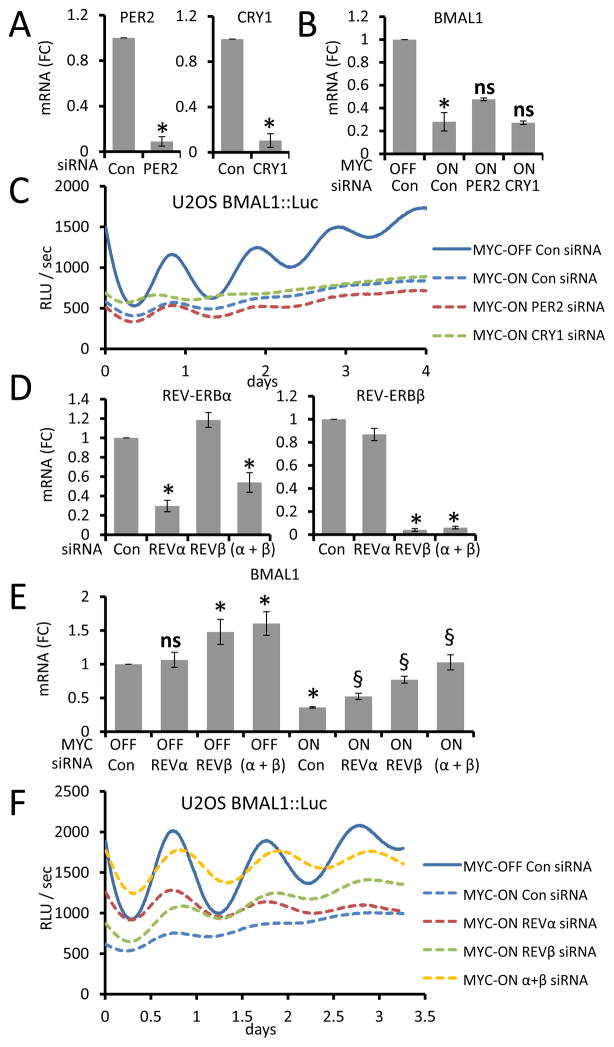
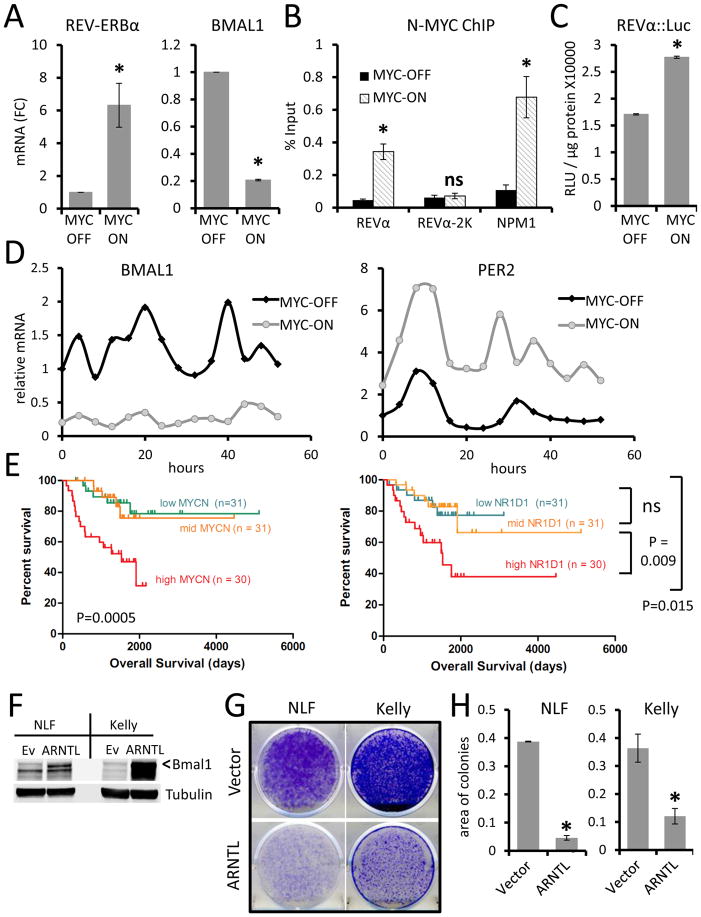
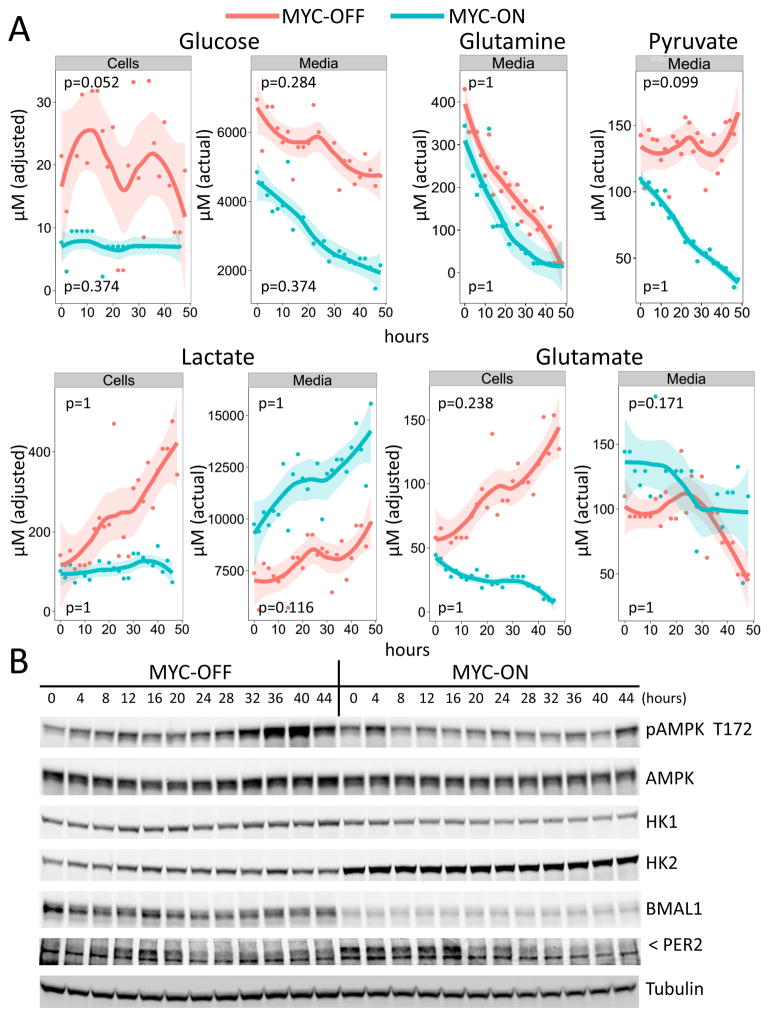
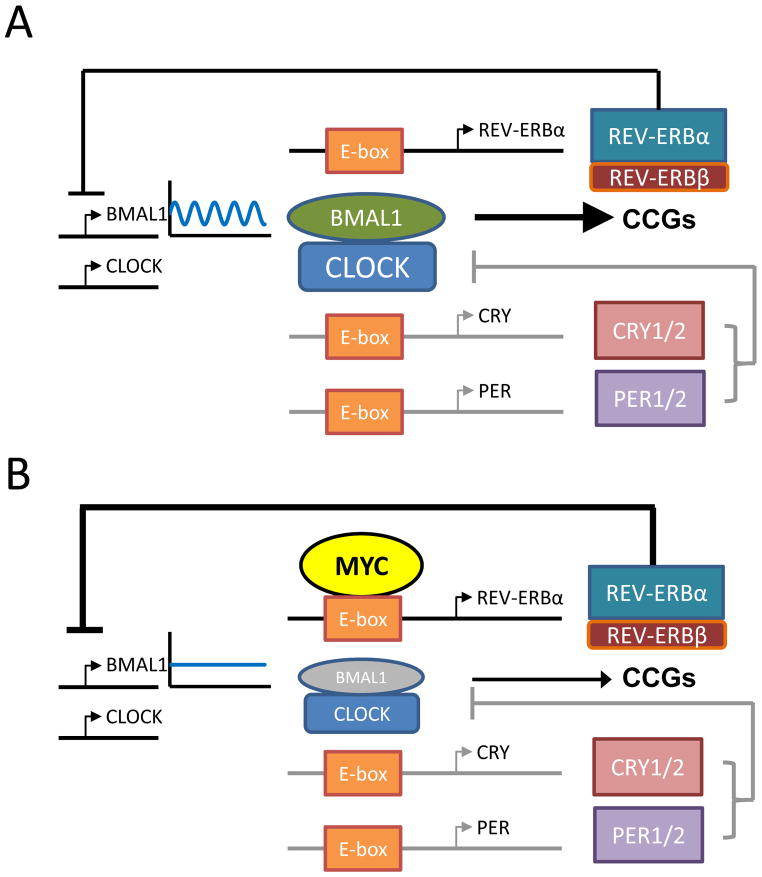
The MYC oncogene encodes MYC, a transcription factor that binds the genome through sites termed E-boxes (5'-CACGTG-3'), which are identical to the binding sites of the heterodimeric CLOCK-BMAL1 master circadian transcription factor. Hence, we hypothesized that ectopic MYC expression perturbs the clock by deregulating E-box-driven components of the circadian network in cancer cells. We report here that deregulated expression of MYC or N-MYC disrupts the molecular clock in vitro by directly inducing REV-ERBα to dampen expression and oscillation of BMAL1, and this could be rescued by knockdown of REV-ERB. REV-ERBα expression predicts poor clinical outcome for N-MYC-driven human neuroblastomas that have diminished BMAL1 expression, and re-expression of ectopic BMAL1 in neuroblastoma cell lines suppresses their clonogenicity. Further, ectopic MYC profoundly alters oscillation of glucose metabolism and perturbs glutaminolysis. Our results demonstrate an unsuspected link between oncogenic transformation and circadian and metabolic dysrhythmia, which we surmise to be advantageous for cancer.


Conflict of interest statement

The authors declare no competing financial interests.

Figures

Figure 1
Figure 1. MYC disrupts circadian rhythm
A. U2OS BMAL1::Luc cells stably expressing either human wild-type MYC-ER or human MYC-ER Δ106–143 (as visualized by immunoblot, inset) were treated with 4-hydroxytamoxifen (4OHT, MYC-ON) to activate MYC-ER or ethanol (EtOH, MYC-OFF) control and synchronized with dexamethasone. BMAL1 promoter activity luminescence was continuously measured (every 10 min) in a LumiCycle luminometer. Data are representative of more than three experiments. B, C. Expression of ornithine decarboxylase (ODC) or NAMPT in U2OS MYC-ER (B) or MYC-ER Δ106–143 cells as determined by RT-PCR, normalized to Beta-2-microglobulin (β2M). Data are shown as means + SD (n = 4). mRNA (FC) = Fold Change. D. U2OS BMAL1::Luc cells expressing pBabe-Zeo empty vector (ev) or mock infected were cultured with 4OHT or ethanol, synchronized with dexamethasone, and monitored in LumiCycle luminometer. Data are representative of three or more experiments. E. Endogenous BMAL1 or (F) PER2 mRNA expression in synchronized U2OS MYC-ER cells was determined by RT-PCR, normalized to β2M. Data are representative of two or more experiments. G. Immunoblot of tetracycline regulated MYC in mHCC 3–4 cells. Tubulin serves as loading control. H. Expression of ODC and NAMPT in mHCC 3–4 cells as determined by RT-PCR. Data are shown as means + SD (n = 5). I. mHCC 3–4 BMAL1::Luc cell clone (c12) treated with tetracycline (tet, MYC-OFF) or control (−tet, MYC-ON) and synchronized with dexamethasone was monitored as in (A). RLU = relative light units. For B, C, and H, *p < 0.05 by Student’s t test of MYC-ON samples relative MYC-OFF samples.
Figure 2
Figure 2. MYC upregulates circadian repressor genes
A–C. Expression of clock factor genes (indicated above each graph) in (A) U2OS MYC-ER cells treated with either 4OHT (MYC-ON) or EtOH (MYC-OFF) control for 24 h. (B) mHCC 3–4 cells treated with (+Tet, MYC-OFF) or without (−Tet, MYC-ON) tetracycline for 24 h, or (C) U2OS MYC-ER Δ106–143 cells treated with either 4OHT (MYC-ON) or EtOH (MYC-OFF) control for 24 h. mRNA expression determined by RT-PCR was normalized to β2M expression. mRNA (FC) = Fold Change. Means and SDs from at least three experiments are shown. *p < 0.05 by Student’s t test of 4OHT (MYC-ON) samples relative to EtOH (MYC-OFF) samples or −Tet (MYC-ON) samples relative to +Tet (MYC-OFF) samples, ns = not significant.
Figure 3
Figure 3. REV-ERBa and β are necessary for MYC disruption of BMAL1 promoter oscillation
A. mRNA levels (normalized to expression of β2M) for PER2 or CRY1 determined by RT-PCR in U2OS MYC-ER cells transfected with either non-targeting siRNA (Con), siRNA against PER2, or CRY1 for 48 h with 4OHT (MYC-ON) being added to cells 24 hours after transfection. Means and SDs from at least three experiments are shown. *p < 0.05 for Con vs. siPER2 or siCRY1. mRNA (FC) = Fold Change. B. BMAL1 mRNA expression (normalized to expression of β2M) in U2OS MYC-ER transfected as described in (A) with siRNAs indicated at the bottom. *p < 0.05 by Student’s t test for MYC-ON vs. MYC-OFF. ns = not significant. C. U2OS MYC-ER cells were transfected with siRNAs as indicated in the figure, synchronized with dexamethasone and monitored using a LumiCycle luminometer. Data are representative of two or more experiments. D. mRNA levels (normalized to expression of β2M) for REV-ERBα or REV-ERBβ determined by RT-PCR in U2OS MYC-ER cells transfected with either non-targeting siRNA (Con), siRNA against REV-ERBα, REV-ERBβ, or both REV-ERBs (α+β) for 48 h with 4OHT (MYC-ON) being added to cells 24 hours after transfection. Means and SDs from at least three experiments are shown. *p < 0.05 for siREV vs. control. E. BMAL1 mRNA levels (normalized to expression of β2M) in U2OS MYC-ER transfected with the indicated siRNAs (bottom) as described in (D) and cultured with 4OHT (MYC-ON) or EtOH (MYC-OFF) after 24 hours. Means and SDs from at least three experiments are shown. *p < 0.05 by Student’s t test for siREV or Con MYC-ON vs. Con MYC-OFF. §, p< 0.05 siREV vs. Con MYC-ON. F. U2OS MYC-ER cells transfected with the indicated siRNAs for 48 hours, cultured with 4OHT (MYC-ON) or EtOH (MYC-OFF), synchronized with dexamethasone and monitored as in (C). Data are representative of two or more experiments. RLU = relative light units.
Figure 4
Figure 4. N-MYC directly upregulates REV-ERBa and disrupts circadian rhythm
A. REV-ERBα and BMAL1 mRNA expression (normalized to expression of β2M) determined by RT-PCR in Shep N-MYC-ER expressing neuroblastoma cells with MYC-ON or MYC-OFF. mRNA (FC) = Fold Change. Means and SDs from at least three experiments are shown. *p < 0.05 by Student’s t test for MYC-ON vs. MYC-OFF. B. Chromatin immunopreciptitation (ChIP) analysis with anti-N-MYC antibody in MYC-ON vs. MYC-OFF in Shep N-MYC-ER cells. ChIP signals (% input) are shown for the Rev-erbα promoter E-box region (REVα, 81 bp region), 2Kb upstream of REV-ERBα transcription start site (REVα-2k), and the promoter of the canonical MYC target nucleophosmin 1 (NPM1). Means and SDs from technical triplicates are shown. *p < 0.05 by Student’s t test for MYC-ON vs. MYC-OFF. Data are representative of three or more experiments. C. Activity of the REV-ERBα promoter::luciferase construct (−1156 to +31 region) in Shep N-MYC-ER-expressing cells expressing under MYC-ON vs. MYC-OFF conditions. RLU: relative light unit. Means and SDs from triplicate samples are shown, and *p < 0.05 by Student’s t test for MYC-ON vs. MYC-OFF. Data are representative of three or more experiments. D. Time-series (every 4h) expression of BMAL1 (left panel) or PER2 (right panel) mRNA (relative to β2M) determined by RT-PCR in synchronized Shep N-MYC-ER-expressing cells with MYC-ON or MYC-OFF. Data are representative of two or more experiments. E. Kaplan-Meier survival analysis of patients with neuroblastoma expressing different levels of MYCN or (REV-ERBα) NR1D1 analysis grouped by tertiles based on individual gene expression. Log rank p-values shown. F. Ectopic expression of BMAL1 (ARNTL, indicated by <) in high MYCN neuroblastoma cell lines NLF and Kelly determine by immunoblotting Tubulin serves as loading control. G. Colony suppression assay of cells treated with 1mg/ml G418 showed that ectopic expression of ARNTL suppressed colony formation capacities of NLF and Kelly cells as compared with vector control (ev). H. Quantitation of colony suppression by ARNTL determined by area of colonies on culture plates measured by ImageJ. n = 3, error bars represent SD. *p <0.05 by Student’s t-test.
Figure 5
Figure 5. MYC suppresses circadian oscillation of glucose metabolism and alters glutamine metabolism in U2OS cells
A. Cellular (Cells) or media metabolite (top labels) levels determined by NMR spectroscopy are shown for a time-series experiment with 2 h-intervals from U2OS with MYC-OFF (EtOH) or MYC-ON (4OHT), 24 hours after initial dexamethasone synchronization. Concentrations for metabolites represent the adjusted concentration for cells, based on extraction volume, or the actual concentration of media metabolites. For each metabolite profile, the time-series data were plotted using the JTK v2 algorithm after linear detrending and rhythmicity assessed via a non-parametric cosine function fit. The colored bands represent 95% confidence intervals from the locally weighted scatterplot smoothing function that generated the curves. P-values indicate the significance of the cosine wave fit to experimental data. Note that MYC-ON media 24 hour sample and MYC-ON cells 48 hour sample were excluded due to inconsistencies in sample measurements. B. Synchronized U2OS MYC-ER cells were harvested after treatment and lysates were processed for immunoblots of hexokinase 1 (HK1), hexokinase 2 (HK2), phospho-AMP kinase (pAMPK Thr172), AMP-kinase (AMPK), BMAL1, and PER2 (indicated by <). Tubulin serves as a loading control. Data are representative of two individual experiments.
Figure 6
Figure 6. Model of circadian rhythm disruption by MYC
Summary diagram of normal molecular clock (top) molecular clock disrupted by Myc (bottom).

Comment in

References

    1. Asher G, Schibler U. Crosstalk between components of circadian and metabolic cycles in mammals. Cell Metab. 2011;13:125–137. - PubMed
    1. Baggs JE, Price TS, DiTacchio L, Panda S, Fitzgerald GA, Hogenesch JB. Network features of the mammalian circadian clock. PLoS Biol. 2009;7:e52. - PMC - PubMed
    1. Balsalobre A, Brown SA, Marcacci L, Tronche F, Kellendonk C, Reichardt HM, Schutz G, Schibler U. Resetting of circadian time in peripheral tissues by glucocorticoid signaling. Science. 2000;289:2344–2347. - PubMed
    1. Bass J. Circadian topology of metabolism. Nature. 2012;491:348–356. - PubMed
    1. Bass J, Takahashi JS. Circadian integration of metabolism and energetics. Science. 2010;330:1349–1354. - PMC - PubMed

Publication types

MeSH terms