. 2016 Aug;76(2):391-401.
doi: 10.1002/mrm.25879. Epub 2015 Sep 21.

(13) C magnetic resonance spectroscopy measurements with hyperpolarized [1-(13) C] pyruvate can be used to detect the expression of transgenic pyruvate decarboxylase activity in vivo

Affiliations

(13) C magnetic resonance spectroscopy measurements with hyperpolarized [1-(13) C] pyruvate can be used to detect the expression of transgenic pyruvate decarboxylase activity in vivo

Piotr Dzien et al. Magn Reson Med. 2016 Aug.

Abstract

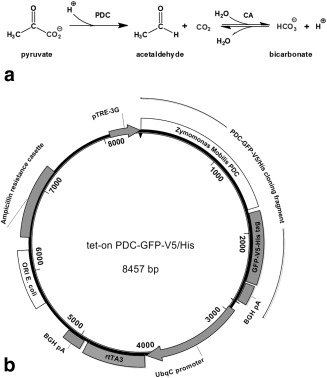
Purpose: Dissolution dynamic nuclear polarization can increase the sensitivity of the (13) C magnetic resonance spectroscopy experiment by at least four orders of magnitude and offers a novel approach to the development of MRI gene reporters based on enzymes that metabolize (13) C-labeled tracers. We describe here a gene reporter based on the enzyme pyruvate decarboxylase (EC 4.1.1.1), which catalyzes the decarboxylation of pyruvate to produce acetaldehyde and carbon dioxide.

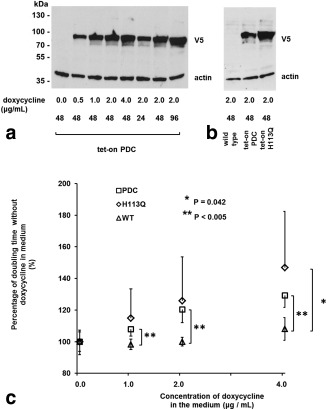
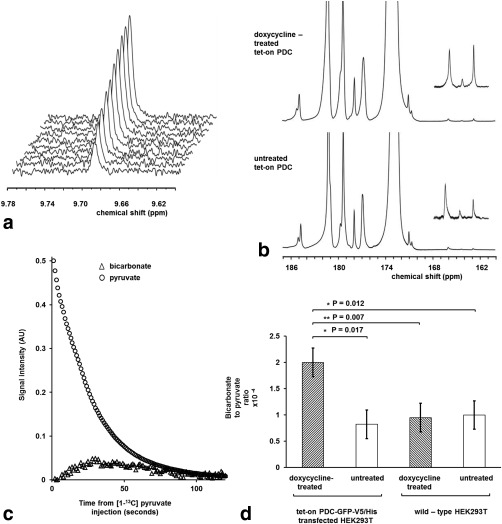
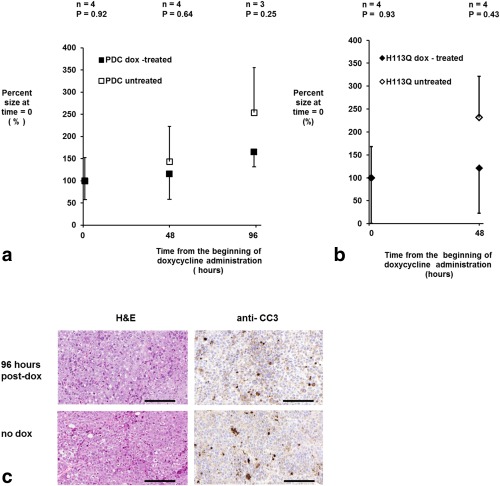
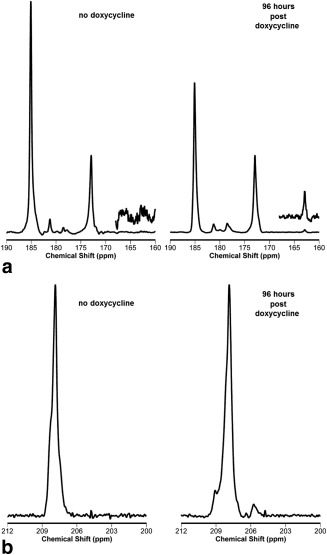
Methods: Pyruvate decarboxylase from Zymomonas mobilis (zmPDC) and a mutant that lacked enzyme activity were expressed using an inducible promoter in human embryonic kidney (HEK293T) cells. Enzyme activity was measured in the cells and in xenografts derived from the cells using (13) C MRS measurements of the conversion of hyperpolarized [1-(13) C] pyruvate to H(13) CO3-.

Results: Induction of zmPDC expression in the cells and in the xenografts derived from them resulted in an approximately two-fold increase in the H(13) CO3-/[1-(13) C] pyruvate signal ratio following intravenous injection of hyperpolarized [1-(13) C] pyruvate.

Conclusion: We have demonstrated the feasibility of using zmPDC as an in vivo reporter gene for use with hyperpolarized (13) C MRS. Magn Reson Med 76:391-401, 2016. © 2015 The Authors. Magnetic Resonance in Medicine published by Wiley Periodicals, Inc. on behalf of International Society for Magnetic Resonance in Medicine. This is an open access article under the terms of the Creative Commons Attribution License, which permits use, distribution and reproduction in any medium, provided the original work is properly cited.

Keywords: Zymomonas mobilis pyruvate decarboxylase; hyperpolarized [1-13C] pyruvate; reporter genes.


Figures

Figure 1
Figure 1
(a) Reaction catalyzed by zmPDC and subsequent fate of the carbon dioxide produced. CA, carbonic anhydrase. (b) Tet‐on PDC‐GFP‐V5/His vector map. BGH pA, bovine growth hormone poly A sequence (ampicillin resistance cassette contained β‐lactamase coding sequence); ORI E. coli, bacterial origin of replication; pTRE3G, third generation trans‐activator response element containing incomplete herpes virus promoter; rtTA3, trans‐activator protein; UbqC, constitutive mammalian ubiquitin C promoter.
Figure 2
Figure 2
(a) Induction of PDC‐GFP‐V5/His protein expression in vitro. Western blot of a protein extract prepared from cells transfected with the tet‐on PDC‐GFP‐V5/His construct, grown with the indicated concentrations of doxycycline for the indicated times (h) and harvested when ∼80% confluent. A total of 20 µg of protein was loaded per well. Membranes were probed with antibodies against the V5 tag and actin (loading control). The typical exposure time of the x‐ray film was 10–15 s. (b) Western blot of a protein extract prepared from cells transfected with the tet‐on PDC‐GFP‐V5/His and tet‐on PDC/H113Q‐GFP‐V5/His constructs and harvested 48 h after the addition of 2 µg/mL doxycycline to the growth medium. (c) Effect of doxycycline‐induced PDC‐GFP‐V5/His and PDC/H113Q ‐GFP‐V5/His expression on cell doubling times. Four different clones stably transfected with the tet‐on PDC‐GFP‐V5/His construct and four clones transfected with the tet‐on PDC/H113Q ‐GFP‐V5/His construct were used. Untransfected HEK93T cells were used as controls. The data for each clone are an average of at least two independent experiments, each of which was seeded in six replicates. Error bars represent one standard deviation of the mean. Only positive or negative error bars are shown for clarity.
Figure 3
Figure 3
Detection of zmPDC activity in vitro following administration of [U‐2H3] pyruvate and hyperpolarized [1‐13C] pyruvate. (a) 1H spectra were acquired every 2 min, starting from ∼5 min after the addition of 25 mM [U‐2H3] pyruvate, to a lysate prepared from 2.5 × 10⁷ cells that had been grown with 2 µg/mL doxycycline in the medium for 48 h prior to harvest. (b) Spectra acquired during the first 80 s after addition of 75 mM hyperpolarized [1‐13C] pyruvate to suspensions of 5 × 10⁷ cells that had been transfected with the tet‐on PDC‐GFP‐V5/His construct. The cells had been grown with 2 μg/mL doxycycline in the medium for 48 h prior to experiments (doxycycline‐treated tet‐on PDC) or without doxycycline (untreated tet‐on PDC). Peak assignments: lactate (185 ppm), pyruvate hydrate (181 ppm), alanine (177 ppm), pyruvate (172.9 ppm), bicarbonate (162.8 ppm). The insets show a 15× vertical expansion of the 161–168 ppm region of the spectra. The 13C bicarbonate peak at 162.8 ppm was accompanied by unidentified resonances at 166 ppm and 164.3 ppm. (c) Pyruvate and bicarbonate signal intensities following the addition of 75 mM hyperpolarized [1‐13C] pyruvate to a suspension of cells expressing zmPDC. Measurements were made at 9.4T at 37° C (pH ∼7.0). The bicarbonate signal was multiplied 2000 times. (d) Average ratio of the bicarbonate to pyruvate signal intensities in panel b (n = 3 for all experimental conditions).
Figure 4
Figure 4
Demonstration of zmPDC protein expression in vivo in xenografts derived from HEK293T cells transfected with the tet‐on PDC‐GFP‐V5/His construct. (a) Fluorescence in situ hybridization of paraffin‐embedded sections of HEK‐293T–derived xenografts. Representative images of sections, stained simultaneously with mouse‐specific centromeric probes (green) and human‐specific centromeric probes (red), were acquired at 40× magnification. Nuclei were stained with DAPI (blue). Scale bar = 150 μm. (b) Western blot of protein extracts prepared from xenografts derived from HEK293T cells transfected with the tet‐on PDC‐GFP‐V5/His construct. Animals were given either no doxycycline (–) or 10 mg/mL doxycycline in their drinking water for 96 h prior to preparation of the protein extract (+). (c) Representative formalin‐fixed stained sections taken from xenografts grown for ∼ 21–24 d following subcutaneous implantation of cells transfected with the tet‐on PDC‐GFP‐V5/His construct. Where indicated, the mice were given 10 mg/mL doxycycline solution in their drinking water for 96 h prior to xenograft excision. PDC expression was investigated by probing the sections with anti‐GFP and anti‐V5 antibodies. Scale bars = 150 µm. (d) GFP fluorescence overlaid on bright field images acquired from a single cohort of mice at 48 and 96 h after the beginning of doxycycline administration. Ten mg/mL of doxycycline was given in the drinking water where indicated. Images were acquired with an IVIS 200 camera and were analyzed with Living Image software (both from Perkin‐Elmer). The post‐doxycycline GFP fluorescence images are representative of experiments on five animals. The tumors were located on the backs of the animals immediately above the tail (see Supporting Information Section S6).
Figure 5
Figure 5
(a, b) Effect of induction of expression of wild‐type (a) and mutant PDC (b) on xenograft growth. The size of the xenografts derived from cells transfected with the tet‐on PDC or tet‐on H113Q constructs are expressed as the percentage of the volume measured at the beginning of doxycycline treatment (0 h). Caliper measurements of two xenograft diameters were made every 48 h from 21 d after implantation, when doxycycline was added to the drinking water as indicated. Euhus’ formula was used to calculate xenograft volume as described in the Methods section. Error bars represent one standard deviation of the mean. Only positive or negative error bars are shown for clarity. (c) Representative formalin‐fixed sections taken from xenografts grown for ∼21–24 d following subcutaneous implantation of cells transfected with the tet‐on PDC‐GFP‐V5/His construct. Where indicated, the mice were given 10 mg/mL doxycycline solution in their drinking water for 96 h prior to xenograft excision. The area of necrotic tissue was assessed via H&E staining, and apoptosis was investigated by probing with an anti‐CC3 antibody. Scale bars = 150 µm.
Figure 6
Figure 6
13C MRS detection of zmPDC activity in vivo following administration of hyperpolarized [1‐13C] pyruvate. (a) 13C spectra acquired from 8‐mm‐thick slices of xenografts ∼21 d after subcutaneous implantation HEK293T cells transfected with the PDC‐GFP‐V5/His construct. Experiments were performed either without doxycycline treatment (no doxycycline) or after 96 h of 10 mg/mL doxycycline solution administration (96 hours post doxycycline). A total of 10 μL/g body weight of a 75‐mM solution of hyperpolarized [1‐13C] pyruvate was injected over 2 s. A total of 128 single transient 13C spectra were acquired, starting 30 s from the injection (TR = 500 ms, nominal flip angle = 20°, SW = 6 kHz; delay from the middle of the excitation pulse to beginning of data acquisition was 900 µs). The insets show a 10× vertical scale expansion of the 162–168 ppm region of the resulting 13C spectra. Peak assignments: lactate (185 ppm), pyruvate hydrate (181 ppm), alanine (177 ppm), pyruvate (172.9 ppm), and bicarbonate (162.8 ppm). (b) Representative 1H‐decoupled spectra acquired from xenografts following injection of 10 μL/g body weight of 75 mM hyperpolarized [2‐13C] pyruvate. Spectra were acquired as described in panel a. Peak assignments: [2‐13C] pyruvate (207.4 ppm); the resonance at 205.6 ppm was tentatively assigned to [1‐13C] AcCoA.

References

    1. Lyons SK, Patrick PS, Brindle KM. Imaging mouse cancer models in vivo using reporter transgenes. Cold Spring Harb Protoc 2013:685–699. - PubMed
    1. Patrick PS, Hammersley J, Loizou L, et al. Dual‐modality gene reporter for in vivo imaging. Proc Natl Acad Sci U S A 2014;111:415–420. - PMC - PubMed
    1. Himmelreich U, Dresselaers T. Cell labeling and tracking for experimental models using magnetic resonance imaging. Methods 2009;48:112–124. - PubMed
    1. Deans AE, Wadghiri YZ, Bernas LM, Yu X, Rutt BK, Turnbull DH. Cellular MRI contrast via coexpression of transferrin receptor and ferritin. Magn Reson Med 2006;56:51–59. - PMC - PubMed
    1. Koretsky AP, Traxler BA. The B isozyme of creatine kinase is active as a fusion protein in Escherichia coli: in vivo detection by 31P NMR. FEBS Lett 1989;243:8–12. - PubMed

Publication types

MeSH terms