

Cytotoxic effects of oosporein isolated from endophytic fungus Cochliobolus kusanoi
- PMID: 26388840
- PMCID: PMC4556033
- DOI: 10.3389/fmicb.2015.00870
Cytotoxic effects of oosporein isolated from endophytic fungus Cochliobolus kusanoi
Abstract
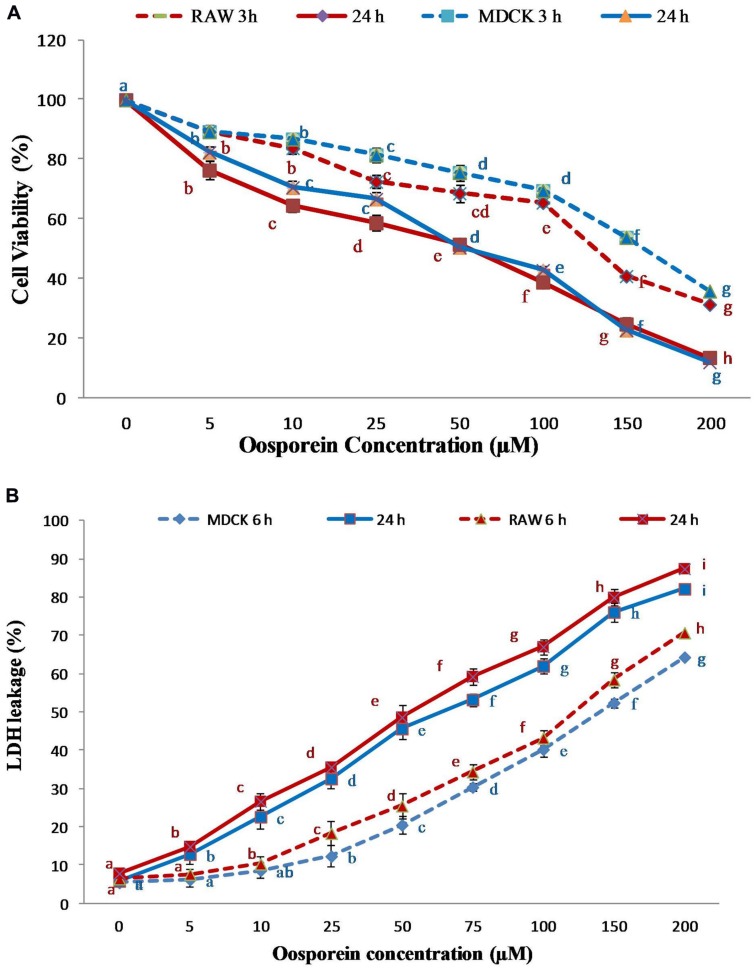
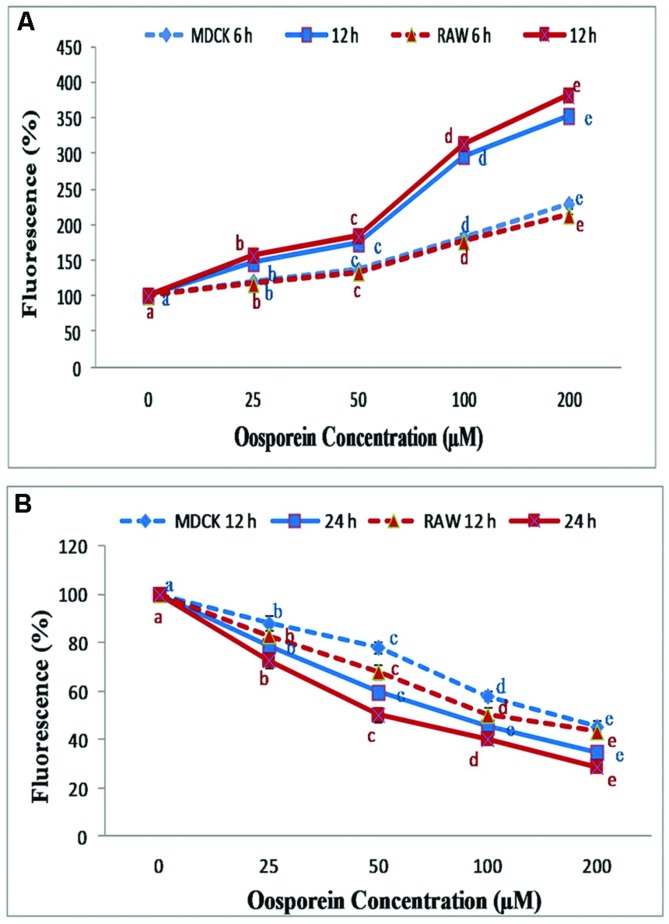
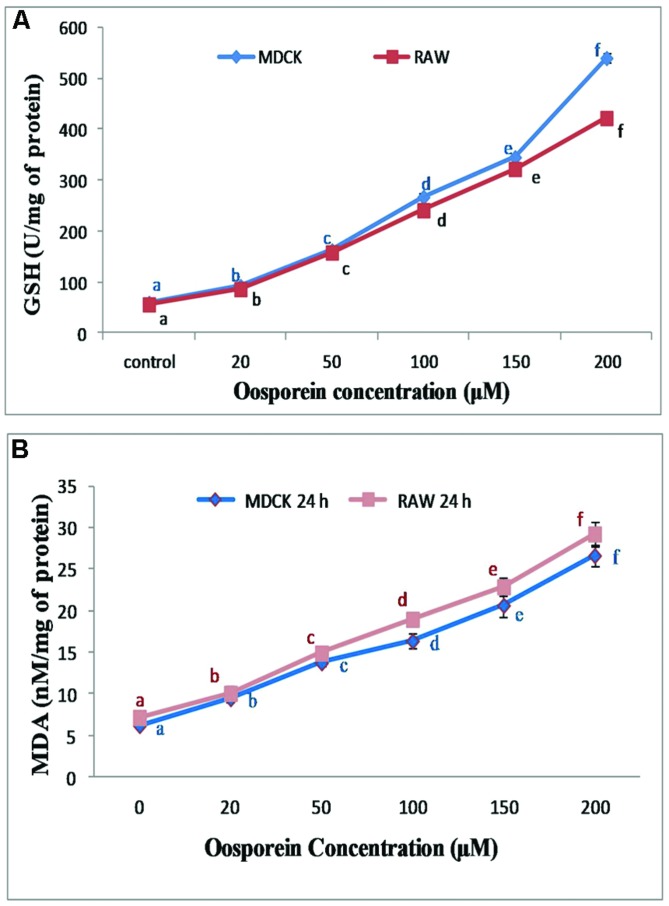
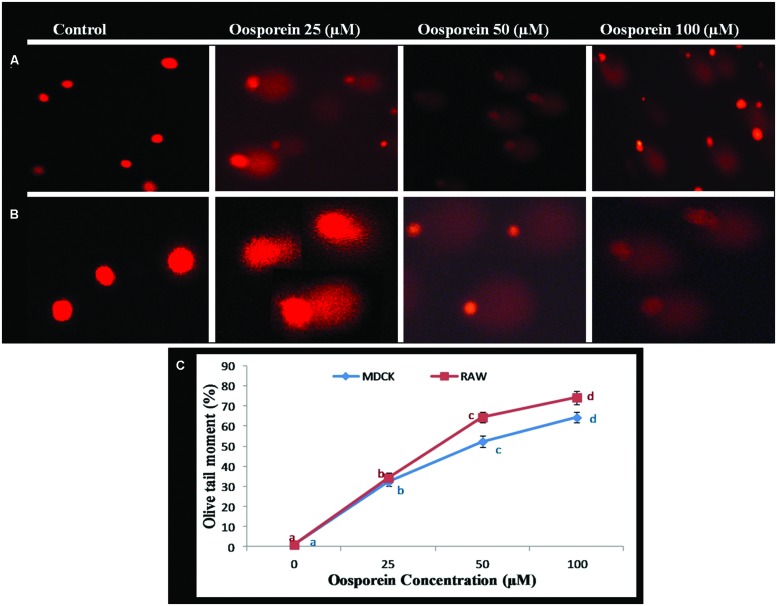
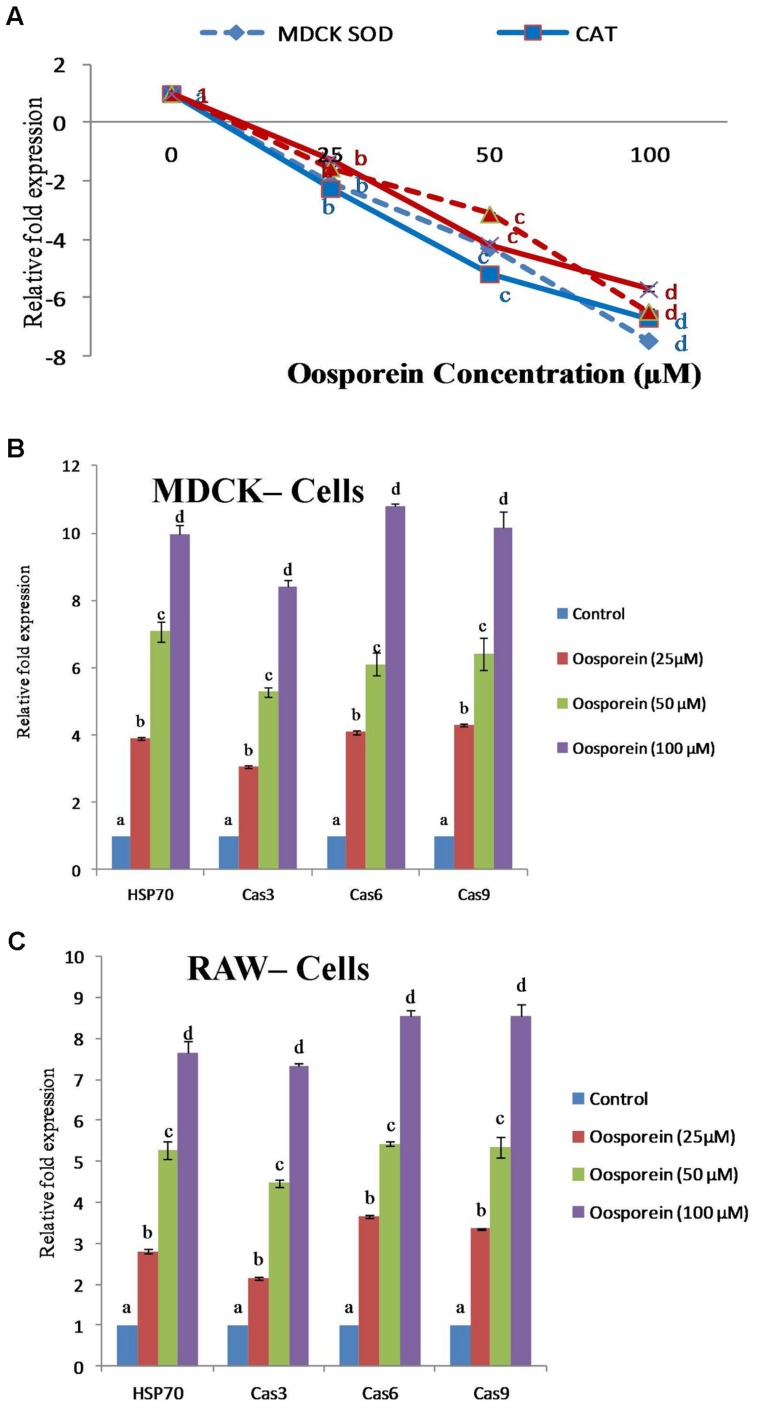
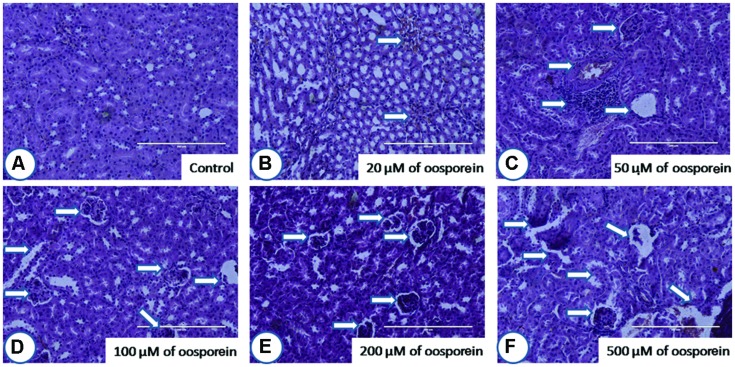
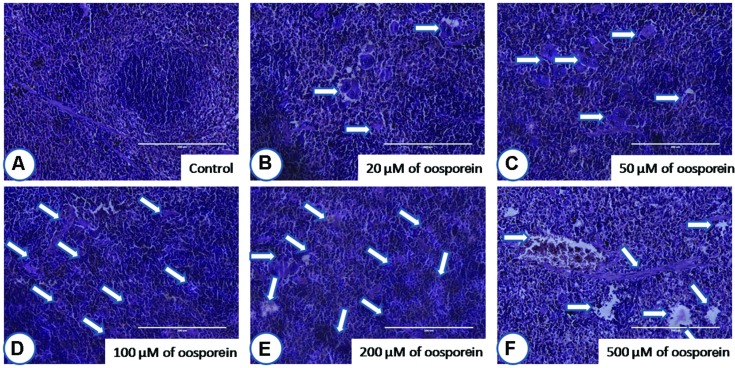
In the present study, oosporein, a fungal toxic secondary metabolite known to be a toxic agent causing chronic disorders in animals, was isolated from fungus Cochliobolus kusanoi of Nerium oleander L. Toxic effects of oosporein and the possible mechanisms of cytotoxicity as well as the role of oxidative stress in cytotoxicity to Madin-Darby canine kidney kidney cells and RAW 264.7 splene cells were evaluated in vitro. Also to know the possible in vivo toxic effects of oosporein on kidney and spleen, Balb/C mouse were treated with different concentrations of oosporein ranging from 20 to 200 μM). After 24 h of exposure histopathological observations were made to know the effects of oosporein on target organs. Oosporein induced elevated levels of reactive oxygen species (ROS) generation and high levels of malondialdehyde, loss of mitochondrial membrane potential, induced glutathione hydroxylase (GSH) production was observed in a dose depended manner. Effects oosporein on chromosomal DNA damage was assessed by Comet assay, and increase in DNA damage were observed in both the studied cell lines by increasing the oosporein concentration. Further, oosporein treatment to studied cell lines indicated significant suppression of oxidative stress related gene (Superoxide dismutase1 and Catalase ) expression, and increased levels of mRNA expression in apoptosis or oxidative stress inducing genes HSP70, Caspase3, Caspase6, and Caspase9 as measured by quantitative real time-PCR assay. Histopathological examination of oosporein treated mouse kidney and splenocytes further revealed that, oosporein treated target mouse tissues were significantly damaged with that of untreated sam control mice and these effects were in directly proportional to the the toxin dose. Results of the present study reveals that, ROS is the principle event prompting increased oosporein toxicity in studied in vivio and in vitro animal models. The high previlance of these fungi in temperate climates further warrants the need of safe food grain storage and processing practices to control the toxic effects of oosporein to humans and live stock.
Keywords: ROS; oosporein; oxidative stress; realtime-Q-PCR; toxicity.
Figures
Similar articles
-
Characterisation and bioactivity of oosporein produced by endophytic fungus Cochliobolus kusanoi isolated from Nerium oleander L.Nat Prod Res. 2014;28(23):2217-20. doi: 10.1080/14786419.2014.924933. Epub 2014 Jun 17. Nat Prod Res. 2014. PMID: 24934634
-
Cytotoxic Effects of Ochratoxin A in Neuro-2a Cells: Role of Oxidative Stress Evidenced by N-acetylcysteine.Front Microbiol. 2016 Aug 2;7:1142. doi: 10.3389/fmicb.2016.01142. eCollection 2016. Front Microbiol. 2016. PMID: 27531992 Free PMC article.
-
Oosporein, an abundant metabolite in Beauveria caledonica, with a feedback induction mechanism and a role in insect virulence.Fungal Biol. 2019 Aug;123(8):601-610. doi: 10.1016/j.funbio.2019.01.004. Epub 2019 Jan 28. Fungal Biol. 2019. PMID: 31345414
-
Regulatory cascade and biological activity of Beauveria bassiana oosporein that limits bacterial growth after host death.Proc Natl Acad Sci U S A. 2017 Feb 28;114(9):E1578-E1586. doi: 10.1073/pnas.1616543114. Epub 2017 Feb 13. Proc Natl Acad Sci U S A. 2017. PMID: 28193896 Free PMC article.
-
Mechanisms of toxic cardiomyopathy.Clin Toxicol (Phila). 2019 Jan;57(1):1-9. doi: 10.1080/15563650.2018.1497172. Epub 2018 Sep 27. Clin Toxicol (Phila). 2019. PMID: 30260248 Review.
Cited by
-
Tripodalsporormielones A-C, unprecedented cage-like polyketides with complex polyvdent bridged and fused ring systems.Acta Pharm Sin B. 2021 Nov;11(11):3648-3654. doi: 10.1016/j.apsb.2021.05.001. Epub 2021 May 7. Acta Pharm Sin B. 2021. PMID: 34900543 Free PMC article.
-
The secondary metabolites from Beauveria bassiana PQ2 inhibit the growth and spore germination of Gibberella moniliformis LIA.Braz J Microbiol. 2022 Mar;53(1):143-152. doi: 10.1007/s42770-021-00668-z. Epub 2022 Jan 21. Braz J Microbiol. 2022. PMID: 35060091 Free PMC article.
-
Endophytic Fungi-Alternative Sources of Cytotoxic Compounds: A Review.Front Pharmacol. 2018 Apr 26;9:309. doi: 10.3389/fphar.2018.00309. eCollection 2018. Front Pharmacol. 2018. PMID: 29755344 Free PMC article. Review.
-
In Vitro and In Silico Antioxidant Efficiency of Bio-Potent Secondary Metabolites From Different Taxa of Black Seed-Producing Plants and Their Derived Mycoendophytes.Front Bioeng Biotechnol. 2022 Jul 19;10:930161. doi: 10.3389/fbioe.2022.930161. eCollection 2022. Front Bioeng Biotechnol. 2022. PMID: 35928959 Free PMC article.
-
Discovery of Spirosnuolides A-D, Type I/III Hybrid Polyketide Spiro-Macrolides for a Chemotherapeutic Lead against Lung Cancer.JACS Au. 2024 Dec 10;4(12):4821-4832. doi: 10.1021/jacsau.4c00803. eCollection 2024 Dec 23. JACS Au. 2024. PMID: 39735922 Free PMC article.
References
-
- Abendstein D., Strasser H. (2000). “Consideration on toxic metabolites produced by Beauveria brongniartii,” in Integrated Control of Soil Pests Subgroup “Melolontha”, ed. Kelley S. (Dijon: IOBC/WRP Bulletin; ), 99–105.
LinkOut - more resources
Full Text Sources
Other Literature Sources