. 2015 Sep 1:6:896.
doi: 10.3389/fmicb.2015.00896. eCollection 2015.

Strand-specific community RNA-seq reveals prevalent and dynamic antisense transcription in human gut microbiota

Affiliations

Strand-specific community RNA-seq reveals prevalent and dynamic antisense transcription in human gut microbiota

Guanhui Bao et al. Front Microbiol. .

Abstract

Metagenomics and other meta-omics approaches (including metatranscriptomics) provide insights into the composition and function of microbial communities living in different environments or animal hosts. Metatranscriptomics research provides an unprecedented opportunity to examine gene regulation for many microbial species simultaneously, and more importantly, for the majority that are unculturable microbial species, in their natural environments (or hosts). Current analyses of metatranscriptomic datasets focus on the detection of gene expression levels and the study of the relationship between changes of gene expression and changes of environment. As a demonstration of utilizing metatranscriptomics beyond these common analyses, we developed a computational and statistical procedure to analyze the antisense transcripts in strand-specific metatranscriptomic datasets. Antisense RNAs encoded on the DNA strand opposite a gene's CDS have the potential to form extensive base-pairing interactions with the corresponding sense RNA, and can have important regulatory functions. Most studies of antisense RNAs in bacteria are rather recent, are mostly based on transcriptome analysis, and have been applied mainly to single bacterial species. Application of our approaches to human gut-associated metatranscriptomic datasets allowed us to survey antisense transcription for a large number of bacterial species associated with human beings. The ratio of protein coding genes with antisense transcription ranges from 0 to 35.8% (median = 10.0%) among 47 species. Our results show that antisense transcription is dynamic, varying between human individuals. Functional enrichment analysis revealed a preference of certain gene functions for antisense transcription, and transposase genes are among the most prominent ones (but we also observed antisense transcription in bacterial house-keeping genes).

Keywords: antisense RNA; human gut microbiota; metagenome; metatranscriptome; transposases.


Figures

FIGURE 1
FIGURE 1
Impacts of different experimental protocols on the profiling of antisense transcription. The figure shows the correlation (and differences) between the profile of antisense transcription (i.e., ratios of genes with antisense transcription in different species across individuals) for frozen samples and the profile of antisense transcription for ethanol-fixed samples (Pearson’s r = 0.71; two tailed p-value < 2.2e-16). In this plot, the ratios of genes with antisense transcription for the different species based on the frozen samples (Frozen) and ethanol-fixed samples (ETOH) are plotted in the x-axis and y-axis, respectively.
FIGURE 2
FIGURE 2
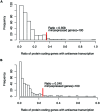
Histograms of the ratios of genes with antisense transcription (over all genes with detectable transcription). Binomial tests were used to determine if a gene has antisense transcription or not, with a success rate of 1% (A), and 5% (B), respectively. The red vertical lines indicate the maximum ratios of genes with antisense transcription, for the genomes in which at least 100 genes have detectable transcription (with RNA-seq reads support).
FIGURE 3
FIGURE 3
Boxplot of the ratios of antisense reads (left). The plots on the right show the contribution of individual genes to the total antisense reads for the two outliers B. adolescentis and B. fragilis. Most of the antisense reads came from three and one genes (likely misannotations) for B. adolescentis and B. fragilis, respectively.
FIGURE 4
FIGURE 4
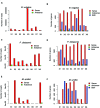
Example species with antisense transcription in different individuals. Three species are shown: Bacteroides vulgatus ATCC 8482 (A,B), Parabacteroides distasonis ATCC 8503 (C,D) and Methanobrevibacter smithii ATCC 35061 (E,F). (A,C,E) Shows the numbers of sense and antisense reads in these three species, and (B,D,F) show the number of genes with sense transcription only (Sense), antisense transcription only (Antisense), and both (Both). X1–X8 indicate the eight individuals.
FIGURE 5
FIGURE 5
Read coverage plots for example genes in B. vulgatus. Genes are represented as arrows in the plots, and the read coverage curves are shown below the genes, with the coverage for sense and antisense reads shown in blue and purple, respectively. (A) Read coverage plot for an operon with four genes, shown as cyan arrows on the top: BVU_0219 is a putative aldo/keto reductase, BVU_0220 is a hypothetical protein, BVU_0221 is a putative fucose permease, and BVU_0222 is a putative sorbitol dehydrogenase. (B) Read coverage plot for BVU_3334 (and its neighboring genes): BVU_3334 is a putative transcriptional regulator, BVU_3333 is similar to a fructose-6-phosphate aldolase from E. coli, BVU_3332 is a putative ABC transporter permease, BVU_3335 is a hypotentical protein, and BVU_3336 is a putative glycosyl transferase.
FIGURE 6
FIGURE 6
Different Streptococcus species have different levels of antisense transcripts. The y-axis shows the ratio of genes with antisense transcription. The x-axis shows the different species; sang: S. anginosus C1051, sanc: S. anginosus C238, sif: S. infantarius CJ18, smut: S. mutans GS5, smj: S. mutans LJ23, smc: S. mutans NN2025, smu: S. mutans UA159, scp: S. parasanguinis ATCC 15912, scf: S. parasanguinis FW213, stf: S. salivarius 57 I, ssr: S. salivarius CCHSS3, stj: S. salivarius JIM8777, ssa: S. sanguinis SK36, stc: S. thermophilus CNRZ1066, stu: S. thermophilus JIM 8232, ste: S. thermophilus LMD 9, stl: S. thermophilus LMG 18311, stw: S. thermophilus MN ZLW 002, stn: S. thermophilus ND03. The boxplots for the different strains of the same species are shown in the same color.
FIGURE 7
FIGURE 7
Highly expressed genes tend to be dominated by sense transcription or antisense transcription. Each circle represents a gene. The y-axis shows the gene expression (log(FPKM)) and the x-axis shows d, which is close to 1 for genes with mostly sense transcription, and -1 with mostly antisense transcription. RNA-seq data from individual 1 (X310763260) was used for this plot. To limit the bias that may be introduced by rare species or genes with low expression levels, we only included the genes (3,689 in total) each supported by at least 20 RNA-seq reads, and are from the species (23 in total) each having at least 100 genes with RNA-seq reads support. See Supplementary Figure S2 for the plot using the original gene expression data, involving 30,493 genes from all 47 strains, one for each species.
FIGURE 8
FIGURE 8
Sharing of genes with antisense transcription among human individuals. Genes associated with Streptococcus anginosus C238 (A), Bacteroides vulgatus ATCC 8482 (B) and Parabacteroides distasonis ATCC 8503 (C) tend to be unique to different individuals, while genes associated with Methanobrevibacter smithii ATCC 35061 tend to be shared by individuals (D). The numbers below the bars indicate the number of individuals sharing the genes with antisense transcription, with 1 indicating the number of genes unique to one individual, and 2–8 for genes shared by two individuals, and then increasing numbers of individuals.
FIGURE 9
FIGURE 9
COG functional categories enriched in genes with antisense transcription. The functional categories include E: Amino acid transport and metabolism; H: Coenzyme transport and metabolism; K: Transcription; L: Replication, recombination and repair; P: Inorganic ion transport and metabolism; R: General function prediction only; V: Defense mechanisms; and X: Mobilome, prophages, transposons.

References

    1. Beaume M., Hernandez D., Farinelli L., Deluen C., Linder P., Gaspin C., et al. (2010). Cartography of methicillin-resistant S. aureus transcripts: detection, orientation and temporal expression during growth phase and stress conditions. PLoS ONE 5:e10725 10.1371/journal.pone.0010725 - DOI - PMC - PubMed
    1. Behrens S., Widder S., Mannala G. K., Qing X. X., Madhugiri R., Kefer N., et al. (2014). Ultra deep sequencing of Listeria monocytogenes sRNA transcriptome revealed new antisense RNAs. PLoS ONE 9:e83979 10.1371/journal.pone.0083979 - DOI - PMC - PubMed
    1. Beiter T., Reich E., Williams R. W., Simon P. (2009). Antisense transcription: a critical look in both directions. Cell. Mol. Life Sci. 66 94–112. 10.1007/s00018-008-8381-y - DOI - PMC - PubMed
    1. Berretta J., Morillon A. (2009). Pervasive transcription constitutes a new level of eukaryotic genome regulation. EMBO Rep. 10 973–982. 10.1038/embor.2009.181 - DOI - PMC - PubMed
    1. Bolger A. M., Lohse M., Usadel B. (2014). Trimmomatic: a flexible trimmer for Illumina sequence data. Bioinformatics 30 2114–2120. 10.1093/bioinformatics/btu170 - DOI - PMC - PubMed

LinkOut - more resources