. 2015 Sep 17:8:35.
doi: 10.1186/s13072-015-0027-3. eCollection 2015.

Tissue-specific expression of histone H3 variants diversified after species separation

Affiliations

Tissue-specific expression of histone H3 variants diversified after species separation

Kazumitsu Maehara et al. Epigenetics Chromatin. .

Abstract

Background: The selective incorporation of appropriate histone variants into chromatin is critical for the regulation of genome function. Although many histone variants have been identified, a complete list has not been compiled.

Results: We screened mouse, rat and human genomes by in silico hybridization using canonical histone sequences. In the mouse genome, we identified 14 uncharacterized H3 genes, among which 13 are similar to H3.3 and do not have human or rat counterparts, and one is similar to human testis-specific H3 variant, H3T/H3.4, and had a rat paralog. Although some of these genes were previously annotated as pseudogenes, their tissue-specific expression was confirmed by sequencing the 3'-UTR regions of the transcripts. Certain new variants were also detected at the protein level by mass spectrometry. When expressed as GFP-tagged versions in mouse C2C12 cells, some variants were stably incorporated into chromatin and the genome-wide distributions of most variants were similar to that of H3.3. Moreover, forced expression of H3 variants in chromatin resulted in alternate gene expression patterns after cell differentiation.

Conclusions: We comprehensively identified and characterized novel mouse H3 variant genes that encoded highly conserved amino acid sequences compared to known histone H3. We speculated that the diversity of H3 variants acquired after species separation played a role in regulating tissue-specific gene expression in individual species. Their biological relevance and evolutionary aspect involving pseudogene diversification will be addressed by further functional analysis.


Figures
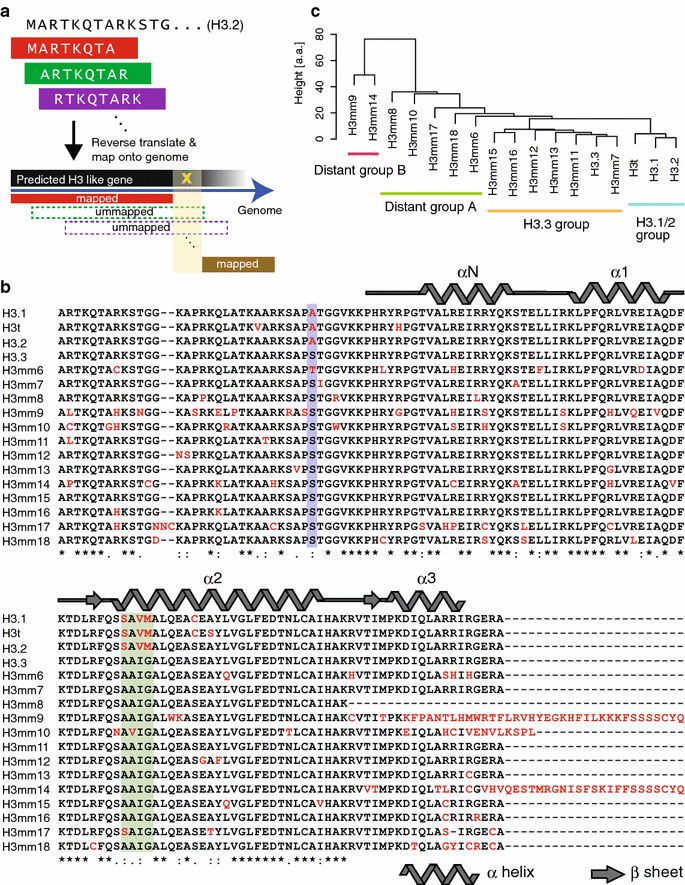
Fig. 1
Fig. 1
Identification of novel mouse H3 variants. a Schematic drawing of the H3 variant gene screening by in silico hybridization. We first split known H3 (H3.2) amino acid sequences into short fragments of eight amino acids and listed all possible combinations of fragments with respect to the codon table. Next, DNA sequences were mapped onto the mouse genome. Adjacently mapped sequences (<90 bp) were concatenated, and the concatenated regions were considered H3 variant coding genes. b Protein sequences of novel H3 variants. The protein sequences were translated from predicted H3 variant genes. Characteristic amino acids are in red type. The blue highlighted region indicates position 31 and the green highlighted region indicates amino acids at the N-terminal tail and the motif that discriminate H3.1 and H3.3. c Clusters of similar mouse H3 variant proteins. The cluster dendrogram was constructed by hierarchical clustering of H3 variant amino acid sequences. The edit distance (Levenshtein distance) was used as a similarity measure. Height (y-axis) indicates the edit distance between cluster pairs. Clusters containing H3.1 or H3.3 were defined as H3.1 and H3.3 groups, respectively. Other clusters distant from the H3.3 sequence were defined as distant groups A or B
Fig. 2
Fig. 2
H3 variant genes are expressed in mouse tissues. a Representative IGV screenshots of 3′-seq data of the four tissues. The mRNA sequences mapped in four tissues (brain, liver, skeletal muscle and testis) are shown in four lanes at each locus of the H3 variants. The black thick bars indicate exons, and black thin bars indicate the predicted 3′-UTR of each H3 variant gene. The predicted lengths of the 3′-UTRs are shown below the genes. Piled-up depths are shown as (min–max) to the left of each lane. b The gene expression levels of novel H3 variants in four tissues. The expression levels of H3 variants (log10 RPM) are indicated by the color bar to the right. Tiles marked with white asterisks confirm H3 variant expression (RPM > 0) in the replicated data. c Identified peptides and their positions in histone sequences. LC–MS/MS analysis was performed using acid extracts from adult male mouse tissues (8 week old), as shown in Additional file 2: Figure S8A. Red letters mark amino acids specific to H3t and H3mm7. Red underline indicates unique peptide sequences. Green, yellow and light blue indicate peptides in the peptide sequence with high confidence, medium confidence and low confidence, respectively
Fig. 3
Fig. 3
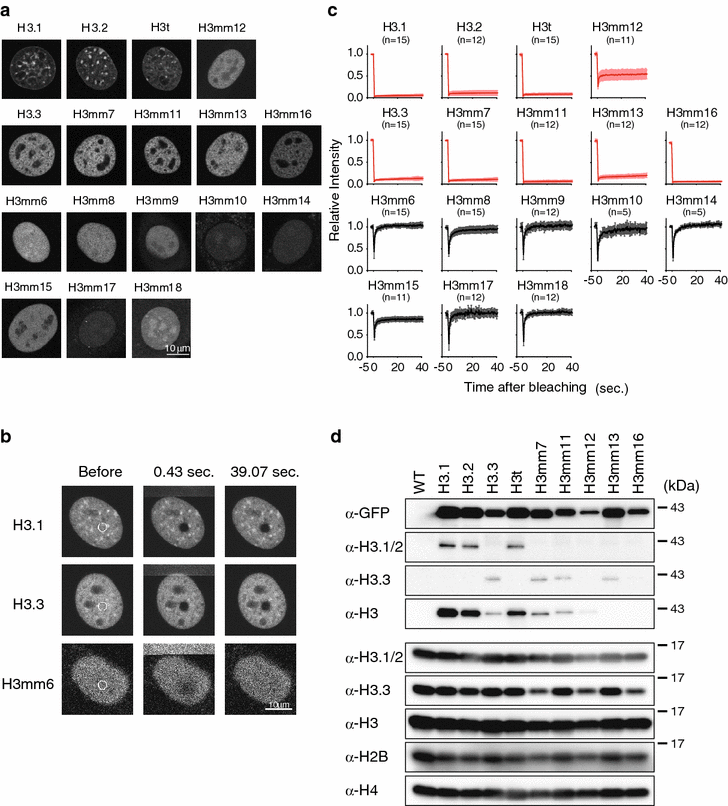
Six of 14 novel H3 variants incorporate into chromatin. a Images of GFP-tagged histone H3 variants show localizations in nuclei that were categorized into three groups. Variant expression was induced by tetracycline. Scale bar 10 μm. b Fluorescence recovery after photobleaching experiments to evaluate the nucleosomal stability of H3 variants. The areas marked with white circles were photobleached, and the recovery of the respective fluorescent signals was monitored (selected time points are shown). c GFP-tagged histone H3 variants were categorized into two groups: those that were stably incorporated into nuclei and those that were not. The mobility of the GFP-fused histone H3 variants was analyzed based on fluorescence recovery after photobleaching. Recovery curves of GFP-fused histone H3 variants are shown. Relative fluorescence intensities are mean ± standard deviation (n represents the number of trials). The rate of fluorescence recovery indicates the stability of the chromatin incorporation. Red lines show stable incorporation for GFP-H3.1, H3.2, H3.3, H3t, H3mm7, H3mm11, H3mm12, H3mm13 and H3mm16. Black lines show diffusion in the nucleus for GFP-H3mm6, H3mm8, H3mm9, H3mm10, H3mm14, H3mm15, and H3mm18. Scale bars 10 μm. d Exogenously expressed GFP-tagged histone H3 variants did not interfere with the endogenous expression of core histones. Immunoblots were performed using acid extract from GFP-tagged histone H3 variant-expressing C2C12 cells in the undifferentiated state. The top four panels show exogenously expressed GFP-tagged histone H3 variants; the lower five panels show the endogenous level of each core histone. Wild-type C2C12 cells (WT) were used as a control (no expression of GFP-tagged histones)
Fig. 4
Fig. 4
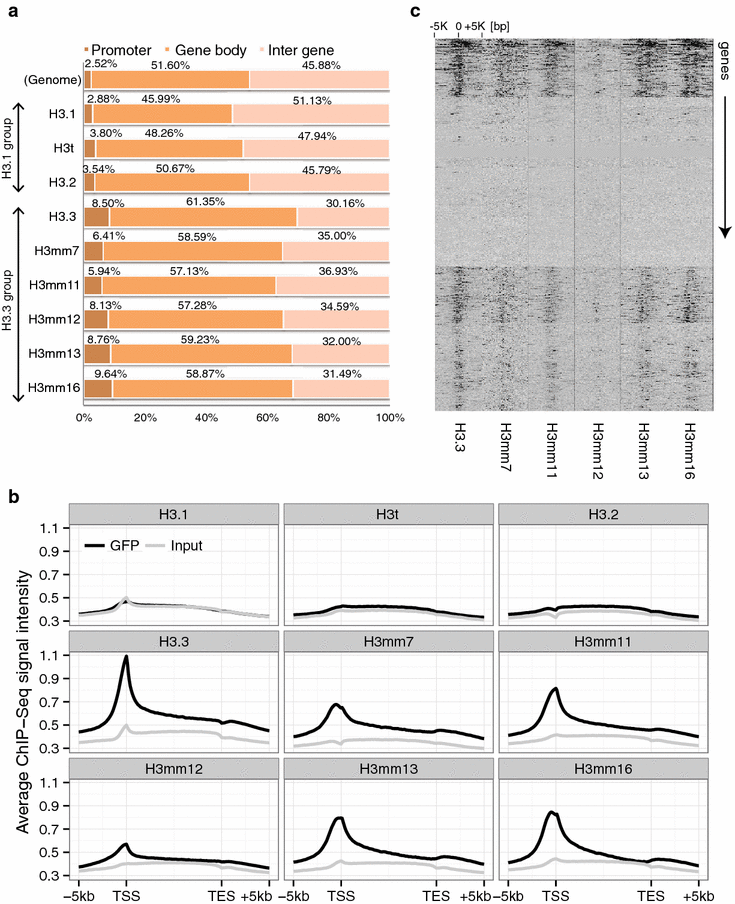
Genome-wide distributions of novel H3 variants are classified into H3.1-like or H3.3-like patterns. a Proportion of each incorporated H3 variant localized in three gene regions (promoter, gene body or inter-gene). The proportions were calculated from the ratio of ChIP-Seq peaks detected in the categories. The top lane (Genome) indicates the proportion (%) of each category with random (uniform) distribution on the genome to enable comparison. The other lanes are proportions of detected peaks for the H3.1 and H3.3 groups. b The distribution of H3 variants focused on gene loci. Data for the H3.1-type variant is shown as a control. The x-axis shows the relative coordinate of the gene from the TSS to the TES (transcription end site). The y-axis shows the average ChIP-Seq and the input signal intensity over all mouse genes. c Distribution of H3.3-type variants around the TSSs of all genes. The order of genes (rows) was determined by hierarchical clustering using total log2FCs within 5 kb from the TSSs. Higher fold-change (FC) is indicated by thicker black shading
Fig. 5
Fig. 5
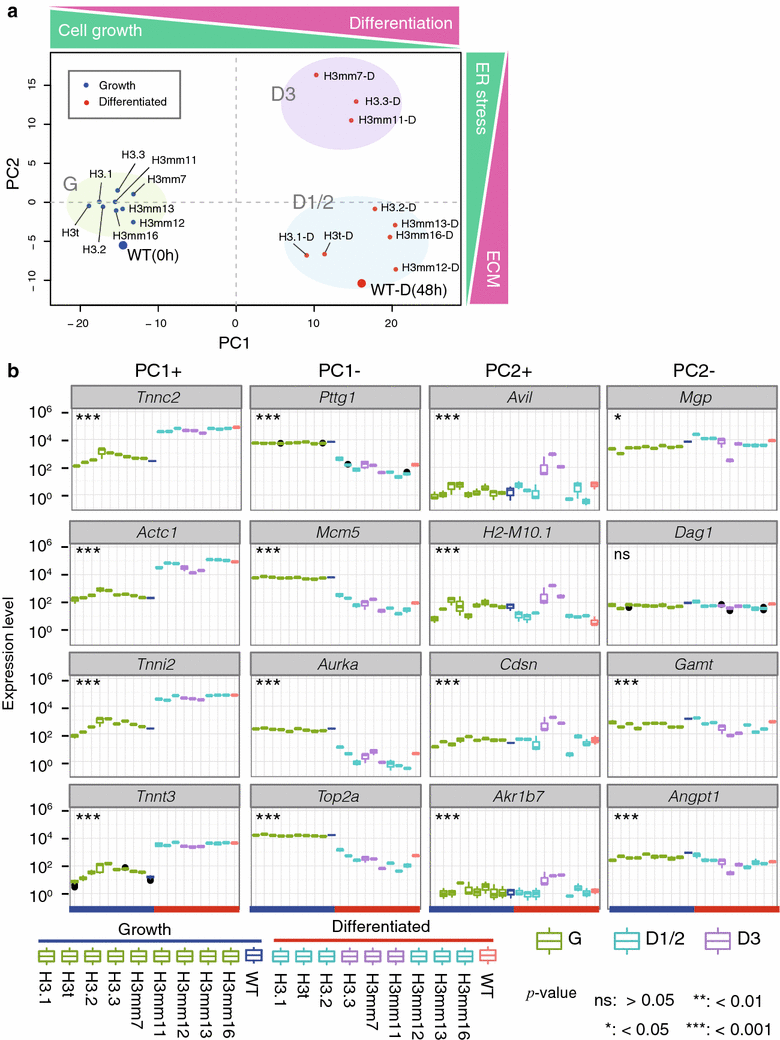
Histone variants correlate with two differentiation states. a Principal component analysis of gene expression patterns in H3 variant-overexpressing C2C12 cell differentiation. The x- and y-axes indicate the PC1 and PC2 scores, respectively, of the gene expression profiles in each cell. Blue points indicate the growth state; red points indicate the differentiated state. The distance between two points reflects the dissimilarity in gene expression patterns between cells. The higher PC1 score (PC1+) indicates a higher expression of muscle differentiation-related genes and lower expression of cell growth-related genes, as illustrated in the top bar. Similarly, higher PC2 scores (PC2+) indicate higher expression of ER-stress-related genes and lower expression of extracellular matrix (ECM)-related genes. Clusters of cells that have similar gene expression patterns, G (green), D1/2 (blue) and D3 (purple), are highlighted. b Gene expression levels of each H3 variant confirmed by RT-PCR amplicon-Seq. Expression levels of representative genes chosen from the top four contributors (genes) for each PC direction (PC1± and PC2±) are shown as boxplots calculated from three replicates. The illustration below shows the order of each H3 variant-expressing cell line in the growth and differentiated state. The color of each box corresponds to the expression groups shown in a: blue, undifferentiated wild-type (WT); red, differentiated WT; green, growth (G); blue, D1/2; and purple, D3. Two-sided Student’s t test was performed on group-average expression levels between “WT” vs. “Differentiated” for PC1± genes, and between “D1/2” vs. “D3” groups for PC2± genes

References

    1. Wang ZF, Krasikov T, Frey MR, Wang J, Matera AG, Marzluff WF. Characterization of the mouse histone gene cluster on chromosome 13: 45 histone genes in three patches spread over 1Mb. Genome Res. 1996;6(8):688–701. doi: 10.1101/gr.6.8.688. - DOI - PubMed
    1. Brush D, Dodgson JB, Choi OR, Stevens PW, Engel JD. Replacement variant histone genes contain intervening sequences. Mol Cell Biol. 1985;5(6):1307–1317. - PMC - PubMed
    1. Ng RK, Gurdon JB. Epigenetic memory of an active gene state depends on histone H3.3 incorporation into chromatin in the absence of transcription. Nat Cell Biol. 2008;10(1):102–9. doi: 10.1038/ncb1674. - DOI - PubMed
    1. Harada A, Okada S, Konno D, Odawara J, Yoshimi T, Yoshimura S, et al. Chd2 interacts with H3.3 to determine myogenic cell fate. EMBO J. 2012;31(13):2994–3007. doi: 10.1038/emboj.2012.136. - DOI - PMC - PubMed
    1. Loyola A, Almouzni G. Marking histone H3 variants: how, when and why? Trends Biochem Sci. 2007;32(9):425–433. doi: 10.1016/j.tibs.2007.08.004. - DOI - PubMed