. 2015 Oct 1;125(10):3981-91.
doi: 10.1172/JCI82416. Epub 2015 Sep 21.

Isolation of neoantigen-specific T cells from tumor and peripheral lymphocytes

Isolation of neoantigen-specific T cells from tumor and peripheral lymphocytes

Cyrille J Cohen et al. J Clin Invest. .

Abstract

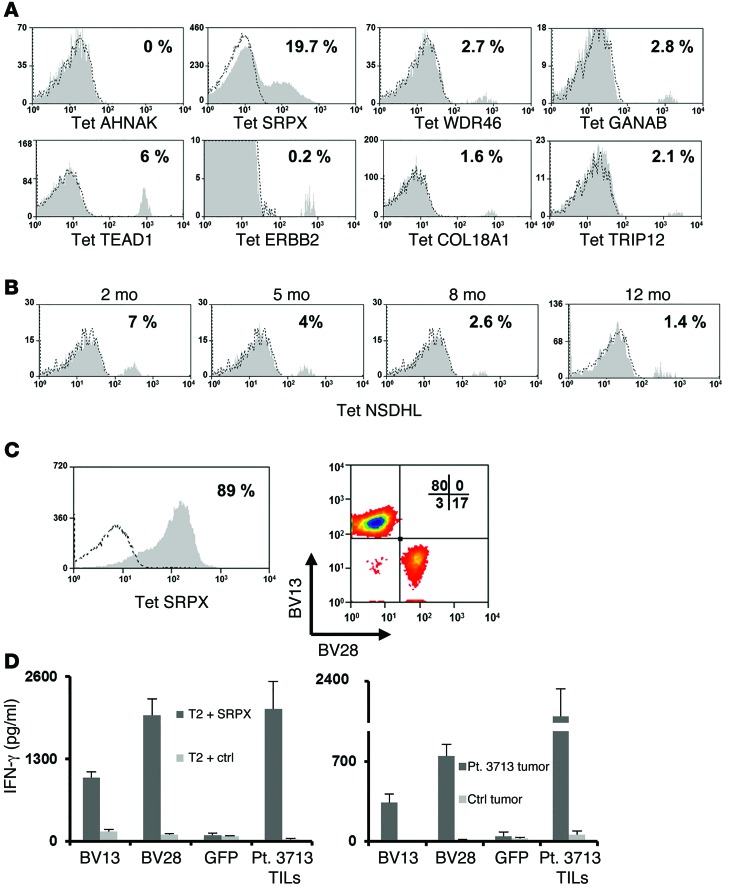
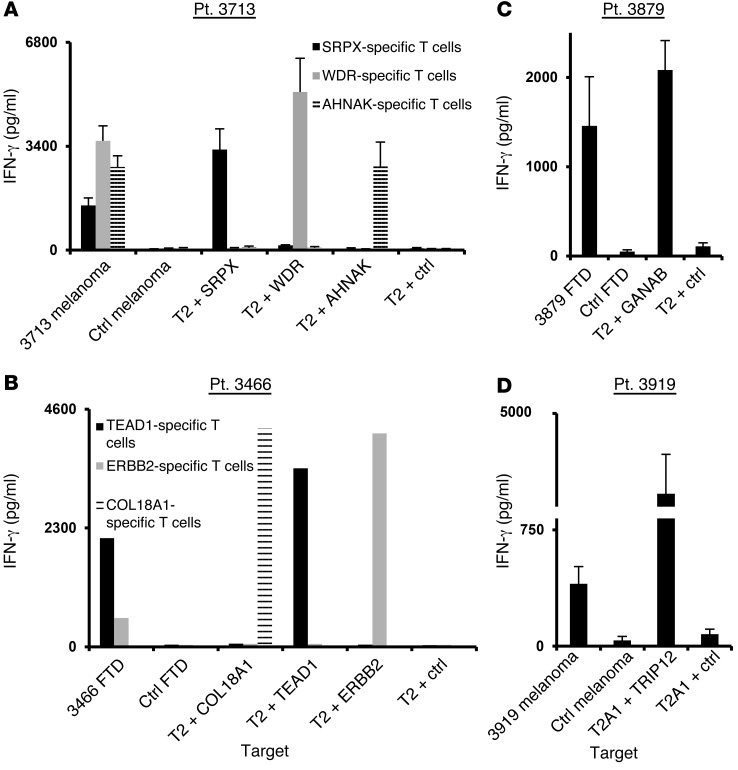
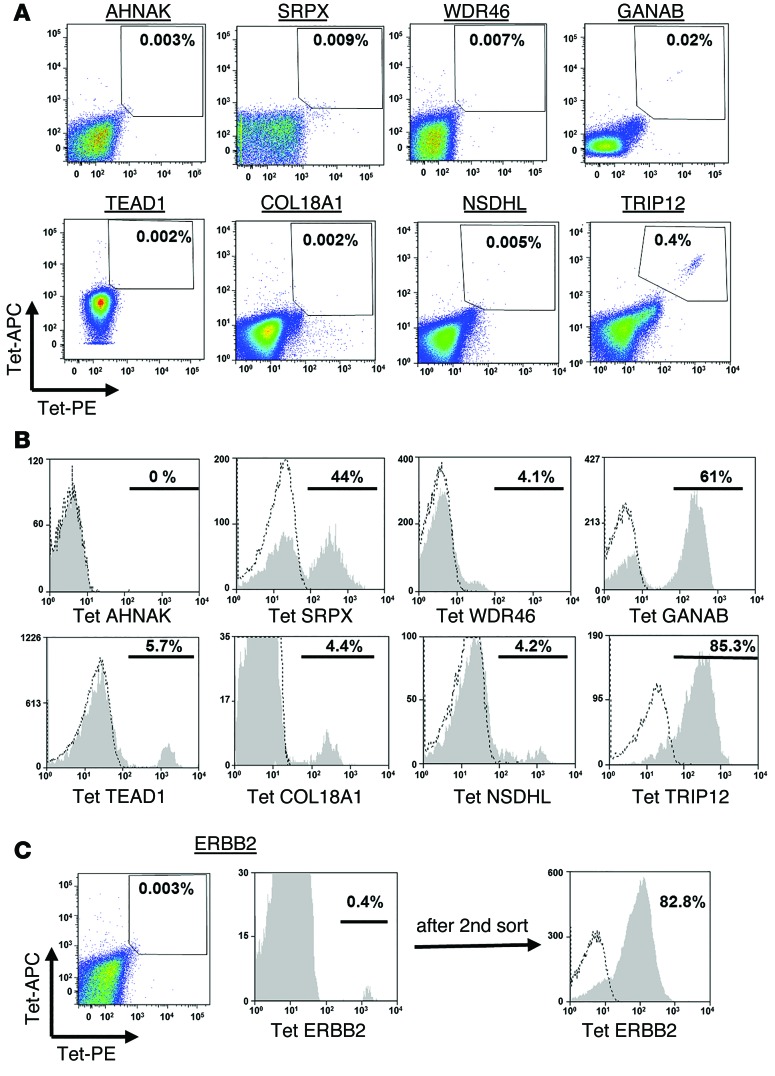
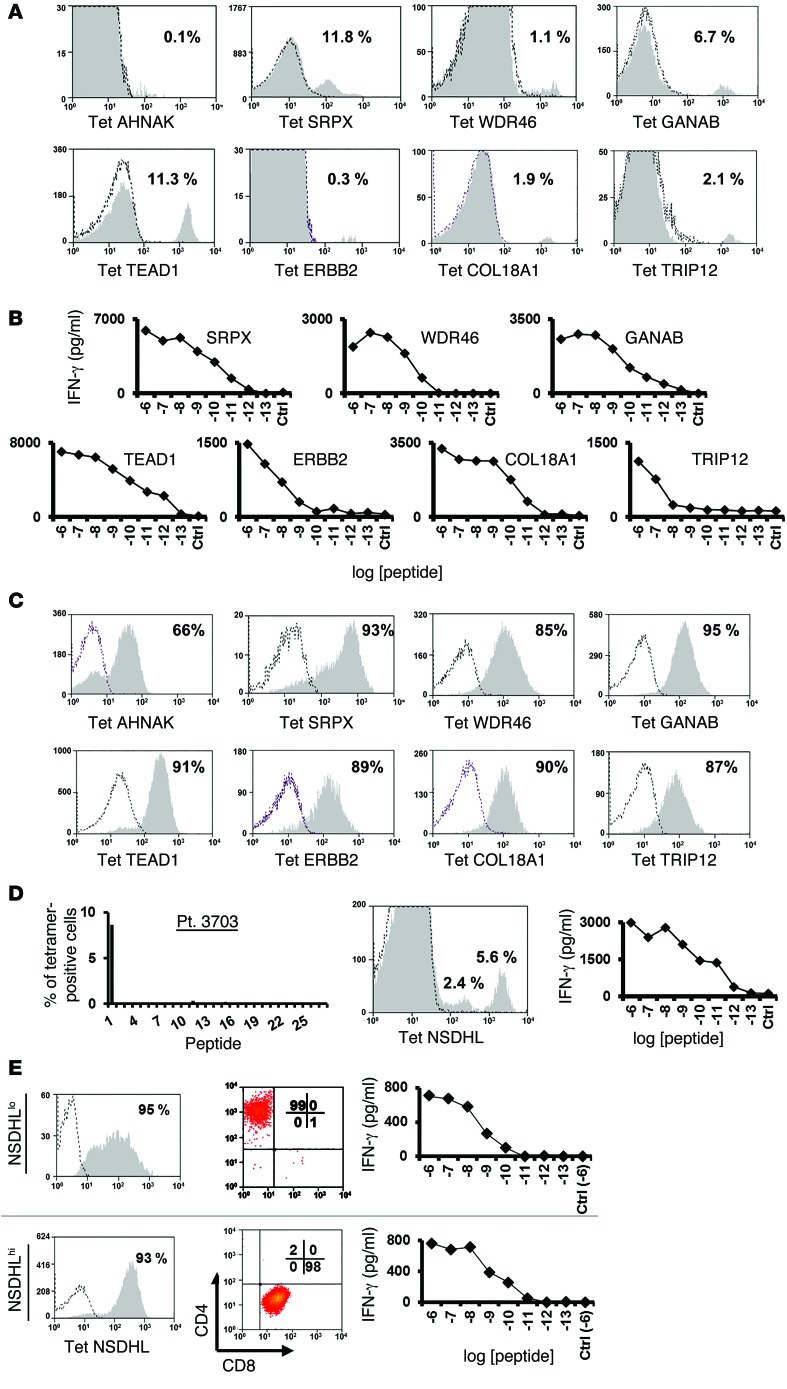
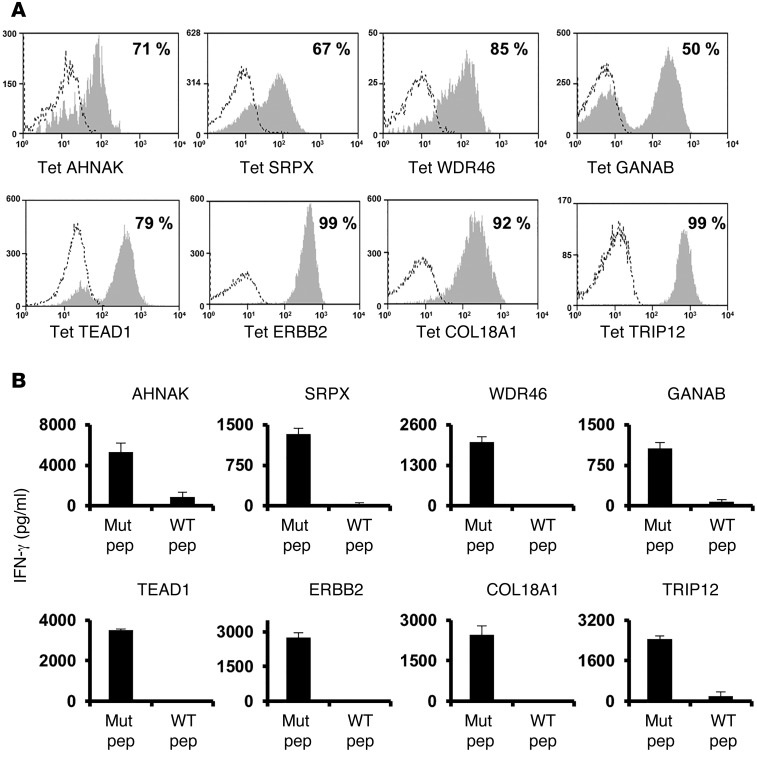
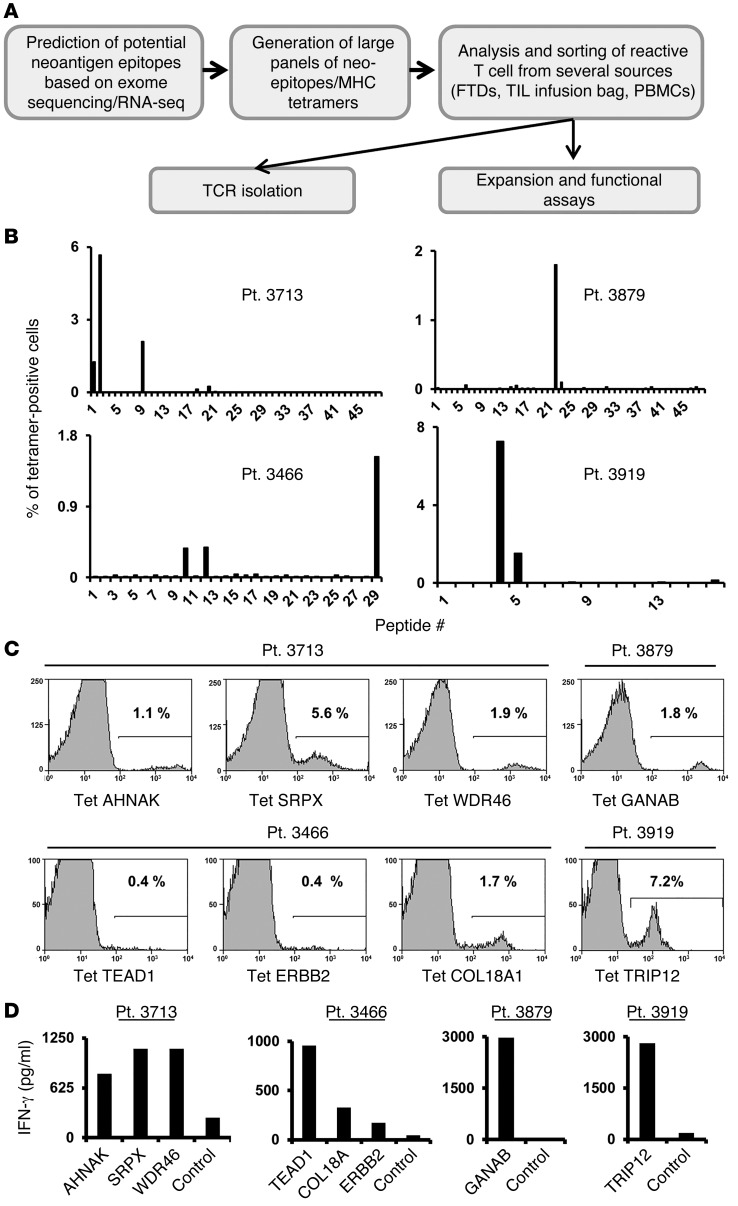
Adoptively transferred tumor-infiltrating T lymphocytes (TILs) that mediate complete regression of metastatic melanoma have been shown to recognize mutated epitopes expressed by autologous tumors. Here, in an attempt to develop a strategy for facilitating the isolation, expansion, and study of mutated antigen-specific T cells, we performed whole-exome sequencing on matched tumor and normal DNA isolated from 8 patients with metastatic melanoma. Candidate mutated epitopes were identified using a peptide-MHC-binding algorithm, and these epitopes were synthesized and used to generate panels of MHC tetramers that were evaluated for binding to tumor digests and cultured TILs used for the treatment of patients. This strategy resulted in the identification of 9 mutated epitopes from 5 of the 8 patients tested. Cells reactive with 8 of the 9 epitopes could be isolated from autologous peripheral blood, where they were detected at frequencies that were estimated to range between 0.4% and 0.002%. To the best of our knowledge, this represents the first demonstration of the successful isolation of mutation-reactive T cells from patients' peripheral blood prior to immune therapy, potentially providing the basis for designing personalized immunotherapies to treat patients with advanced cancer.


Figures

Figure 6
Figure 6. Persistence of and TCR isolation from T cells specific for mutated antigens.
(A) Cells obtained from pheresis in patients 2–3 months following adoptive TIL transfer were stained with the indicated MHC tetramer and analyzed for binding. The percentage of tetramer-positive cells among the gated lymphocyte population is indicated. (B) Similarly, pheresis samples from patient 3703 obtained 2, 5, 8, and 12 months following treatment were analyzed for NSDHL tetramer binding. The percentage of positive T cells among the gated lymphocytes is indicated. (C) Sorted T cells specific for mutated SRPX (left panel) were assessed for TCR BV13 and BV28 expression (right panel). (D) The α and β chains for the BV13 (CDR3b: CASSFFGSNQPQHF) and BV28 (CDR3b: CASGSSGQGEYGELFF) TCR were cloned from expanded T cells sorted from patient 3713 infusion bag cells stained with SRPX tetramer. OKT3-stimulated PBMCs were transfected with RNAs encoding the appropriate α and β pairs or with GFP. Transfected T cells were cocultured with either mutated SRPX–pulsed T2 cells (left panel) or tumor cells from patient 3713 (right panel), along with the appropriate negative controls (right panel: T2 pulsed with MART126-35 -2L epitope and melanoma cells from patient 3466). Bulk-treatment TILs from patient 3713 were used as a positive control for effector cells. Sixteen hours after the start of the coculture, IFN-γ secretion was measured in the culture supernatant. Results are presented as the mean ± SEM (n = 3) for 2 individual donors. P < 0.05 by Student’s t test for the difference in IFN-γ secretion compared with the negative control.
Figure 5
Figure 5. Tumor reactivity of T cells specific for mutated antigens.
T cells that were isolated using mutated tetramer complexes were analyzed for peptide and tumor reactivity. T cells from patients 3713 (A), 3466 (B), 3879 (C), and 3919 (D) were cocultured with either peptide-pulsed T2/T2A1 cells (as indicated) or tumor cells. Sixteen hours after the start of the coculture, IFN-γ secretion was measured by ELISA in the culture supernatant. Results for patients 3713, 3879, and 3919 are presented as the mean ± SEM (n = 3). P > 0.05 by Student’s t test for the difference in IFN-γ secretion compared with the negative control.
Figure 4
Figure 4. Sorting and expansion of mutated antigen–specific T cells from peripheral blood.
(A) Cells (1 × 10⁷ to 4 × 10⁷) from pretreatment pheresis samples were thawed and incubated overnight in lymphocyte medium, followed by staining simultaneously with the indicated PE- and APC-labeled tetramers. The frequency of double-positive cells is indicated. (B) The tetramer-positive cell population was sorted and expanded in vitro, and 10 days after expansion, these cells were assessed for tetramer binding. The percentage of positive cells (gated on the CD8+ cell population) is indicated. (C) Similarly, mutated ErbB2–specific cells were sorted from peripheral blood cells. As the relative frequency of these cells was low after the first expansion (left histogram), a second sorting step was performed, and these cells were expanded and then analyzed for ErbB2-tetramer binding (right histogram).
Figure 3
Figure 3. Treatment TILs recognize mutated antigens.
(A) Bulk-treatment TIL cultures were stained with the indicated tetramer and analyzed by flow cytometry. (B) TILs were cocultured with T2 cells pulsed with the indicated mutated epitope at different concentrations (ranging from 10–6 to 10–13 M) or cocultured with T2 cells pulsed with irrelevant peptide (Ctrl, at 10–6 M). Sixteen hours after the start of the coculture, IFN-γ secretion was measured by ELISA. (C) Tetramer-positive cell populations were sorted from infusion TILs and expanded using OKT3. Ten days after the start of the expansion, T cells were assessed for tetramer binding. (D) Bulk-treatment TILs for patient 3703 were analyzed for HLA-A*02:01/mutated epitope tetramer binding. The frequency of tetramer-positive cells (y axis) for each peptide screened (x axis) is indicated (left panel). A positive mutated epitope, NSDHL, was identified (middle panel), and a representative staining plot of 2 tetramer-positive cell populations is shown (right panel). (E) NSDHLhi and NSDHLlo cell populations were sorted and expanded, and 10 days after the start of the expansion, T cells were assessed for NSDHL-tetramer binding (left panels). Additionally, these sorted cell populations were assessed for CD4 and CD8 expression (middle panels). The NSDHLhi cell population, which consisted of 98% CD8+ T cells, and the NSDHLlo cell population, which consisted of 99% CD4+ T cells, were analyzed for peptide reactivity in coculture with T2 cells pulsed with titrated doses of the mutated NSDHL epitope. Sixteen hours after the start of the coculture, IFN-γ secretion was measured in the culture supernatant by ELISA (right panels). Results are representative of 2 independent experiments.
Figure 2
Figure 2. Sorting and expansion of mutated antigen–specific T cells.
(A) Tetramer-positive T cells were sorted from FTDs and expanded in vitro by stimulation with OKT3. Ten days later, T cells were assessed for tetramer binding. (B) T cells that were sorted and expanded in vitro were cocultured with T2 cells pulsed with the cognate mutated epitope or cocultured with T2 cells pulsed with the corresponding WT peptide. Sixteen hours after the start of the coculture, IFN-γ secretion was measured by ELISA. Results are presented as the mean ± SEM (n = 3). P < 0.05 by Student’s t test for the difference in IFN-γ secretion between mutated (Mut pep) and WT peptides (WT pep).
Figure 1
Figure 1. Analysis of FTDs.
(A) Schematic representation of the experimental strategy. (B) Approximately 3 × 10⁴ to 5 × 10⁴ cells from FTDs were incubated for 3 to 4 days in lymphocyte medium and then stained with panels of mutated epitope MHC tetramers. The cells were analyzed by flow cytometry (gated on the lymphocyte population). For each patient, the frequency of tetramer-positive cells is indicated (y axis) for each peptide screened (x axis). Patients 3713, 3466, and 3879 were screened for binding to HLA-A*02:01 tetramers and patient 3919 for binding to HLA-A1 tetramers. (C) Tetramer (Tet) staining for selected mutated epitopes identified for each patient. The percentage of positive cells is indicated. (D) Cultured FTD cells were incubated with T2 cells pulsed with the predicted mutated epitopes or incubated with T2 cells pulsed with irrelevant peptide (Ctrl, see Methods) for 16 hours, and IFN-γ secretion was measured by ELISA. Pt., patient.

References

    1. Hanahan D, Weinberg RA. Hallmarks of cancer: the next generation. Cell. 2011;144(5):646–674. doi: 10.1016/j.cell.2011.02.013. - DOI - PubMed
    1. Vogelstein B, Papadopoulos N, Velculescu VE, Zhou S, Diaz LA, Jr, Kinzler KW. Cancer genome landscapes. Science. 2013;339(6127):1546–1558. doi: 10.1126/science.1235122. - DOI - PMC - PubMed
    1. Kandoth C, et al. Mutational landscape and significance across 12 major cancer types. Nature. 2013;502(7471):333–339. doi: 10.1038/nature12634. - DOI - PMC - PubMed
    1. Walia V, Mu EW, Lin JC, Samuels Y. Delving into somatic variation in sporadic melanoma. Pigment Cell Melanoma Res. 2012;25(2):155–170. doi: 10.1111/j.1755-148X.2012.00976.x. - DOI - PMC - PubMed
    1. Hodis E, et al. A landscape of driver mutations in melanoma. Cell. 2012;150(2):251–263. doi: 10.1016/j.cell.2012.06.024. - DOI - PMC - PubMed

Publication types

MeSH terms