
Isocitrate-to-SENP1 signaling amplifies insulin secretion and rescues dysfunctional β cells

Mourad Ferdaoussi et al. J Clin Invest. .

Abstract

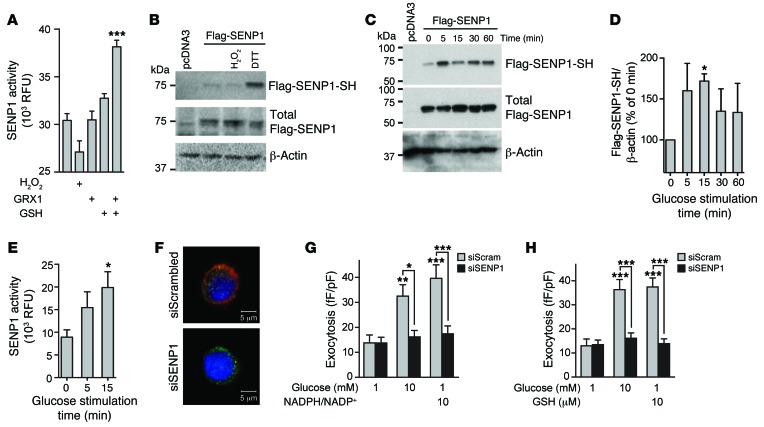
Insulin secretion from β cells of the pancreatic islets of Langerhans controls metabolic homeostasis and is impaired in individuals with type 2 diabetes (T2D). Increases in blood glucose trigger insulin release by closing ATP-sensitive K+ channels, depolarizing β cells, and opening voltage-dependent Ca2+ channels to elicit insulin exocytosis. However, one or more additional pathway(s) amplify the secretory response, likely at the distal exocytotic site. The mitochondrial export of isocitrate and engagement with cytosolic isocitrate dehydrogenase (ICDc) may be one key pathway, but the mechanism linking this to insulin secretion and its role in T2D have not been defined. Here, we show that the ICDc-dependent generation of NADPH and subsequent glutathione (GSH) reduction contribute to the amplification of insulin exocytosis via sentrin/SUMO-specific protease-1 (SENP1). In human T2D and an in vitro model of human islet dysfunction, the glucose-dependent amplification of exocytosis was impaired and could be rescued by introduction of signaling intermediates from this pathway. Moreover, islet-specific Senp1 deletion in mice caused impaired glucose tolerance by reducing the amplification of insulin exocytosis. Together, our results identify a pathway that links glucose metabolism to the amplification of insulin secretion and demonstrate that restoration of this axis rescues β cell function in T2D.


Figures

Figure 8
Figure 8. Pancreatic islet–specific knockout of Senp1 blunts insulin secretion due to an impaired amplification of exocytosis.
(A) Immunostaining of pSENP1-WT and pSENP1-KO mouse pancreatic sections for insulin (green), glucagon (red), and nuclei (blue) revealed no difference in islet architecture (see also Supplemental Figure 3B; n = 4 mice of each genotype). (B) Perifusion profile of the secretory response to glucose (16.7 mM) and KCl (30 mM) of pSENP1-WT and pSENP1-KO islets (n = 4 mice of each genotype). (C) With KATP channels held open with diazoxide, the secretory response of pSENP1-WT islets (n = 4 mice) to KCl (30 mM) at 16.7 mM (circles) versus 2.8 mM (squares) glucose is blunted in pSENP1-KO islets (n = 4 mice). (D) Action potential firing is moderately altered in pSENP1-KO β cells (n = 17, 19 cells; 3 and 4 mice of each genotype; see also Supplemental Figure 6, A–C), (E) although islet intracellular Ca2+ responses were unchanged (n = 4 mice of each genotype). (F) The glucose-dependent amplification of exocytosis is lost in pSENP1-KO β cells, and is rescued by reintroduction of cSENP1 (4 μg/ml; n = 28, 33, 42, 32, 37, 39 cells; 4 mice of each genotype). (G) GSH (10 μM) is unable to amplify exocytosis in pSENP1-KO β cells (n = 37, 39, 57, 51, 32, 49 cells; 5 mice of each genotype). (H) Proposed pathway linking mitochondrial export of (iso)citrate, glutathione biosynthesis (blue), and glutathione reduction (orange) pathways to the amplification of insulin exocytosis (yellow). Data are mean ± SEM and were compared with ANOVA followed by Bonferroni post-test (B, C, F, and G) or by 2-tailed Student’s t test (D and E). *P < 0.05, ***P < 0.001. Scale bar: 100 μm (A). n values correspond to graph bars from left to right, respectively.
Figure 7
Figure 7. Pancreatic islet–selective knockout of Senp1 in mice results in impaired glucose-tolerance and plasma insulin responses.
(A) Illustration of the generation of tissue-selective knockout mice. To generate SENP1fl/fl mice, exons 14 and 15 of the Senp1 gene were flanked by 2 loxP sequences. The SENP1fl/fl mice were then crossed with Pdx1-Cre or Pdx1-CreER lines to generate pSENP1-KO and SENP1-KO mice, respectively. (B) SENP1 protein expression in islets from wild-type (pSENP1-WT) and pSENP1-KO mice (n = 3 mice of each genotype). (C) Body weight of pSENP1-WT (n = 18) and pSENP1-KO (n = 14) mice. (D) Insulin tolerance of the pSENP1-WT (n = 13) and pSENP1-KO (n = 10) littermates was not different. (E) Compared with pSENP1-WT mice (n = 11), pSENP1-KO (n = 9) mice were glucose intolerant following an oral glucose challenge. (F) Plasma insulin responses to oral glucose were blunted in pSENP1-KO mice (n = 6 of each genotype). Data are mean ± SEM and were compared with ANOVA followed by Bonferroni post-test or by 2-tailed Student’s t test (AUC in E and F). *P < 0.05, **P < 0.01, ***P < 0.001.
Figure 6
Figure 6. Glucose-dependent amplification of exocytosis in human β cells is impaired in T2D and rescued by activating the isocitrate-to-SENP1 pathway.
(A) Cumulative frequency distribution of exocytotic responses from human β cells cultured under control conditions (BSA) or following 400 μM oleate/palmitate culture, after acute pretreatment with 1 or 10 mM glucose (n = 24, 56, 27, 65 cells; 6 donors). (B) Average exocytotic and (C) secretory responses of BSA-treated and oleate/palmitate-treated cells and islets (n = 5 donors), respectively. (D) Cumulative frequency distribution of exocytotic responses from human β cells from nondiabetic donors (ND, same as Figure 1B; n = 280, 311 cells; 50 donors) or donors with T2D (black lines; n = 116, 148 cells; 19 donors). (E) Average exocytotic and (F) secretory responses of nondiabetic and T2D cells and islets, respectively (for secretion, n = 28 nondiabetic and 12 donors with T2D). (G and H) Total exocytotic response of control treated (BSA) or oleate/palmitate-treated human β cells to glucose stimulation or infusion of (G) 100 μM isocitrate (n = 24, 12, 34, 26 cells; 3 donors) or (H) 4 μg/ml cSENP1 (n = 40, 37, 28, 41 cells; 5 donors). (IL) Total exocytotic responses of β cells from donors with T2D following infusion of (I) 100 μM isocitrate (n = 25, 26, 47 cells; 4 donors), (J) NADPH (at 10:1 with NADP+; n = 47, 41, 63 cells; 5 donors), or (K) 10 μM GSH (n = 29, 39, 50 cells; 4 donors), or (L) upon transduction with Ad-GFP or Ad-GFP-SENP1 (n = 31, 35, 51 cells; 4 donors). Data are mean ± SEM and were compared with ANOVA followed by Bonferroni post-test. *P < 0.05, **P < 0.01, ***P < 0.001. n values correspond to graph bars from left to right, respectively.
Figure 5
Figure 5. SENP1 couples redox state to insulin exocytosis.
(A) The activity of cSENP1 is enhanced by GSH (10 μM), and this is facilitated by GRX1 (10 μg/ml; n = 3 experiments). (B) Reduction of thiol groups on recombinant Flag-SENP1 expressed in INS 832/13 cells (representative of 3 experiments). (C and D) Stimulation of INS 832/13 cells expressing Flag-SENP1 with 10 mM glucose demonstrates glucose-dependent reduction of SENP1 thiols. (C) A representative blot and (D) quantified data normalized to time = 0 (n = 5 experiments). (E) Native SUMO protease activity in INS 832/13 cells is increased following stimulation of cells with 10 mM glucose (n = 9 experiments). (F) Knockdown of SENP1 in human β cells (insulin, green; SENP1, red; DAPI, blue; representative of 19 and 14 cells) (G) prevents the amplification of exocytosis by NADPH (n = 22, 23, 22, 27, 25, 29 cells; 4 donors) and (H) GSH (n = 26, 28, 27, 36, 34, 44 cells; 5 donors). n values correspond to graph bars from left to right, respectively. Data are mean ± SEM and were compared with ANOVA followed by Bonferroni post-test. *P < 0.05, **P < 0.01, ***P < 0.001. Scale bar: 5 μm (F).
Figure 4
Figure 4. SENP1 expression in β cells.
(A) The amplification of exocytosis from 1 to 10 mM glucose, with glutathione-S-transferase (GST) peptide infused as a control, was also mimicked by intracellular dialysis of cSENP1 (4 μg/ml; n = 33, 28, 45 cells, left to right, respectively; 4 donors). (B and C) Confocal imaging of (B) a human β cell (representative of 34 cells from 3 donors) and (C) a INS 832/13 cell (representative of 47 cells from 4 experiments) immunostained for insulin (green) and SENP1 (red). Nuclear staining is with DAPI (blue). (D) TIRF microscopy reveals that in INS 832/13 cells SENP1-EGFP and NPY-mCherry (granule marker) colocalize at the plasma membrane (representative of n = 35 cells; 5 experiments). Data are mean ± SEM and were compared with ANOVA followed by Bonferroni post-test. ***P < 0.001 compared with 1 mM glucose control. Scale bar: 1 μm (BD, insets); 5 μm (B and C); 10 μm (D).
Figure 3
Figure 3. ICDc is required for glucose-dependent glutathione reduction and the amplification of β cell exocytosis.
Knockdown of ICDc (siICDc) in human β cells blunts amplification of exocytosis by (A) glucose (10 mM; n = 24, 41, 18, 49 cells; 7 donors) or (B) isocitrate (100 μM; n = 16, 14, 10, 27 cells; 4 donors), (C) which was rescued by NADPH (10:1 with NADP+; n = 16, 33, 29, 26, 31 cells; 5 donors). (D) Oxidation state of Grx1-roGFP expressed in reaggregated human islets (n = 7 donors). (E and H) Normalized to baseline GSSG, GSH is increased by glucose in INS 832/13 cells. (F and I) As GSSG is unchanged, (G and J) the ratio of reduced-to-oxidized glutathione (GSH:GSSG) is increased by glucose. Compared with siScrambled or BSA-treated controls, these responses are lost in INS 832/13 cells following (EG) knockdown of ICDc (siICDc; n = 9 replicates in 3 experiments) or (HJ) 48-hour culture with 400 μM oleate/palmitate (O/P; n = 6 replicates in 2 experiments). (K) Measurement of amino acids in INS 832/13 cells reveals glucose-dependent increases in alanine (Ala) and glutamic acid/glutamine (Glx) and a drop in asparagine/aspartic acid (Asx), which are blocked by aminooxyacetic acid (AOA; n = 3 separate experiments). Intracellular dialysis of GSH amplified exocytosis in (L) INS 832/13 cells (n = 18, 12, 13, 12 cells) and (M) human β cells (n = 33, 24, 14, 49, 15 cells; 5 donors). Data are mean ± SEM and were compared with (AC, EK, and M) ANOVA followed by Bonferroni post-test, (D) Wilcoxon matched pairs test, or (L) with the nonparametric Kruskal-Wallis 1-way ANOVA followed by Dunn’s post-test. n values correspond to graph bars from left to right, respectively. *P < 0.05, **P < 0.01, ***P < 0.001 compared with the control 1 mM glucose condition, unless indicated otherwise.
Figure 2
Figure 2. Intracellular delivery of metabolic coupling intermediates reveals a role for isocitrate-derived NADPH in the control of β cell exocytosis.
(A) Illustration of the whole-cell patch-clamp for intracellular delivery of molecules prior to (~3 minutes) stimulation of exocytosis by membrane depolarization. (BE) The total exocytotic response of human β cells following acute glucose (10 mM) pretreatment, as in Figure 1A, or upon infusion of (B) 100 μM isocitrate (n = 42, 15, 59 cells; 7 donors), (C) 100 μM α-KG (n = 20, 24, 26 cells; 3 donors), (D) comparing infusion of either 100 μM isocitrate or α-KG in the same donors (n = 28, 36, 35 cells; 4 donors), or (E) upon infusion of 100 μM phosphoenolpyruvate (PEP) (n = 28, 20, 35 cells; 4 donors). (F) The amplification of exocytosis from 1 mM (n = 33 cells; 4 donors) to 10 mM glucose (n = 15 cells; 3 donors) is replicated by direct intracellular dialysis of NADPH (in a 10:1 molar ratio with NADP+, n = 34 cells, 4 donors compared with a ratio of 1:10, n = 31 cells, 4 donors). (G) As in F, without cAMP and with low (0.3 mM) ATP (n = 20, 24, 22, 23, 31 cells; 3 donors). (H) As in F, but with infusion of NADH (in a 10:1 molar ratio with NAD+, n = 20, 24, 31 cells, 3 donors). n values correspond to graph bars from left to right, respectively. Data are mean ± SEM and were compared with ANOVA followed by Bonferroni post-test. **P < 0.01, ***P < 0.001 compared with the 1 mM glucose condition, unless indicated otherwise.
Figure 1
Figure 1. Glucose-dependent amplification of exocytosis in human β cells.
(A) Exocytotic responses of single human β cells measured as increases in cell membrane capacitance by whole-cell patch clamp (at arrow) performed after acute pretreatment with 1 mM (gray trace) or 10 mM (black trace) glucose (representative of 280 and 311 cells from 50 donors). (B) Cumulative frequency distribution of the exocytotic response in β cells from 50 nondiabetic donors at 1 mM (n = 280 cells) and 10 mM glucose (n = 311 cells). (C) Representative voltage-activated Ca2+ currents from human β cells recorded at 1 mM and 10 mM glucose (representative of 72 and 79 cells from 14 donors). (D) The Ca2+ charge entry upon a single 500-ms depolarization to 0 mV at 1 mM (n = 72 cells; 14 donors) and 10 mM glucose (n = 79 cells; 14 donors). (E) The glucose concentration-response curve for amplification of the exocytotic response (black) of human β cells (n = 6 donors) is left-shifted compared with that for glucose-stimulated insulin secretion (gray) from intact human islets (n = 6 donors). Data are mean ± SEM and were compared by 2-tailed Student’s t test.

Comment in

References

    1. Kahn SE, Cooper ME, Del Prato S. Pathophysiology and treatment of type 2 diabetes: perspectives on the past, present, and future. Lancet. 2014;383(9922):1068–1083. doi: 10.1016/S0140-6736(13)62154-6. - DOI - PMC - PubMed
    1. Henquin JC. Regulation of insulin secretion: a matter of phase control and amplitude modulation. Diabetologia. 2009;52(5):739–751. doi: 10.1007/s00125-009-1314-y. - DOI - PubMed
    1. Ashcroft FM, Harrison DE, Ashcroft SJ. Glucose induces closure of single potassium channels in isolated rat pancreatic β-cells. Nature. 1984;312(5993):446–448. doi: 10.1038/312446a0. - DOI - PubMed
    1. Rorsman P, Trube G. Glucose dependent K+-channels in pancreatic β-cells are regulated by intracellular ATP. Pflugers Arch. 1985;405(4):305–309. doi: 10.1007/BF00595682. - DOI - PubMed
    1. Dean PM, Matthews EK. Electrical activity in pancreatic islet cells. Nature. 1968;219(5152):389–390. doi: 10.1038/219389a0. - DOI - PubMed

Publication types

MeSH terms