. 2015 Sep 15;7(9):4978-96.
doi: 10.3390/v7092858.

Alterations of Nuclear Architecture and Epigenetic Signatures during African Swine Fever Virus Infection

Affiliations

Alterations of Nuclear Architecture and Epigenetic Signatures during African Swine Fever Virus Infection

Margarida Simões et al. Viruses. .

Abstract

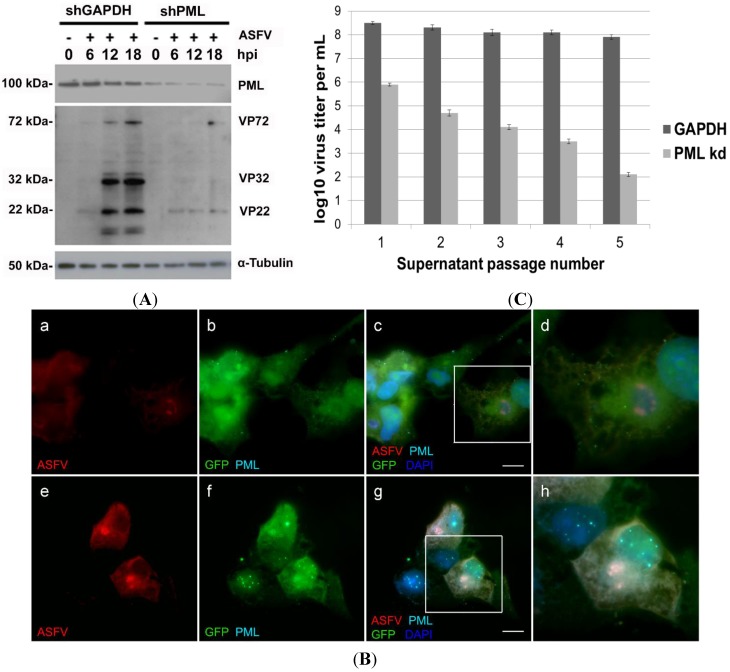
Viral interactions with host nucleus have been thoroughly studied, clarifying molecular mechanisms and providing new antiviral targets. Considering that African swine fever virus (ASFV) intranuclear phase of infection is poorly understood, viral interplay with subnuclear domains and chromatin architecture were addressed. Nuclear speckles, Cajal bodies, and promyelocytic leukaemia nuclear bodies (PML-NBs) were evaluated by immunofluorescence microscopy and Western blot. Further, efficient PML protein knockdown by shRNA lentiviral transduction was used to determine PML-NBs relevance during infection. Nuclear distribution of different histone H3 methylation marks at lysine's 9, 27 and 36, heterochromatin protein 1 isoforms (HP1α, HPβ and HPγ) and several histone deacetylases (HDACs) were also evaluated to assess chromatin status of the host. Our results reveal morphological disruption of all studied subnuclear domains and severe reduction of viral progeny in PML-knockdown cells. ASFV promotes H3K9me3 and HP1β foci formation from early infection, followed by HP1α and HDAC2 nuclear enrichment, suggesting heterochromatinization of host genome. Finally, closeness between DNA damage response factors, disrupted PML-NBs, and virus-induced heterochromatic regions were identified. In sum, our results demonstrate that ASFV orchestrates spatio-temporal nuclear rearrangements, changing subnuclear domains, relocating Ataxia Telangiectasia Mutated Rad-3 related (ATR)-related factors and promoting heterochromatinization, probably controlling transcription, repressing host gene expression, and favouring viral replication.

Keywords: African swine fever virus; Cajal bodies; heterochromatin protein 1; histone H3 methylation modifications; histone deacetylases; nuclear speckles; promyelocytic leukaemia nuclear bodies.


Figures

Figure 1
Figure 1
(A) ASFV induces the reorganization of subnuclear domains. Vero cells were infected with ASFV Ba71V isolate (MOI of 5), fixed at 6 hpi, permeabilized and immunostained; cell nuclei stained with DAPI (blue). (ad) ASFV-infected cells (green) reveal globular and enlarged accumulations of SC-35 (red), while in non-infected cells (eh), nuclear speckles (SC-35) show a pan-nuclear staining. (il) In ASFV-infected Vero cells (green), Cajal bodies (coilin, red) display “comma-shaped” morphology and group together, contrasting with the few pin-point bright foci of non-infected cells (mp). (qt) PML-NBs (PML, red) of infected cells (green) reveal fewer and enlarged domains, when compared to non-infected cells which show an increased number of smaller dots (uz). Scale bar, 10 μm. Representative images of at least three independent experiments are shown; (B) Protein levels of SC-35, coilin and PML remain constant during ASFV infection. Vero cells infected with ASFV Ba71V isolate were lysed at 6 and 12 hpi, and compared to mock-infected cells, using immunoblotting analysis. α-Tubulin was used as loading control. Molecular weights (kDa) of evaluated proteins are indicated on the left of immunoblot images.
Figure 2
Figure 2
PML-NBs and DDR factors juxtapose during ASFV infection. (A) Immunofluorescence analysis of PML-NBs (cyan) and two DNA damage response factors (red) was performed in ASFV-infected cells (8 hpi, green) and in non-infected cells. Cell nuclei were counterstained with DAPI (blue). (ad) In ASFV-infected cells, enlarged PML-NBs (cyan) are juxtaposed to phosphorylated p53 form (p-p53, red), while in non-infected cells these subnuclear domains do not associate to activated p53 loci (eh). Additionally, enlarged PML-NBs neighbour pATR accumulations (il), as non-infected cells display smaller PML-NBs and pATR faint staining dispersed throughout the nucleus (mp). Scale bar, 10 μm. Representative microscopy images of at least three independent experiments are shown; (B) and (C) Relative distance between PML-NBs and p-p53/pATR foci was evaluated by radial intensity profile analysis in ASFV-infected cells (solid lines) and non-infected cells (dashed lines). Normalized fluorescence intensity curves from the centre of PML-NBs (blue lines) to p-p53 accumulations (B) or to pATR foci (C) (represented by red lines) are plotted. Error bars represent standard errors (±SE). Radial profile analysis shows the close proximity between the subnuclear domains and the higher intensity DDR-factor accumulation regions only in ASFV-infected cells, as blue and red solid lines cross at a point of the studied radius, contrasting to the absence of intersection between PML-NBs (blue dashed lines) and p-p53/pATR fluorescence intensities (red dashed lines) in non-infected cells.
Figure 3
Figure 3
PML has a proviral role in ASFV infection. (A) Whole cell extracts were collected from Vero-shRNA-PML and Vero-shRNA-GAPDH cells, non-infected and infected with ASFV Ba71V isolate (MOI of 1) at 6, 12 and 18 hpi. In Vero-shRNA-PML cells, expression levels of a ≈22 kDa viral protein remain residual throughout infection, whereas in Vero-shRNA-GAPDH cells (control) this viral protein showed increasing levels. In addition, other structural viral proteins (≈32 kDa and ≈72 kDa) in ASFV-infected PML knockdown cells did not present the expression levels detected in infected shGAPDH cells, even at late times of infection. Overall, viral protein synthesis is diminished in Vero-shRNA-PML knockdown cells. As expected, mock-infected cells (0 hpi), showed no viral protein expression. α-Tubulin was used as loading control. Molecular weights (kDa) of evaluated proteins are indicated on the left of immunoblot images; (B) PML knockdown cells display lower intensity viral proteins staining and aberrant ASFV factories. (ad) Vero-shRNA-PML cells (GFP expressing, green) were infected with ASFV (MOI of 1) and analysed at 12 hpi. PML (cyan) and ASFV-infected cells (red) were further detected by immunofluorescence. PML-NBs could not be visualized in PML knockdown cells, which show viral cytoplasmic factories with atypical morphology (horseshoe-shaped). (eh) In contrast, Vero-shRNA-GAPDH cells (green) display enlarged PML-NBs and typical round-shaped viral factories (red). Scale bar, 10 µm. Representative images of at least three independent experiments are shown; (C) ASFV progeny is reduced in Vero-shRNA-PML kd cells. A drastic reduction in virus yields was observed in ASFV-infected PML knockdown cells (light grey columns) in comparison to the viral progeny production obtained from infected Vero-shRNA-GAPDH cells (dark grey columns). Each column represents the average of results obtained from three independent experiments, and the error bars represent the standard error (SE) values. Log decay of virus titer was considered as statistically significant (p value < 0.05).
Figure 4
Figure 4
ASFV modifies the host chromatin state. Immunofluorescence analysis was performed on non-infected and ASFV-infected Vero cells (8 hpi) using specific antibodies recognizing heterochromatin marks—H3K9me3, HP1β and HDAC2 (red) and viral proteins (green). Cell nuclei were counterstained with DAPI (blue). (ad) Histone H3 trimethylated at lysine 9 (H3K9me3, red) show large accumulations throughout the nucleoplasm upon ASFV infection (green), not observed in uninfected cells (eh). ASFV-infected cells (green) also present HP1β (red) nucleoplasmic accumulations (il), not detected in non-infected cells (mp). HDAC2 (red) is the only member of HDACs family that displays a more intense nuclear labelling in ASFV-infected cells (green), and additional recruitment to viral cytoplasmic factories (qt), when compared to non-infected cells (uz). Scale bar, 10 μm. Representative microscopy images of at least three independent experiments are shown.
Figure 5
Figure 5
ASFV leads to juxtaposition of host heterochromatic regions, disrupted subnuclear domains and pATR foci. (A) Heterochromatin marker HP1β is labelled in red, while subnuclear domains (PML-NBs, nuclear speckles or Cajal bodies) and the activated ATR kinase are labelled in cyan. Cell nuclei were counterstained with DAPI (blue). (ad) Only ASFV-infected cells (green) display the speckled pattern of enlarged SC-35 accumulations (cyan) juxtaposed to the heterochromatic regions (HP1 β, red), as non-infected cells do not reveal the close proximity pattern (a’d’). In contrast to non-infected cells (e’h’), the ASFV-induced bulky heterochromatic territories (HP1β, red) are always present within close vicinity to disrupted Cajal bodies (cyan) (eh). Enlarged heterochromatic regions (HP1β, red) closely neighbour reorganized PML-NBs (cyan) in infected cells (green) (il), rearrangements not observable in non-infected cells (i'l’). HP1β deposits (red) juxtapose to pATR foci (cyan), in ASFV-infected cells (green) (mp), different chromatin/pATR appearances and distributions in non-infected cells (m’–p’). Scale bar, 10 μm. Representative microscopy images of at least three independent experiments are shown; (BE) Relative distance between the studied subnuclear domains/pATR foci (cyan) and heterochromatic regions (red) was evaluated by radial intensity profile analysis in ASFV-infected cells (solid lines) and non-infected cells (dashed lines). Normalized fluorescence curves were obtained from 50 nuclei. Experiments were performed in triplicate and error bars represent standard errors (±SE). Radial profile analysis shows the close proximity, in ASFV-infected cells, between each subnuclear domain/pATR foci (blue solid line) and HP1β accumulations (red solid line), crossing at a point within the given radius (1 µm). Dashed lines representing fluorescence intensities of subnuclear domains/pATR (blue) and heterochromatic regions (red) never intersect, revealing a greater distance between these nuclear domains/factors in non-infected cells.
Figure 5
Figure 5
ASFV leads to juxtaposition of host heterochromatic regions, disrupted subnuclear domains and pATR foci. (A) Heterochromatin marker HP1β is labelled in red, while subnuclear domains (PML-NBs, nuclear speckles or Cajal bodies) and the activated ATR kinase are labelled in cyan. Cell nuclei were counterstained with DAPI (blue). (ad) Only ASFV-infected cells (green) display the speckled pattern of enlarged SC-35 accumulations (cyan) juxtaposed to the heterochromatic regions (HP1 β, red), as non-infected cells do not reveal the close proximity pattern (a’d’). In contrast to non-infected cells (e’h’), the ASFV-induced bulky heterochromatic territories (HP1β, red) are always present within close vicinity to disrupted Cajal bodies (cyan) (eh). Enlarged heterochromatic regions (HP1β, red) closely neighbour reorganized PML-NBs (cyan) in infected cells (green) (il), rearrangements not observable in non-infected cells (i'l’). HP1β deposits (red) juxtapose to pATR foci (cyan), in ASFV-infected cells (green) (mp), different chromatin/pATR appearances and distributions in non-infected cells (m’–p’). Scale bar, 10 μm. Representative microscopy images of at least three independent experiments are shown; (BE) Relative distance between the studied subnuclear domains/pATR foci (cyan) and heterochromatic regions (red) was evaluated by radial intensity profile analysis in ASFV-infected cells (solid lines) and non-infected cells (dashed lines). Normalized fluorescence curves were obtained from 50 nuclei. Experiments were performed in triplicate and error bars represent standard errors (±SE). Radial profile analysis shows the close proximity, in ASFV-infected cells, between each subnuclear domain/pATR foci (blue solid line) and HP1β accumulations (red solid line), crossing at a point within the given radius (1 µm). Dashed lines representing fluorescence intensities of subnuclear domains/pATR (blue) and heterochromatic regions (red) never intersect, revealing a greater distance between these nuclear domains/factors in non-infected cells.
Figure 6
Figure 6
Proposed working model for ASFV-host interactions. ASFV-infected cells show a fully reorganized nuclear architecture. ASFV genomes most probably recognized as DNA damage sites, after migrating into host cell nucleus, activate DNA damage response factors (p-p53 and pATR), that juxtapose to enlarged PML-NBs (yellow circles). The activated p53 (p-p53, purple circles) and ATR (pATR, red shapes) also accumulate nearby heterochromatic regions (blue forms). In addition, the viral infection promotes nuclear speckles enlargement (pink circles) and Cajal bodies remodelling (green “comma-shaped” forms). All subnuclear domains display close vicinity to viral-induced heterochromatic regions enriched by H3K9me3, H3K27me3, HP1α/β isoforms and HDAC2.

Similar articles

Cited by

References

    1. Sánchez-Vizcaíno J.M., Mur L., Martínez-López B. African swine fever (ASF): Five years around Europe. Vet. Microbiol. 2013;165:45–50. doi: 10.1016/j.vetmic.2012.11.030. - DOI - PubMed
    1. European Commission African Swine Fever. EFSA Panel on Animal Health and Welfare (AHAW) EFSA J. 2015;13 doi: 10.2903/j.efsa.2015.4163. - DOI
    1. King A.M.Q., Lefkowitz E., Adams M.J., Carstens E.B. Ninth report of the International Committee on Taxonomy of Viruses. In: King A.M.Q., editor. Virus Taxonomy. Elsevier; London, UK: 2011. pp. 153–162.
    1. Sánchez E.G., Quintas A., Nogal M., Castelló A., Revilla Y. African swine fever virus controls the host transcription and cellular machinery of protein synthesis. Virus Res. 2013;173:58–75. doi: 10.1016/j.virusres.2012.10.025. - DOI - PubMed
    1. Ballester M., Rodríguez-Cariño C., Pérez M., Gallardo C., Rodríguez J.M., Salas M.L., Rodriguez F. Disruption of nuclear organization during the initial phase of African swine fever virus infection. J. Virol. 2011;85:8263–8269. doi: 10.1128/JVI.00704-11. - DOI - PMC - PubMed

Publication types

LinkOut - more resources