

Applications of MMPBSA to Membrane Proteins I: Efficient Numerical Solutions of Periodic Poisson-Boltzmann Equation
- PMID: 26389966
- PMCID: PMC4720152
- DOI: 10.1021/acs.jcim.5b00341
Applications of MMPBSA to Membrane Proteins I: Efficient Numerical Solutions of Periodic Poisson-Boltzmann Equation
Abstract
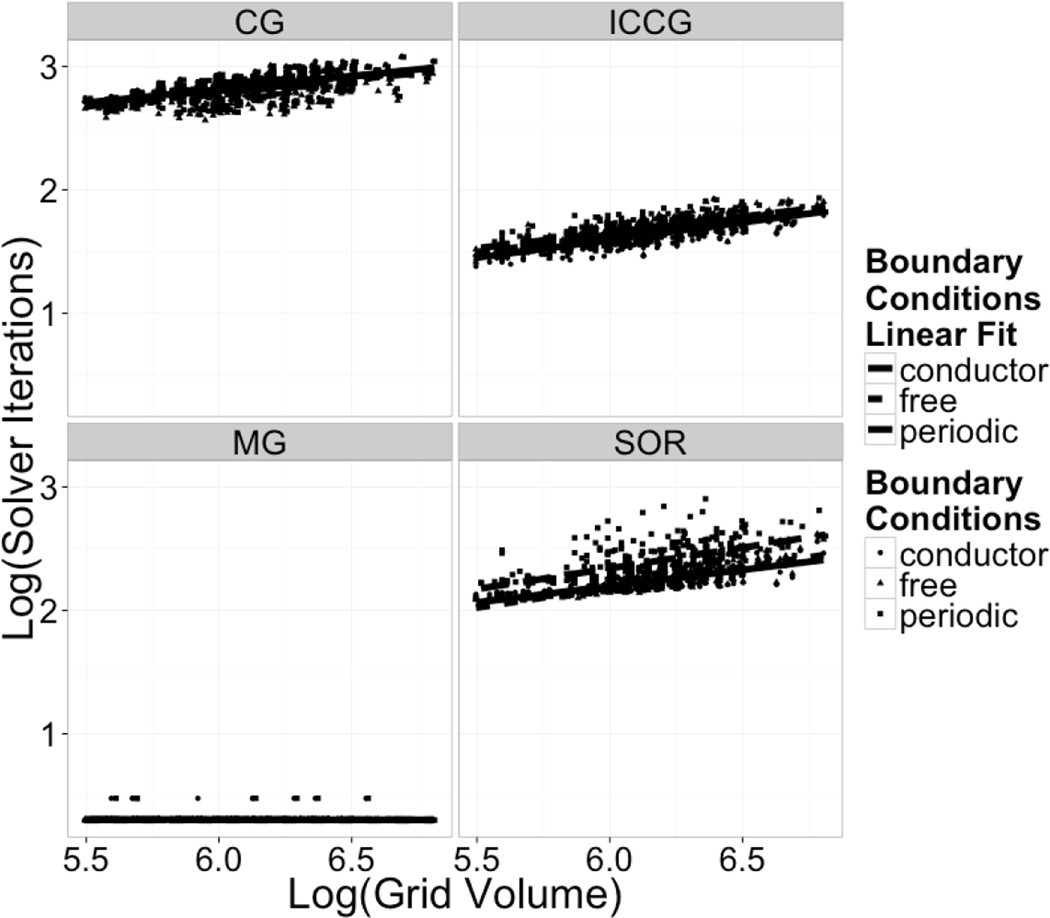
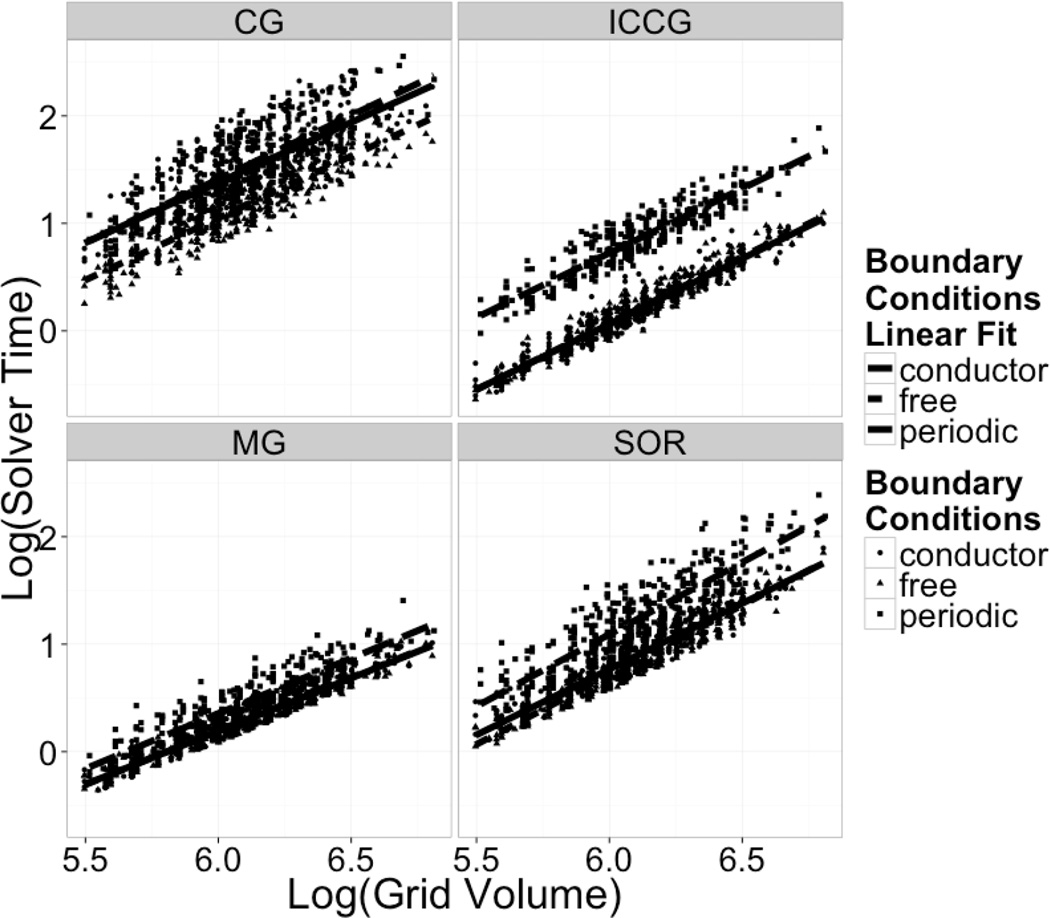
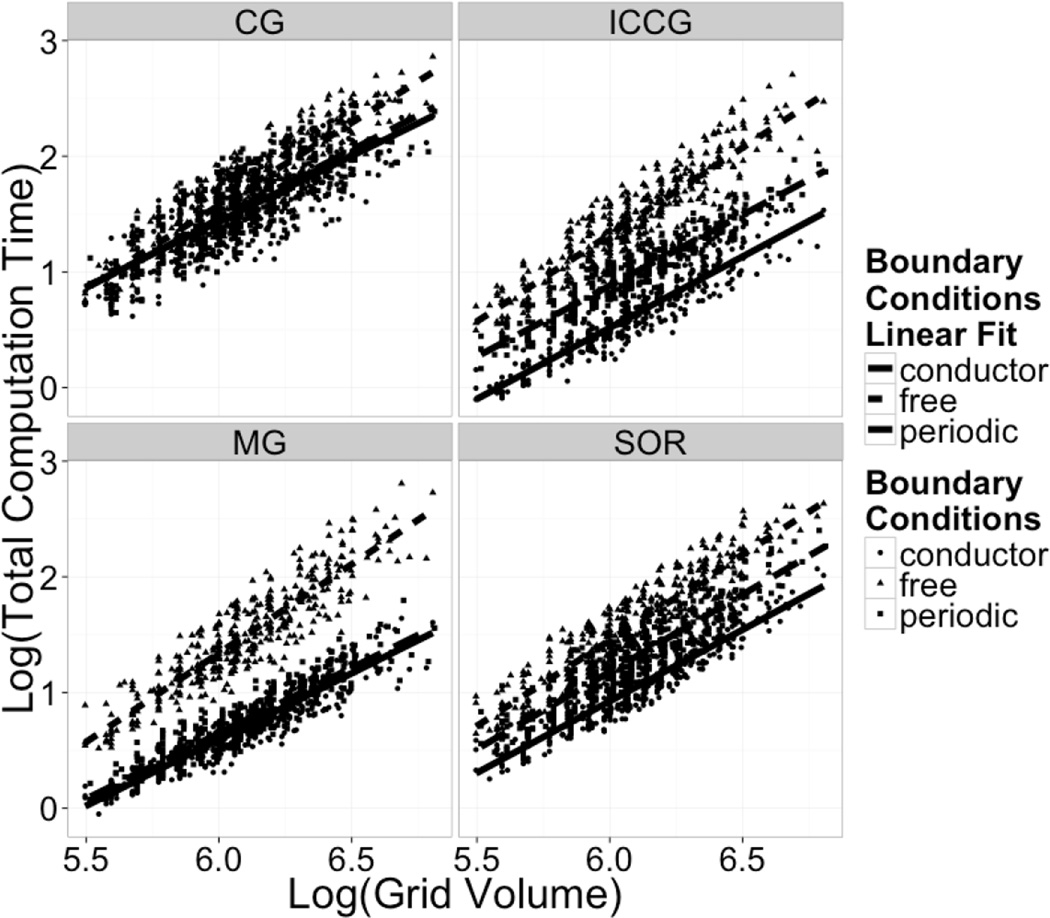
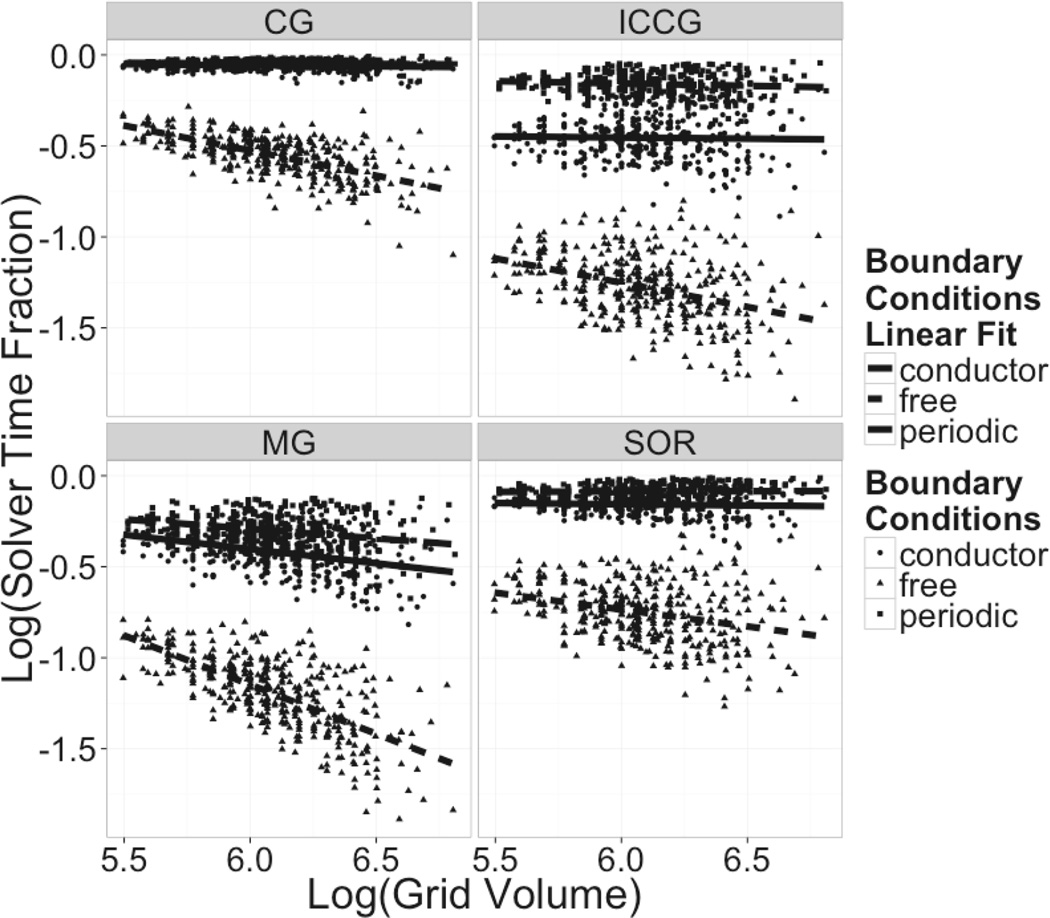
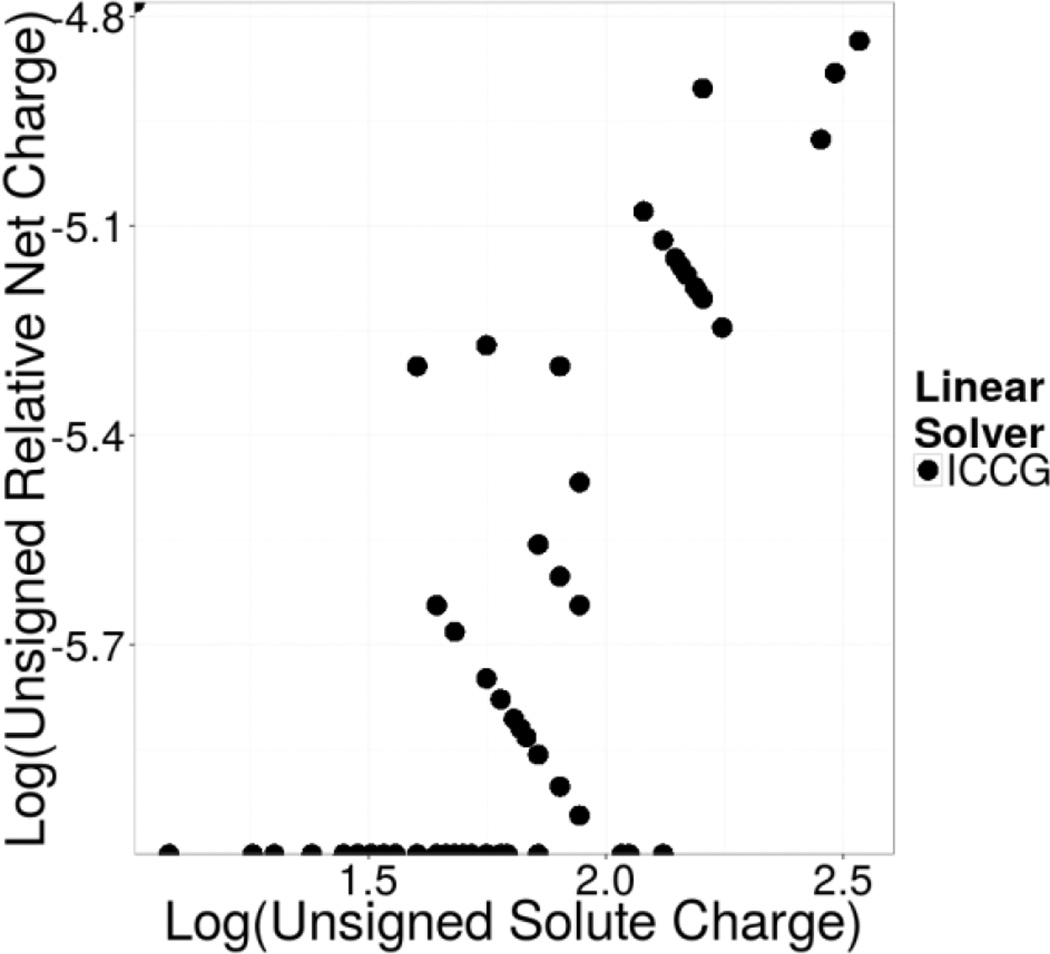
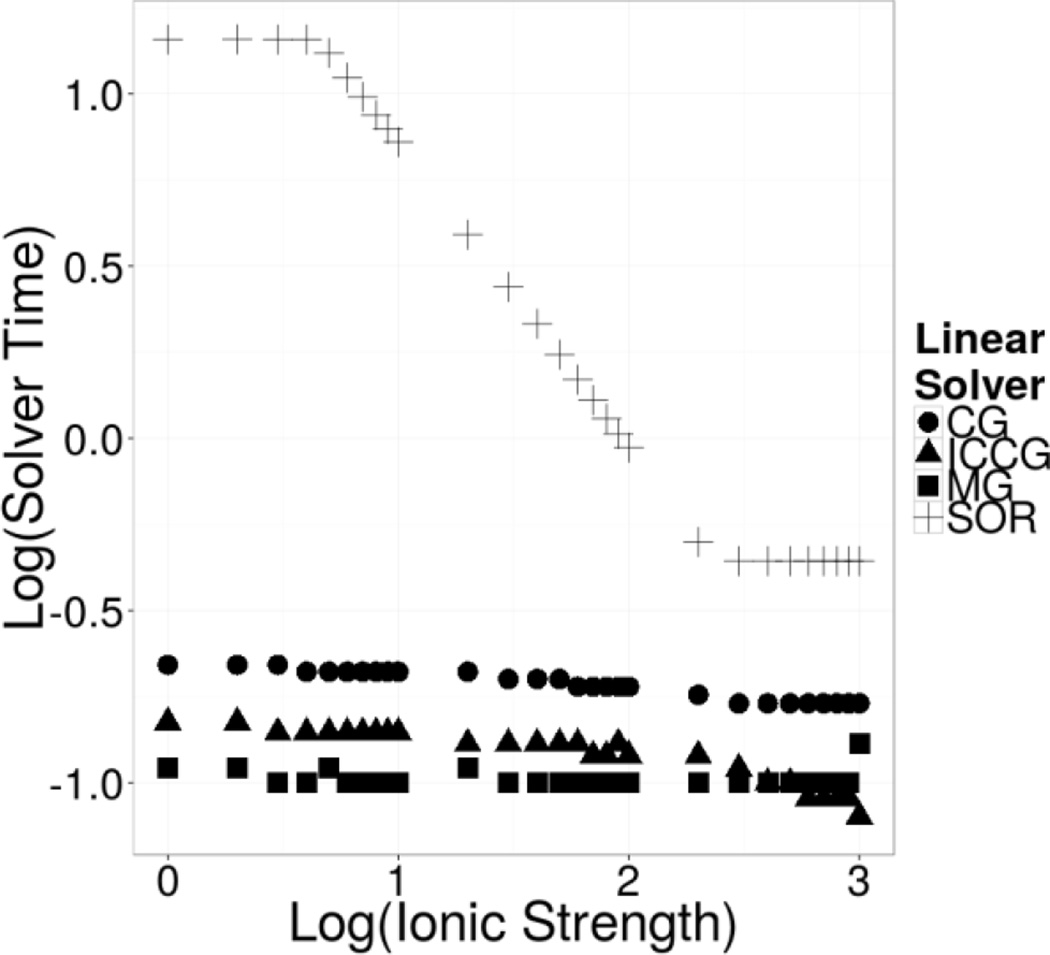
Continuum solvent models have been widely used in biomolecular modeling applications. Recently much attention has been given to inclusion of implicit membranes into existing continuum Poisson-Boltzmann solvent models to extend their applications to membrane systems. Inclusion of an implicit membrane complicates numerical solutions of the underlining Poisson-Boltzmann equation due to the dielectric inhomogeneity on the boundary surfaces of a computation grid. This can be alleviated by the use of the periodic boundary condition, a common practice in electrostatic computations in particle simulations. The conjugate gradient and successive over-relaxation methods are relatively straightforward to be adapted to periodic calculations, but their convergence rates are quite low, limiting their applications to free energy simulations that require a large number of conformations to be processed. To accelerate convergence, the Incomplete Cholesky preconditioning and the geometric multigrid methods have been extended to incorporate periodicity for biomolecular applications. Impressive convergence behaviors were found as in the previous applications of these numerical methods to tested biomolecules and MMPBSA calculations.
Figures
Similar articles
-
Assessment of linear finite-difference Poisson-Boltzmann solvers.J Comput Chem. 2010 Jun;31(8):1689-98. doi: 10.1002/jcc.21456. J Comput Chem. 2010. PMID: 20063271 Free PMC article.
-
Accelerated Poisson-Boltzmann calculations for static and dynamic systems.J Comput Chem. 2002 Oct;23(13):1244-53. doi: 10.1002/jcc.10120. J Comput Chem. 2002. PMID: 12210150
-
Robustness and Efficiency of Poisson-Boltzmann Modeling on Graphics Processing Units.J Chem Inf Model. 2019 Jan 28;59(1):409-420. doi: 10.1021/acs.jcim.8b00761. Epub 2018 Dec 31. J Chem Inf Model. 2019. PMID: 30550277 Free PMC article.
-
The Poisson-Boltzmann equation for biomolecular electrostatics: a tool for structural biology.J Mol Recognit. 2002 Nov-Dec;15(6):377-92. doi: 10.1002/jmr.577. J Mol Recognit. 2002. PMID: 12501158 Review.
-
Electrostatics calculations: latest methodological advances.Curr Opin Struct Biol. 2006 Apr;16(2):142-51. doi: 10.1016/j.sbi.2006.03.001. Epub 2006 Mar 15. Curr Opin Struct Biol. 2006. PMID: 16540310 Review.
Cited by
-
Modeling Membrane Protein-Ligand Binding Interactions: The Human Purinergic Platelet Receptor.J Phys Chem B. 2016 Dec 8;120(48):12293-12304. doi: 10.1021/acs.jpcb.6b09535. Epub 2016 Nov 23. J Phys Chem B. 2016. PMID: 27934233 Free PMC article.
-
Elucidation of WW domain ligand binding specificities in the Hippo pathway reveals STXBP4 as YAP inhibitor.EMBO J. 2020 Jan 2;39(1):e102406. doi: 10.15252/embj.2019102406. Epub 2019 Nov 29. EMBO J. 2020. PMID: 31782549 Free PMC article.
-
Estimating the Roles of Protonation and Electronic Polarization in Absolute Binding Affinity Simulations.J Chem Theory Comput. 2021 Apr 13;17(4):2541-2555. doi: 10.1021/acs.jctc.0c01305. Epub 2021 Mar 25. J Chem Theory Comput. 2021. PMID: 33764050 Free PMC article.
-
Identification of Gα12-vs-Gα13-coupling determinants and development of a Gα12/13-coupled designer GPCR.Sci Rep. 2024 May 15;14(1):11119. doi: 10.1038/s41598-024-61506-4. Sci Rep. 2024. PMID: 38750247 Free PMC article.
-
Heterogeneous Dielectric Implicit Membrane Model for the Calculation of MMPBSA Binding Free Energies.J Chem Inf Model. 2019 Jun 24;59(6):3041-3056. doi: 10.1021/acs.jcim.9b00363. Epub 2019 Jun 13. J Chem Inf Model. 2019. PMID: 31145610 Free PMC article.
References
-
- Davis ME, McCammon JA. Electrostatics in Biomolecular Structure and Dynamics. Chem. Rev. 1990;90:509–521.
-
- Honig B, Sharp K, Yang AS. Macroscopic Models of Aqueous-Solutions - Biological and Chemical Applications. J. Phys. Chem. 1993;97:1101–1109.
-
- Honig B, Nicholls A. Classical Electrostatics in Biology and Chemistry. Science. 1995;268:1144–1149. - PubMed
-
- Beglov D, Roux B. Solvation of Complex Molecules in a Polar Liquid: An Integral Equation Theory. J. Chem. Phys. 1996;104:8678–8689.
-
- Cramer CJ, Truhlar DG. Implicit Solvation Models: Equilibria, Structure, Spectra, and Dynamics. Chem. Rev. 1999;99:2161–2200. - PubMed
Publication types
MeSH terms
Substances
Grants and funding
LinkOut - more resources
Full Text Sources
Other Literature Sources
