. 2015 Oct;21(10):1163-71.
doi: 10.1038/nm.3952. Epub 2015 Sep 21.

Combined inhibition of BET family proteins and histone deacetylases as a potential epigenetics-based therapy for pancreatic ductal adenocarcinoma

Affiliations

Combined inhibition of BET family proteins and histone deacetylases as a potential epigenetics-based therapy for pancreatic ductal adenocarcinoma

Pawel K Mazur et al. Nat Med. 2015 Oct.

Erratum in

Abstract

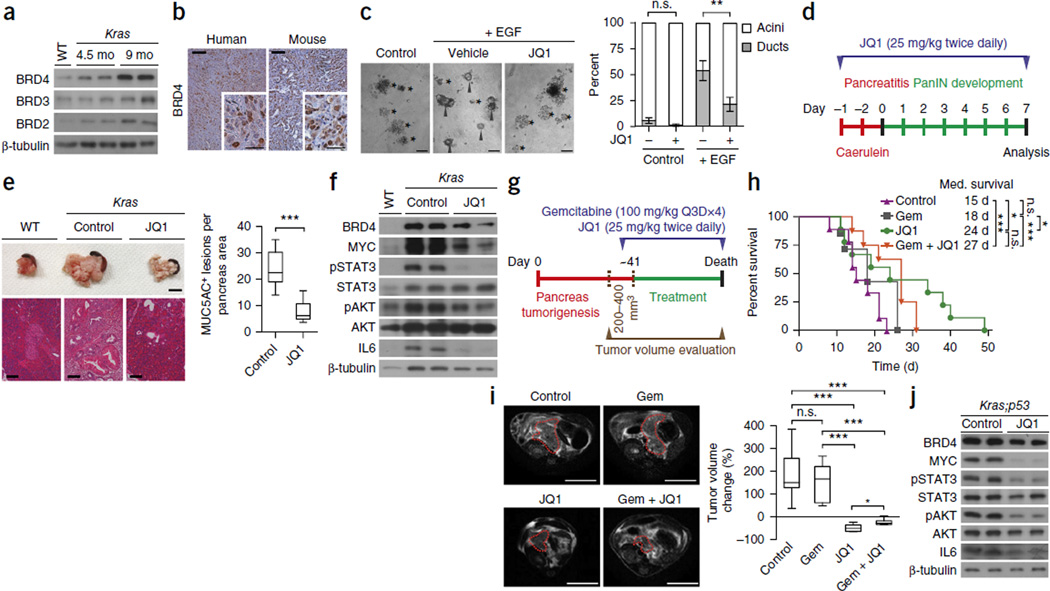
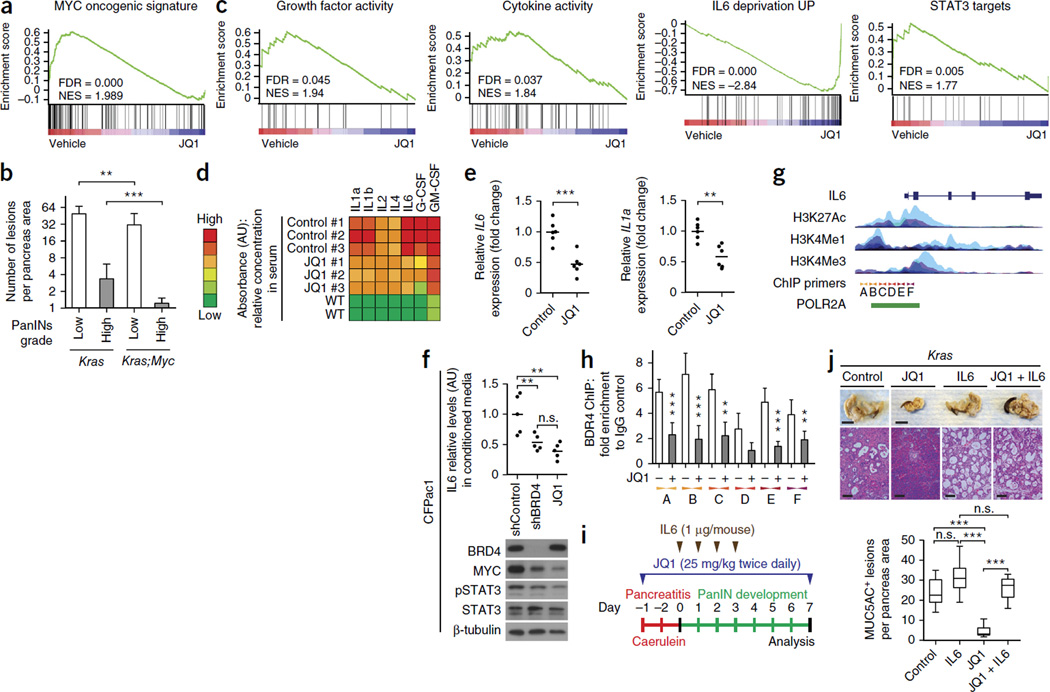
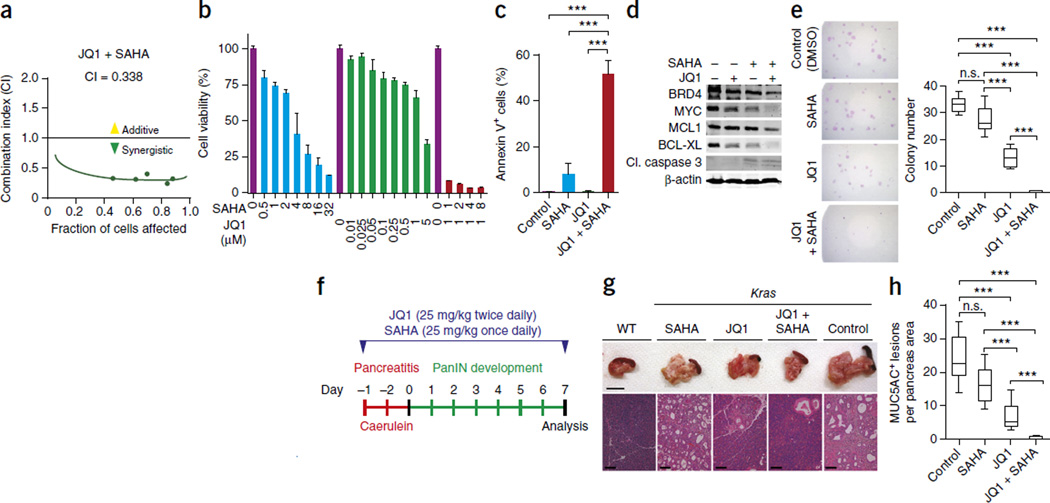
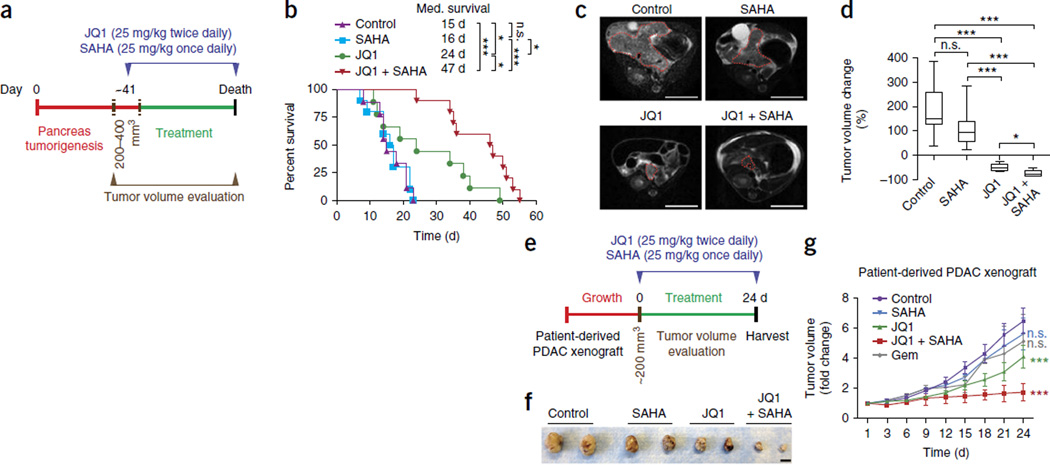
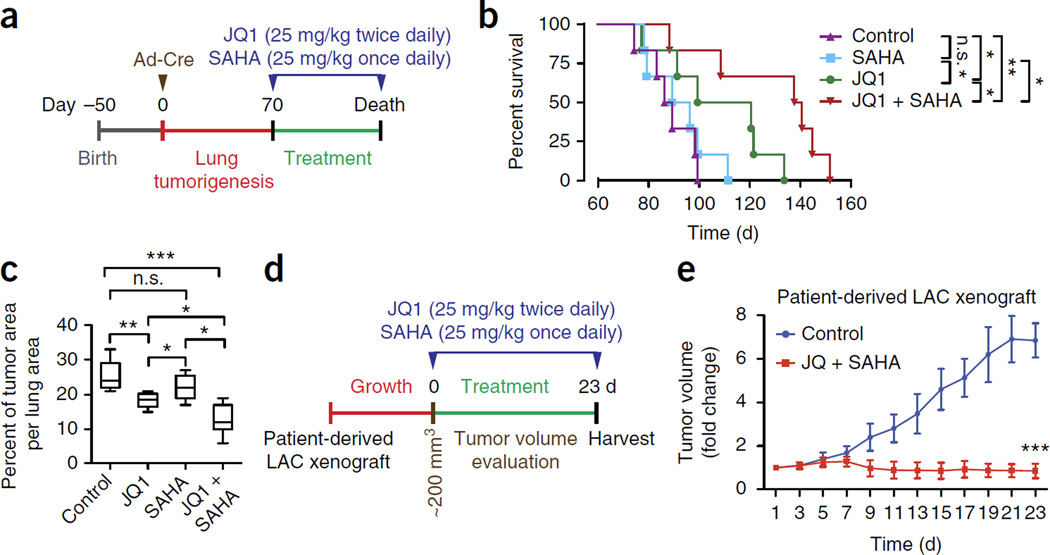
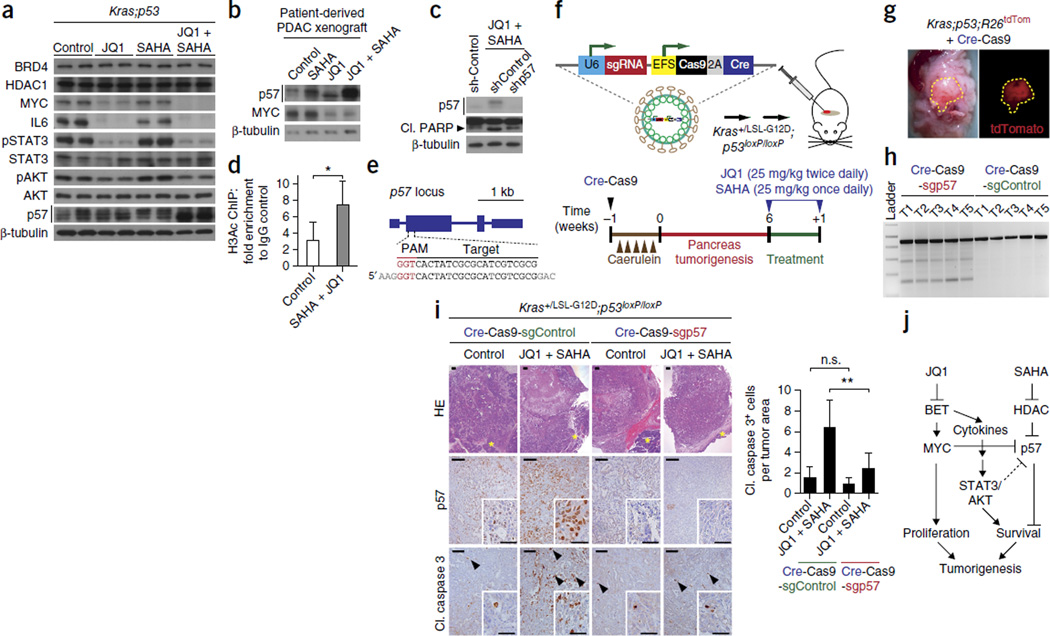
Pancreatic ductal adenocarcinoma (PDAC) is one of the most lethal human cancers and shows resistance to any therapeutic strategy used. Here we tested small-molecule inhibitors targeting chromatin regulators as possible therapeutic agents in PDAC. We show that JQ1, an inhibitor of the bromodomain and extraterminal (BET) family of proteins, suppresses PDAC development in mice by inhibiting both MYC activity and inflammatory signals. The histone deacetylase (HDAC) inhibitor SAHA synergizes with JQ1 to augment cell death and more potently suppress advanced PDAC. Finally, using a CRISPR-Cas9-based method for gene editing directly in the mouse adult pancreas, we show that de-repression of p57 (also known as KIP2 or CDKN1C) upon combined BET and HDAC inhibition is required for the induction of combination therapy-induced cell death in PDAC. SAHA is approved for human use, and molecules similar to JQ1 are being tested in clinical trials. Thus, these studies identify a promising epigenetic-based therapeutic strategy that may be rapidly implemented in fatal human tumors.


Figures

Figure 1
Figure 1
BET protein inhibition suppresses PDAC growth and improves survival in a PDAC mouse model. (a) Immunoblot analysis with the indicated antibodies on tumor lysates from wild-type pancreas and from pancreas of Ptf1a+/Cre;Kras+/LSL-G12D (Kras) mutant mice at 4.5 and 9 months of age (two biological replicates). β-tubulin serves as a loading control. (b) Immunohistochemical analysis of BRD4 expression (brown signal with hematoxylin purple counterstain) on sections from mouse and human PDAC tumors (representative of 12 independent samples). Scale bars, 100 µm, insets 50 µm. (c) Representative images of wild-type mouse acinar clusters (asterisks) undergoing acinar-to-ductal metaplasia (ADM) forming ducts (arrowheads) ex vivo in response to co-culture with EGF or vehicle control for 3 d. Scale bars, 100 µm. Quantification of acinar and ductal clusters on day 3 of culture (right panel), (four independent biological replicates with three technical replicates each). **P < 0.01; n.s., not significant (two-tailed unpaired Student’s t-test). Data are represented as mean ± s.e.m. (d) Schematic of the caerulein pancreatitis–induced precancerous (PanINs) lesion formation protocol used for JQ1 treatment of Kras mice. (e) Representative examples of six pancreata images (scale bars, 1 cm) and hematoxylin and eosin (HE) staining (scale bars, 100 µm) (left panel). Quantification of MUC5AC-positive lesions in caerulein-treated pancreata from Kras control (vehicle) (n = 6) and JQ1 treated (n = 6) mice (right panel). ***P < 0.001 (two-tailed unpaired Student’s t-test). Data are represented as mean ± s.e.m. (f) Immunoblots with the indicated antibodies of pancreatic tissue lysates from wild-type (WT) and Kras mutant control (vehicle) and JQ1-treated mice. (g) Treatment schedule for administration of JQ1, gemcitabine (Gem) or vehicle. Ptf1a+/Cre; Kras+/LSL-G12D;Trp53loxP/loxP (Kras;p53) mutant mice undergoing gemcitabine monotherapy also received vehicle. (h) Kaplan-Meier survival curves of Kras;p53 mutant mice from enrollment time in control (vehicle) (n = 9, median survival = 15 d), gemcitabine (Gem; n = 7, median survival = 18 d), JQ1 (n = 9 median survival = 24 d) and combined Gem + JQ1 (n = 8, median survival = 27 d) treatment groups. *P < 0.05; ***P < 0.001; n.s., not significant by log-rank test for significance. (i) Left, representative MRI scan at endpoint measurement of tumor size in Kras;p53 mice. Scale bars, 1 cm. Red dotted lines indicate tumor area. Right, tumor volume quantification at endpoint based on MRI scan (detailed procedure description in Online Methods and Supplementary Fig. 3) of mice in the treatment groups: control, n = 9; Gem, n = 5; JQ1, n = 6; Gem + JQ1, n = 6. *P < 0.05; ***P < 0.001; n.s., not significant (two-tailed unpaired Student’s t-test). Data are represented as mean ± s.e.m. (j) Immunoblot analysis of MYC, phospho-STAT3 (pSTAT3), phospho-AKT (pAKT) and IL6 levels in tumor biopsies collected from control and JQ1-treated Kras;p53 mutant mice (multiple independent mouse tumors were obtained and analyzed, two independent and representative samples are shown).
Figure 2
Figure 2
MYC and inflammation are key tumorigenic drivers of PDAC that are inhibited by JQ1 treatment and BET protein inhibition. (a) Gene set enrichment analysis (GSEA) in JQ1-treated compared to vehicle-treated Kras;p53 mouse primary PDAC cells. (b) Quantification of spontaneous PanIN lesions formed in 6-month-old Kras (n = 8) and Kras;Myc (n = 8) mutant mice. The grade of lesions is indicated. **P < 0.01; ***P < 0.001 (two-tailed unpaired Student’s t-test). Data are represented as mean ± s.e.m. (c) GSEA from data sets comparing vehicle- to JQ1-treated Kras;p53 mouse primary PDAC cells (see also Supplementary Fig. 5g). (d) Relative serum concentration of inflammatory cytokines in the serum of Kras;p53 mutant mice treated with vehicle control or JQ1 (n = 3 for each experimental group) and wild-type (WT) animals, (e) Quantitative RT-PCR analysis of IL6 and IL1a mRNA expression in patient-derived PDAC xenografts following treatment with JQ1 or vehicle control (see Fig. 4e) (six biological replicates for each experimental condition). **P < 0.01; ***P < 0.001 (two-tailed unpaired Student’s t-test). Data are represented as mean ± s.e.m. (f) Effects of BRD4 inhibition via shRNA or JQ1 treatment on IL6 levels in the conditioned medium of human PDAC CFPac1 cells and for MYC and STAT3 as assessed by immunoblot. **P < 0.01; ***P < 0.001; n.s., not significant (two-tailed unpaired Student’s t-test). Data are represented as mean ± s.e.m. (g) Schematic representation of the human IL6 promoter (UCSC Gene Browser) with integrated epigenetic regulation marks and RNA polymerase II binding (POL2RA, green bar) (ENCODE). Localization of primers used for chromatin immunoprecipitation analysis is indicated by A–F. (h) Chromatin immunoprecipitation analysis of BRD4 at the IL6 promoter in CFPac1 cells treated with vehicle control (−) or JQ1 (+). The data are plotted relative to the values obtained with IgG control antibodies. **P < 0.01; ***P < 0.001 (two-tailed unpaired Student’s t-test). Data are represented as mean ± s.e.m. (i) Schematic of the caerulein pancreatitis– induced preneoplastic (PanIN) lesion formation protocol for the rescue experiment with exogenous IL6 injection upon JQ1 treatment. (j) Top, representative pancreata images (of n = 5 each, scale bars, 1 cm) and HE staining (scale bars, 100 µm) in Kras mutant mice in the four experimental conditions indicated (IHC and immunoblot biopsy analysis shown in Supplementary Fig. 7a,b). Bottom, quantification of MUC5AC-positive lesions in caerulein-treated pancreata from each experimental group (the control group was injected with vehicle control) (n = 5 each; IHC staining on Supplementary Fig. 7a). ***P < 0.001; n.s., not significant (two-tailed unpaired Student’s t-test). Data are represented as mean ± s.e.m.
Figure 3
Figure 3
Synergistic inhibitory effects of JQ1 and the HDAC inhibitor SAHA in PDAC. (a) Combination index (CI) calculation for JQ1 and SAHA. CFPac1 cell viability was measured after 72 h of drug treatment by the MTT survival assay. (b) Validation of the synergistic inhibitory effects of combined treatment with JQ1 and SAHA as measured by the MTT assay in human DanG PDAC cells after 72 h of treatment. Data are represented as mean ± s.e.m. (c) Quantification of apoptotic cell death by annexin V staining in DanG cells following treatment with JQ1 and SAHA (n = 3 independent replicates). ***P < 0.001 (two-tailed unpaired Student’s t-test). Data are represented as mean ± s.e.m. (d) Immunoblot analysis of BRD4, MYC and apoptosis markers in DanG cells treated with JQ1 and SAHA. β-actin served as a loading control. (e) Representative pictures of colony-formation assays with DanG cells in response to JQ1 and SAHA treatment, with quantification at right (n = 3 for each experimental group). ***P < 0.001; n.s., not significant (two-tailed unpaired Student’s t-test). Data are represented as mean ± s.e.m. The control group was treated with vehicle control (b,c–e). (f) Schematic of the caerulein pancreatitis–induced preneoplastic (PanIN) lesion formation protocol in Kras mutant mice for JQ1 and SAHA co-treatment or control (vehicle) experiment. (g) Representative pancreata images (from n = 5 for each experimental group). Scale bars, 1 cm. (h) Quantification of MUC5AC-positive lesions in caerulein-treated Kras mutant mice pancreata from each experimental group (n = 5 for each experimental group; IHC staining in Supplementary Fig. 9a,b). ***P < 0.001; n.s., not significant (two-tailed unpaired Student’s t-test). Data are represented as mean ± s.e.m.
Figure 4
Figure 4
Combined treatment with JQ1 and SAHA inhibits PDAC progression in vivo. (a) Treatment schedule for administration of JQ1 and SAHA. Kras;p53 mutant mice undergoing monotherapy also received placebo (vehicle) (IHC and immunoblot biopsy analysis in Supplementary Fig. 11a–f). (b) Kaplan-Meier survival curves of Kras;p53 mutant mice from enrollment time in control (vehicle) (n = 9, median survival = 15 d), SAHA (n = 9, median survival = 16 d), JQ1 (n = 9 median survival = 24 d, as in Fig. 1j) and combined JQ1 + SAHA (n = 10, median survival = 47 d) treatment groups. *P < 0.05; ***P < 0.001; n.s., not significant by log-rank test for significance. (c) Representative MRI scan showing measurement of tumor size in Kras;p53 mutant mice at time of animal morbidity. Red dotted lines indicate tumor area. Scale bars, 1 cm. (d) Tumor volume quantification based on MRI scan of Kras;p53 mutant mice in the treatment groups: control (vehicle), n = 9; SAHA, n = 9; JQ1, n = 5; JQ1 + SAHA, n = 5. *P < 0.05; ***P < 0.001; n.s., not significant (two-tailed unpaired Student’s t-test). Data are represented as mean ± s.e.m. (e) Treatment schedule for administration of JQ1 and SAHA in a PDX model. (f) Representative macroscopic picture of xenografts from control (vehicle), SAHA, JQ1 and combined JQ1 + SAHA treatment groups at the end of the experiment. Scale bar, 1 cm. (g) Tumor volume quantification of patient-derived PDAC xenografts in mice (n = 4 mice, two tumors per mouse for each treatment group). Mice undergoing monotherapy also received vehicle. ***P < 0.001; n.s., not significant (two-tailed unpaired Student’s t-test). Data are represented as mean ± s.e.m.
Figure 5
Figure 5
JQ1 and SAHA synergistically suppress lung adenocarcinoma growth in vivo. (a) Treatment schedule for administration of JQ1 and SAHA. Kras;p53 mutant mice undergoing monotherapy also received placebo (vehicle). (b) Kaplan-Meier survival curves of Kras;p53 mutant mice from enrollment time in control (vehicle) (n = 6, median survival = 87.5 d), SAHA (n = 6, median survival = 92.5 d), JQ1 (n = 6 med. survival = 109.5 d) and combined SAHA + JQ1 (n = 6, median survival = 138.5 d) treatment groups. *P < 0.05; **P < 0.01; n.s., not significant by log-rank test for significance. (c) Quantification of tumor area per lung area. ***P < 0.001; n.s., not significant (two-tailed unpaired Student’s t-test). Data are represented as mean ± s.e.m. (d) Treatment schedule for administration of JQ1 and SAHA in a lung adenocarcinoma patient-derived xenograft. (e) Tumor volume quantification for lung adenocarcinoma xenografts in mice (n = 5 mice for each treatment group and vehicle control). ***P < 0.001 (two-tailed unpaired Student’s t-test). Data are represented as mean ± s.e.m.
Figure 6
Figure 6
Identification of p57 as a key mediator of PDAC sensitivity to JQ1 and SAHA co-treatment using a gene editing platform in the pancreas of mice. (a) Immunoblot analysis of pancreatic tumor lysates dissected from Kras;p53 mutant mice in response to the indicated treatments and vehicle control (multiple independent mouse tumors were obtained and analyzed; two independent and representative samples are shown). (b) Immunoblot analysis of a patient-derived PDAC xenograft in response to the indicated treatments. (c) Immunoblot analysis of the human PDAC cell line CFPac1 following p57 knockdown (shp57) or scrambled shRNA (shControl) in response to JQ1 (250 nM) and SAHA (250 nM) treatment for 72 h. (d) Chromatin immunoprecipitation analysis of acetylated histone H3 (H3Ac) at the p57 promoter in JQ1 (250 nM) and SAHA (250 nM) or vehicle control–treated CFPac1 cells. *P < 0.05 (two-tailed unpaired Student’s t-test). Data are represented as mean ± s.e.m. of two independent experiments. (e) sgRNA design for targeting the mouse p57 locus. (f) Top, map of the pSECC lentivirus for the simultaneous expression of sgRNA, Cas9 and Cre, which allows genome editing and gene recombination when injected into the pancreatic parenchyma. Bottom, schematic of experimental caerulein- and lentiviral pSECC-induced tumorigenesis in Kras+/LSL-G12D;Trp53loxP/loxP mice with JQ1 and SAHA co-treatment. (g) Representative fluorescence (right, tdTomato) and bright-field (left) images of pancreatic tumors in Kras+/LSL-G12D;Trp53loxP/loxP;R26tdTomato mice following pSECC injection. (h) Surveyor assay for p57 on tumor biopsies from mice infected with pSECC viruses expressing sgControl or sgp57 guide RNAs. T, tumor, each number represents different mouse tumor biopsies. (i) Left, representative HE and IHC analysis (p57, cleaved caspase 3) from pancreatic tumors sections in Kras+/LSL-G12D;p53loxP/loxP mice infected with pSECC sgControl and shp57 lentiviruses and co-treated with JQ1 and SAHA or vehicle control (see also Supplementary Fig. 15d). Scale bars, 100 µm, insets 50 µm. Right, quantification of cleaved caspase 3–positive cells on tumor sections from control and treated mice (n = 4 for each experimental group). **P < 0.01; n.s., not significant (two-tailed unpaired Student’s t-test). Data are represented as mean ± s.e.m. (j) A proposed model for synergistic JQ1 and SAHA co-treatment of PDAC. Inhibition of MYC and inflammatory signals by the inhibitor of BET family proteins JQ1 and inhibition of HDAC activity by SAHA affects several key signaling cascades in PDAC cells. JQ1 and SAHA co-treatment alters the expression of multiple gene programs, including that of p57, which results in a strong antitumoral response.

Comment in

References

    1. Rahib L, et al. Projecting cancer incidence and deaths to 2030: the unexpected burden of thyroid, liver, and pancreas cancers in the United States. Cancer Res. 2014;74:2913–2921. - PubMed
    1. Hezel AF, Kimmelman AC, Stanger BZ, Bardeesy N, Depinho RA. Genetics and biology of pancreatic ductal adenocarcinoma. Genes Dev. 2006;20:1218–1249. - PubMed
    1. Ghaneh P, Costello E, Neoptolemos JP. Biology and management of pancreatic cancer. Gut. 2007;56:1134–1152. - PMC - PubMed
    1. Maitra A, Hruban RH. Pancreatic cancer. Annu. Rev. Pathol. 2008;3:157–188. - PMC - PubMed
    1. Ryan DP, Hong TS, Bardeesy N. Pancreatic adenocarcinoma. N. Engl. J. Med. 2014;371:1039–1049. - PubMed

Publication types

MeSH terms

Associated data