. 2015 Dec;74(6):1548-55.
doi: 10.1002/mrm.25994. Epub 2015 Sep 21.

Quantifying temperature-dependent T1 changes in cortical bone using ultrashort echo-time MRI

Affiliations

Quantifying temperature-dependent T1 changes in cortical bone using ultrashort echo-time MRI

Misung Han et al. Magn Reson Med. 2015 Dec.

Abstract

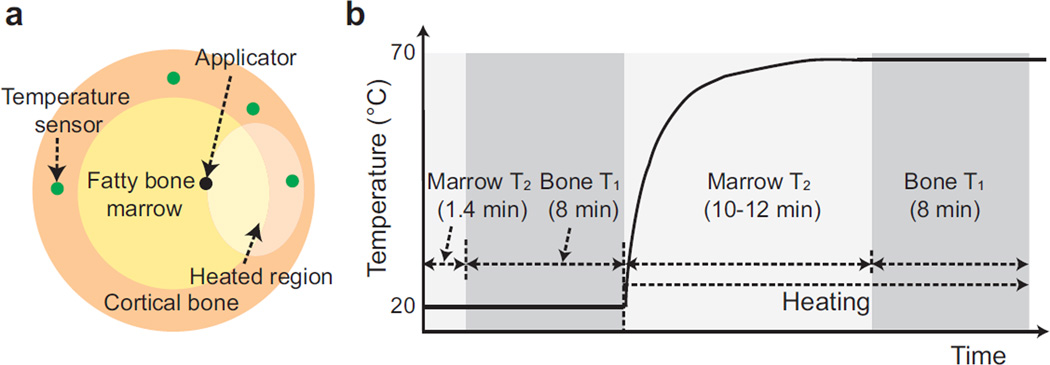
Purpose: To demonstrate the feasibility of using ultrashort echo-time MRI to quantify T1 changes in cortical bone due to heating.

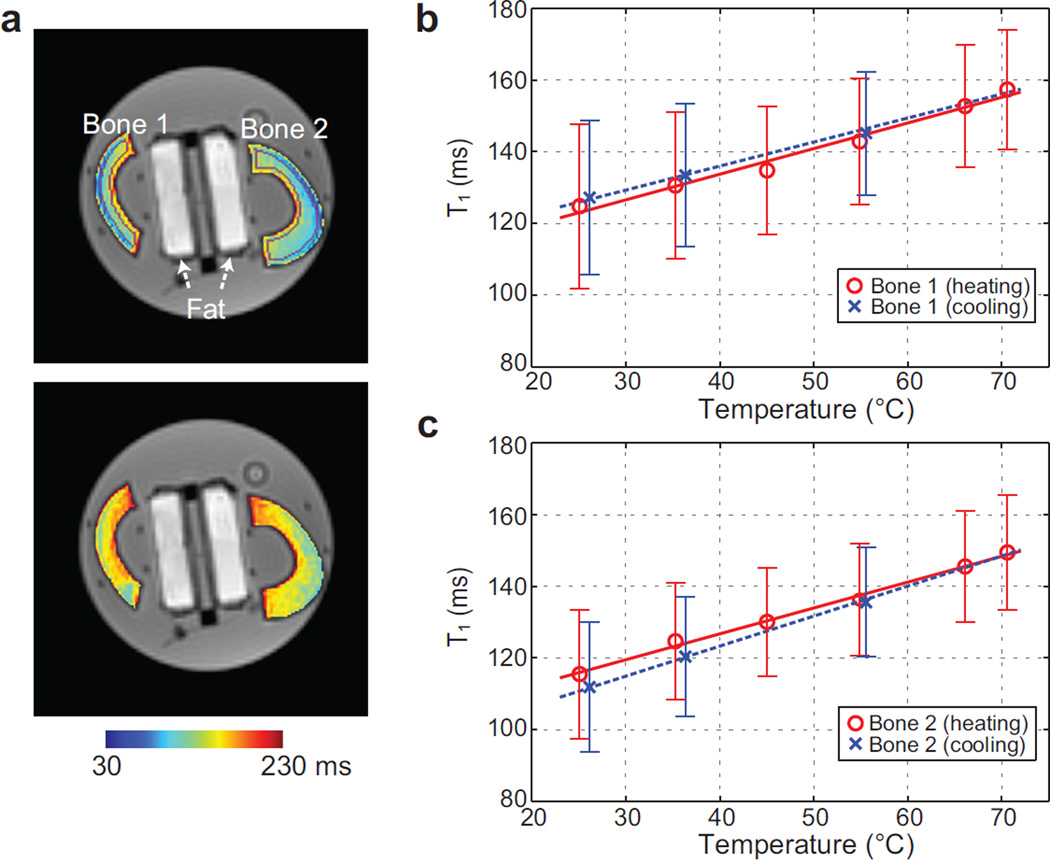
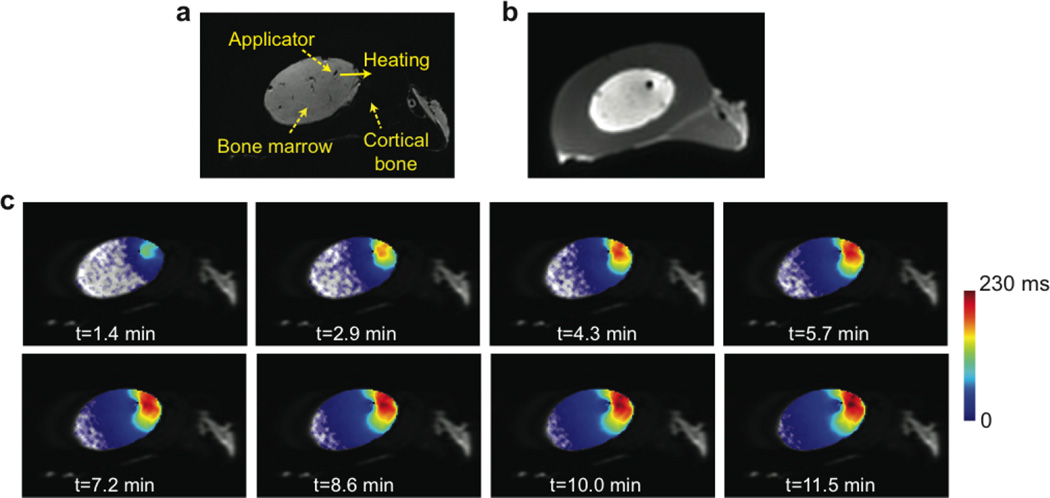
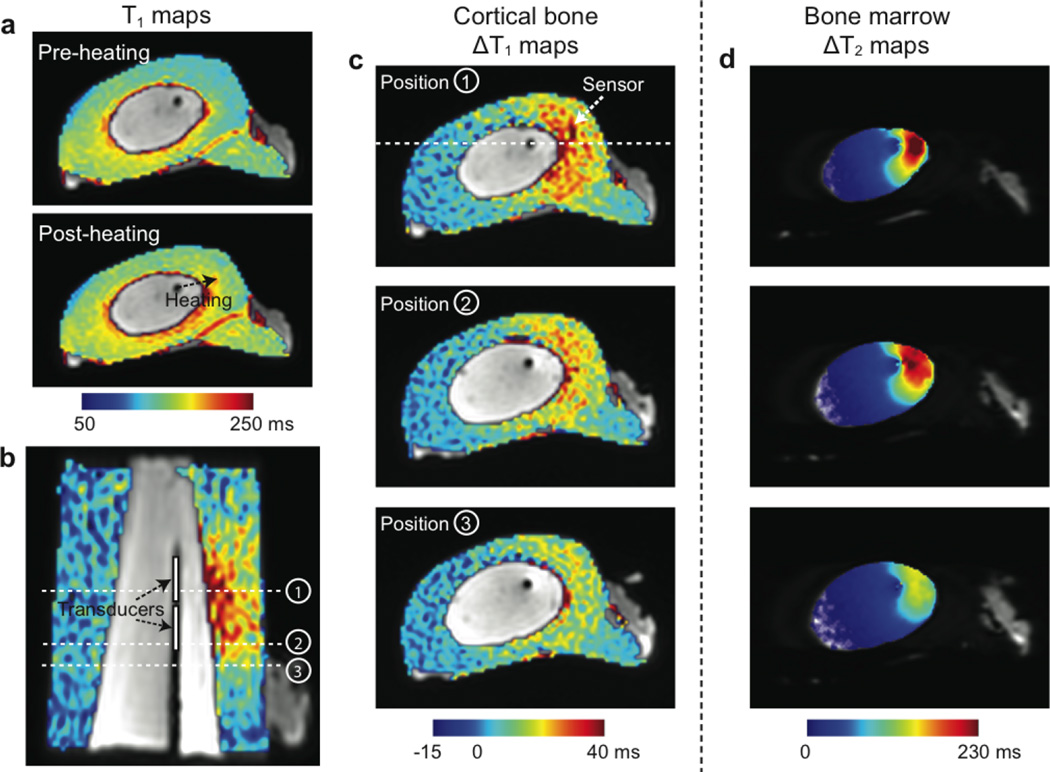
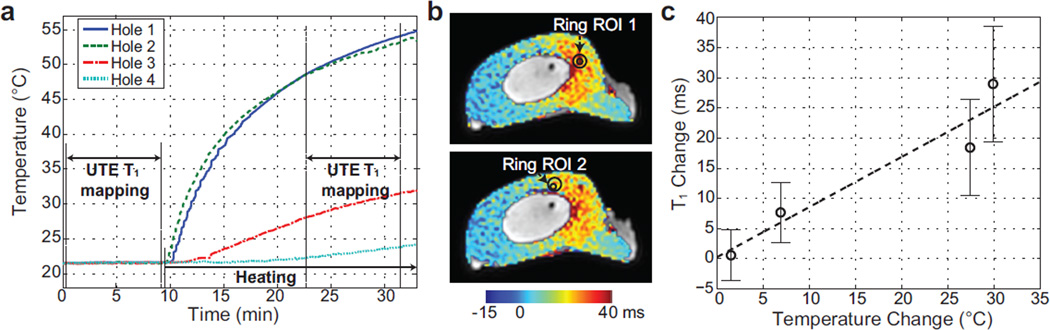
Methods: Variable flip-angle T1 mapping combined with 3D ultrashort echo-time imaging was used to measure T1 in cortical bone. A calibration experiment was performed to detect T1 changes with temperature in ex vivo cortical bone samples from a bovine femur. Ultrasound heating experiments were performed using an interstitial applicator in ex vivo bovine femur specimens, and heat-induced T1 changes were quantified.

Results: The calibration experiment demonstrated that T1 increases with temperature in cortical bone. We observed a linear relationship between temperature and T1 with a linear coefficient between 0.67 and 0.84 ms/°C over a range of 25-70°C. The ultrasound heating experiments showed increased T1 changes in the heated regions, and the relationship between the temperature changes and T1 changes was similar to that of the calibration.

Conclusion: We demonstrated a temperature dependence of T1 in ex vivo cortical bone using a variable flip-angle ultrashort echo-time T1 mapping method.

Keywords: MR temperature mapping; T1 mapping; UTE imaging; cortical bone.


Figures

Figure 1
Figure 1
Interstitial ultrasound heating experiment set-up. (a) Cross-sectional diagrams of an interstitial ultrasound applicator and temperature sensor placement in a bone segment. (b) Imaging protocols. As a reference, a plot of the expected temperature changes in a heated region is shown. To obtain a baseline, bone marrow T2 mapping and cortical bone UTE T1 mapping were performed. After starting heating, dynamic T2 mapping was performed to monitor bone marrow temperatures during the transient state. The temperature was assumed to have reached steady state 10–12 min after heating began, and UTE T1 mapping was performed again.
Figure 2
Figure 2
Calibration results. (a) Bone T1 maps at temperatures of 25°C (top) and 70°C (bottom), overlaid on UTE images at 8°. Two tubes containing fat (used for a different study) are positioned between the bone samples. ROIs automatically determined to quantify T1 in each bone sample are denoted in purple in the upper image. (b-c) The mean T1 and error bar from the volume of interest is shown over different temperatures for each bone sample. Linear regression lines during the heating and cooling periods are plotted as well. An apparent linear increase of T1 with temperature is demonstrated.
Figure 3
Figure 3
Temperature mapping during transient state. (a) Gradient-echo image with denoted applicator location and heating direction. (b) Corresponding UTE image before heating, visually delineating cortical bone. (c) Maps of T2 changes between the baseline and each time point after heating began, overlaid on FSE images. A T2 increase over time in the heated region of the bone marrow can be seen. Please note limited T2 increases near the applicator due to water cooling.
Figure 4
Figure 4
UTE T1 mapping. (a) Cortical bone T1 maps before and after heating, overlaid on the UTE images. (b-c) Maps of T1 changes between before and after heating, overlaid on the UTE images. In the coronal reformat (b), the applicator is identified as a dark line and the expected transducer positions are denoted. (c) shows T1 change maps at the three locations denoted in (b). The slice location of (b) is denoted in the image on the top. Higher T1 changes can be seen in the heated regions of cortical bone. (d) shows maps of T2 changes in bone marrow right before the acquisition of the second UTE T1 maps at the matching locations.
Figure 5
Figure 5
Temperature changes versus T1 changes. (a) Temperature measurements from the fiberoptic sensors over time. UTE T1 mapping periods are denoted. (b) T1 change maps of the slices where two temperature sensors are located and ring-shaped ROIs corresponding to the two sensors. (c) The mean T1 changes and error bars from the four ring-shaped ROIs over mean temperature changes. The linear regression line is depicted as well.

References

    1. Howlader N, Noone AM, Krapcho M, et al. SEER Cancer Statistics Review, 1975–2011. Bethesda, MD: National Cancer Institute; http://seer.cancer.gov/csr/1975_2011/, based on November 2013 SEER data submission, posted to the SEER web site, April 2014.
    1. Lipton A. Pathophysiology of bone metastases: how this knowledge may lead to therapeutic intervention. J Support Oncol. 2004;2:205–213. - PubMed
    1. Callstrom MR, Charboneau JW, Goetz MP, Rubin J, Atwell TD, Farrell MA, Welch TJ, Maus TP. Image-guided ablation of painful metastatic bone tumors: a new and effective approach to a difficult problem. Skeletal Radiol. 2006;35:1–15. - PubMed
    1. Catane R, Beck A, Inbar Y, et al. MR-guided focused ultrasound surgery (MRgFUS) for the palliation of pain in patients with bone metastases—preliminary clinical experience. Ann Oncol. 2007;18:163–167. - PubMed
    1. Liberman B, Gianfelice D, Inbar Y, et al. Pain palliation in patients with bone metastases using MR-guided focused ultrasound surgery: a multicenter study. Ann Surg Oncol. 2009;16:140–146. - PubMed

Publication types