

A systematic review of sub-microscopic Plasmodium vivax infection
- PMID: 26390924
- PMCID: PMC4578340
- DOI: 10.1186/s12936-015-0884-z
A systematic review of sub-microscopic Plasmodium vivax infection
Abstract
Background: An accurate estimate of Plasmodium vivax prevalence is essential for the successful implementation of malaria control and elimination programmes. Prevalence estimates both inform control strategies and are used in their evaluation. Light microscopy is the main method for detecting Plasmodium parasitaemia in the peripheral blood, but compared to molecular diagnostics, such as polymerase chain reaction (PCR), has limited sensitivity.
Methods: A systematic review and meta-analysis was conducted to assess the effect of detection method on the prevalence of P. vivax and to quantify the extent to which P. vivax infections are undetected by microscopy. Embase, Medline and the Cochrane Database were searched for studies reporting prevalence by PCR and by microscopy and that contained all of the following key words: vivax, PCR, and malaria. Prevalence estimates and study meta-data were extracted systematically from each publication. Combined microscopy:PCR prevalence ratios were estimated by random effects meta-analysis. Sensitivity and specificity of microscopy were calculated using PCR as the gold standard.
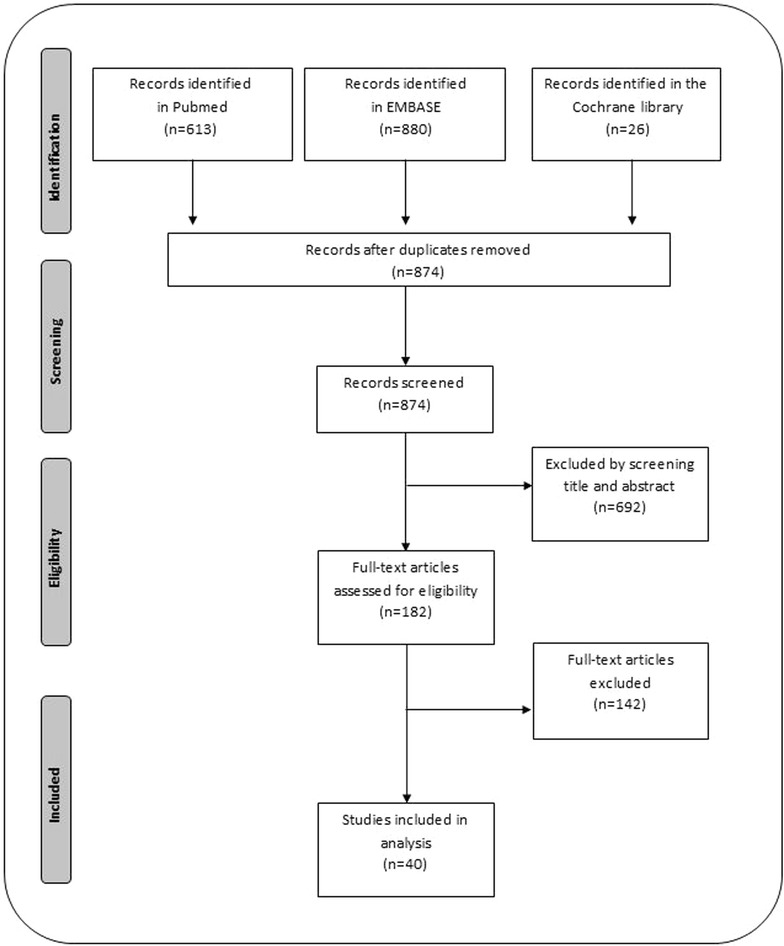
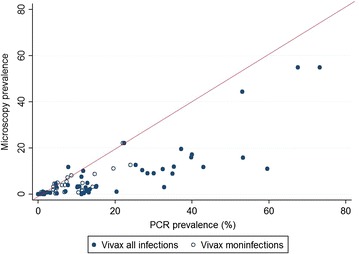
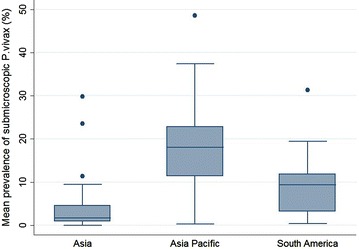
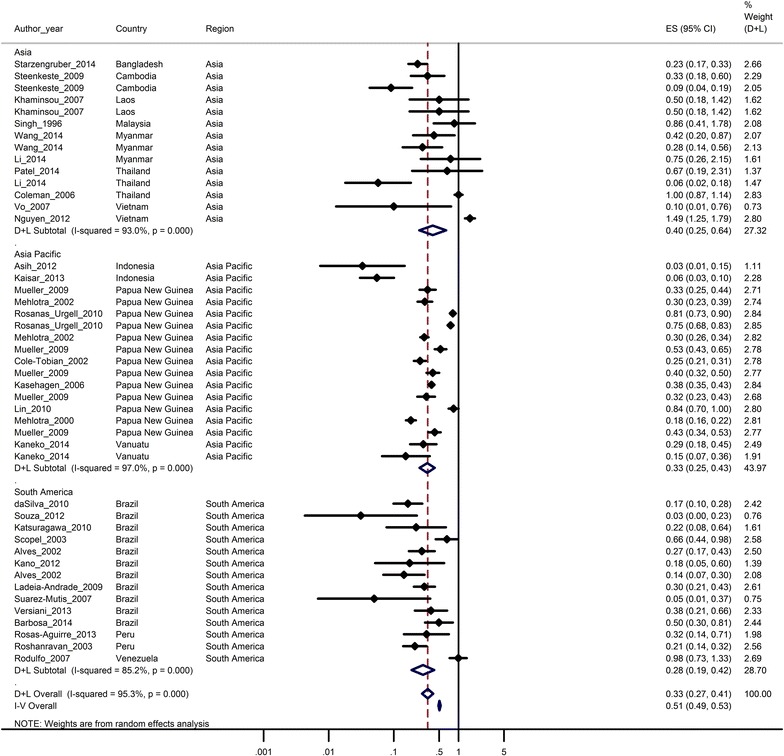
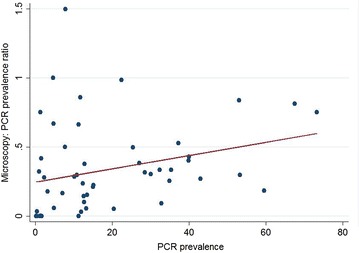
Results: Of 874 studies reviewed, 40 met the criteria for inclusion contributing 54 prevalence pairs. The prevalence of P. vivax infection measured by PCR was consistently higher than the prevalence measured by microscopy with sub-patent parasitaemia. The mean prevalence of infection detected by microscopy was 67 % (95 % CI 59-73 %) lower than the prevalence detected by PCR. The detection of sub-patent parasitaemia did not vary according to the microscopy method (thick or, thick and thin smears), the PCR prevalence (as a measure of the true P. vivax prevalence), the type of blood used or DNA extraction method.
Conclusions: Quantifying P. vivax parasitaemia by PCR rather than microscopy consistently increased prevalence estimates by a factor of 2.3. Whilst the sensitivity of microscopy can be improved by better methods, molecular methods have potential to be scaled up to improve the detection of P. vivax transmission reservoirs.
Figures
References
-
- Barcus MJ, Basri H, Picarima H, Manyakori C, Sekartuti, Elyazar I, et al. Demographic risk factors for severe and fatal vivax and falciparum malaria among hospital admissions in northeastern Indonesian Papua. Am J Trop Med Hyg. 2007;77:984–991. - PubMed
-
- WHO . World malaria report 2008. Geneva: World Health Organization; 2008.
Publication types
MeSH terms
Grants and funding
LinkOut - more resources
Full Text Sources
Other Literature Sources
Miscellaneous
