

An insula-frontostriatal network mediates flexible cognitive control by adaptively predicting changing control demands
- PMID: 26391305
- PMCID: PMC4595591
- DOI: 10.1038/ncomms9165
An insula-frontostriatal network mediates flexible cognitive control by adaptively predicting changing control demands
Abstract
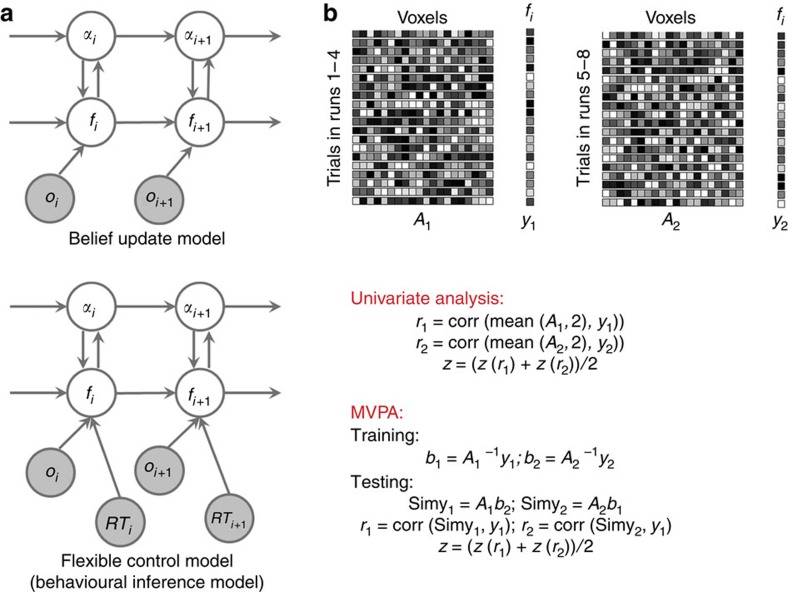
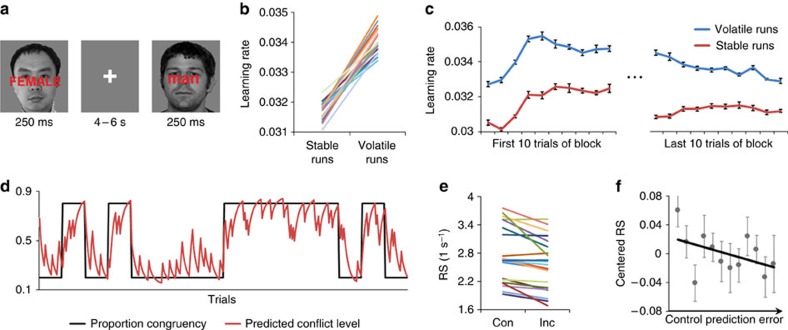
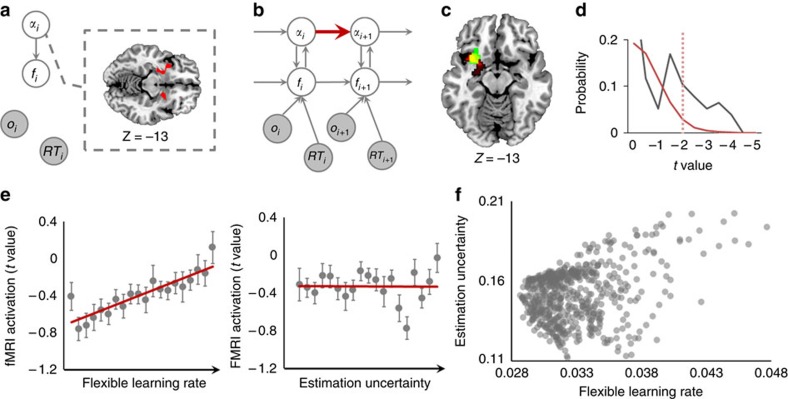
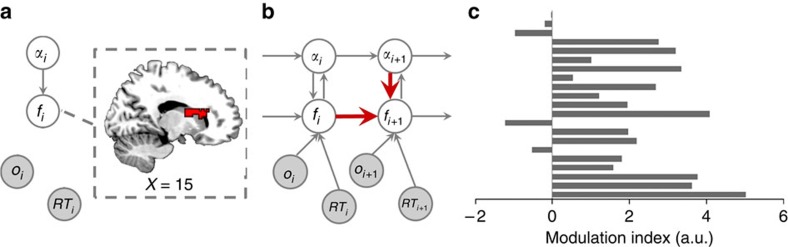
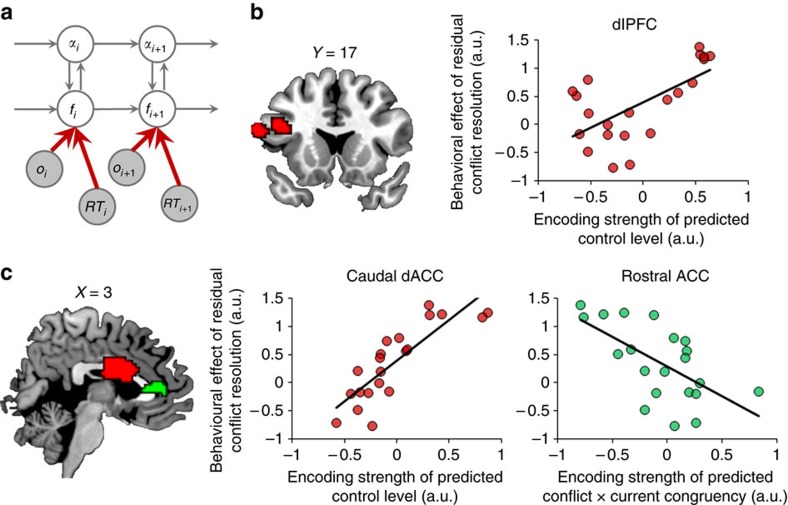
The anterior cingulate and lateral prefrontal cortices have been implicated in implementing context-appropriate attentional control, but the learning mechanisms underlying our ability to flexibly adapt the control settings to changing environments remain poorly understood. Here we show that human adjustments to varying control demands are captured by a reinforcement learner with a flexible, volatility-driven learning rate. Using model-based functional magnetic resonance imaging, we demonstrate that volatility of control demand is estimated by the anterior insula, which in turn optimizes the prediction of forthcoming demand in the caudate nucleus. The caudate's prediction of control demand subsequently guides the implementation of proactive and reactive attentional control in dorsal anterior cingulate and dorsolateral prefrontal cortices. These data enhance our understanding of the neuro-computational mechanisms of adaptive behaviour by connecting the classic cingulate-prefrontal cognitive control network to a subcortical control-learning mechanism that infers future demands by flexibly integrating remote and recent past experiences.
Figures
Similar articles
-
Causal Evidence for Learning-Dependent Frontal Lobe Contributions to Cognitive Control.J Neurosci. 2018 Jan 24;38(4):962-973. doi: 10.1523/JNEUROSCI.1467-17.2017. Epub 2017 Dec 11. J Neurosci. 2018. PMID: 29229706 Free PMC article.
-
Brain regions associated with moment-to-moment adjustments in control and stable task-set maintenance.Neuroimage. 2012 Jan 16;59(2):1960-7. doi: 10.1016/j.neuroimage.2011.09.011. Epub 2011 Sep 16. Neuroimage. 2012. PMID: 21945693
-
Effective connectivity within the frontoparietal control network differentiates cognitive control and working memory.Neuroimage. 2015 Feb 1;106:144-53. doi: 10.1016/j.neuroimage.2014.11.039. Epub 2014 Nov 22. Neuroimage. 2015. PMID: 25463464
-
Cortical and subcortical contributions to context-control learning.Neurosci Biobehav Rev. 2019 Apr;99:33-41. doi: 10.1016/j.neubiorev.2019.01.019. Epub 2019 Jan 24. Neurosci Biobehav Rev. 2019. PMID: 30685484 Free PMC article. Review.
-
[Structural and functional neuroanatomy of attention-deficit hyperactivity disorder (ADHD)].Encephale. 2009 Apr;35(2):107-14. doi: 10.1016/j.encep.2008.01.005. Epub 2008 Jul 7. Encephale. 2009. PMID: 19393378 Review. French.
Cited by
-
The unique effects of relatively recent conflict on cognitive control.J Exp Psychol Hum Percept Perform. 2020 Nov;46(11):1344-1367. doi: 10.1037/xhp0000860. Epub 2020 Aug 3. J Exp Psychol Hum Percept Perform. 2020. PMID: 32744839 Free PMC article.
-
Model-based lesion mapping of cognitive control using the Wisconsin Card Sorting Test.Nat Commun. 2019 Jan 3;10(1):20. doi: 10.1038/s41467-018-07912-5. Nat Commun. 2019. PMID: 30604744 Free PMC article.
-
Distinct but correlated latent factors support the regulation of learned conflict-control and task-switching.Cogn Psychol. 2022 Jun;135:101474. doi: 10.1016/j.cogpsych.2022.101474. Epub 2022 Apr 8. Cogn Psychol. 2022. PMID: 35405421 Free PMC article.
-
Neural Sensitivity following Stress Predicts Anhedonia Symptoms: A 2-Year Multi-wave, Longitudinal Study.Res Sq [Preprint]. 2023 Jun 17:rs.3.rs-3060116. doi: 10.21203/rs.3.rs-3060116/v1. Res Sq. 2023. Update in: Transl Psychiatry. 2024 Feb 22;14(1):106. doi: 10.1038/s41398-024-02818-x. PMID: 37398118 Free PMC article. Updated. Preprint.
-
Memory Meets Control in Hippocampal and Striatal Binding of Stimuli, Responses, and Attentional Control States.J Neurosci. 2015 Nov 4;35(44):14885-95. doi: 10.1523/JNEUROSCI.2957-15.2015. J Neurosci. 2015. PMID: 26538657 Free PMC article.
References
-
- Miller E. K. & Cohen J. D. An integrative theory of prefrontal cortex function. Annu. Rev. Neurosci. 24, 167–202 (2001). - PubMed
-
- Botvinick M. M., Braver T. S., Barch D. M., Carter C. S. & Cohen J. D. Conflict monitoring and cognitive control. Psychol. Rev. 108, 624–652 (2001). - PubMed
-
- Egner T. Congruency sequence effects and cognitive control. Cogn., Affect. Behav. Neurosci. 7, 380–390 (2007). - PubMed
-
- Gratton G., Coles M. G. & Donchin E. Optimizing the use of information: strategic control of activation of responses. J. Exp. Psychol. Gen. 121, 480–506 (1992). - PubMed
-
- Botvinick M., Nystrom L. E., Fissell K., Carter C. S. & Cohen J. D. Conflict monitoring versus selection-for-action in anterior cingulate cortex. Nature 402, 179–181 (1999). - PubMed
Publication types
MeSH terms
Grants and funding
LinkOut - more resources
Full Text Sources
Other Literature Sources
Medical
Miscellaneous
