. 2015 Sep 22:5:14218.
doi: 10.1038/srep14218.

Edges of human embryonic stem cell colonies display distinct mechanical properties and differentiation potential

Affiliations

Edges of human embryonic stem cell colonies display distinct mechanical properties and differentiation potential

Kathryn A Rosowski et al. Sci Rep. .

Abstract

In order to understand the mechanisms that guide cell fate decisions during early human development, we closely examined the differentiation process in adherent colonies of human embryonic stem cells (hESCs). Live imaging of the differentiation process reveals that cells on the outer edge of the undifferentiated colony begin to differentiate first and remain on the perimeter of the colony to eventually form a band of differentiation. Strikingly, this band is of constant width in all colonies, independent of their size. Cells at the edge of undifferentiated colonies show distinct actin organization, greater myosin activity and stronger traction forces compared to cells in the interior of the colony. Increasing the number of cells at the edge of colonies by plating small colonies can increase differentiation efficiency. Our results suggest that human developmental decisions are influenced by cellular environments and can be dictated by colony geometry of hESCs.


Conflict of interest statement

There is a potential competing interest. Dr. Horsley has been funded by and received compensation in a consulting role for Unilever and Schick.

Figures

Figure 1
Figure 1. Differentiation occurs at the edge of hESC colonies.
(A) Phase and (B) immunostaining images of hESC colonies when they are undifferentiated (top) and after 3 days BMP4 treatment (bottom). (C) Analysis of expression of pluripotency marker, SOX2, and differentiation marker, AP2α, after 3 days BMP4 treatment. Fluorescent intensity is plotted as a function of distance from the colony edge and normalized to the maximum intensity of each colony [n = 20 colonies, ****p < 0.0001 and represents statistics for AP2α (green) and SOX2 (red) levels between distance 35 μm and 175 μm from the edge using a two-tailed paired t-test]. Error bars represent S.D. from the mean. (D) The differentiation band width of hESC colonies plated on matrigel-coated glass coverslips or plastic dishes (red data points) reveals a constant average band width of differentiation of 149 μm (blue line) ± 59 μm (S.D.) (dotted cyan lines). The black line indicates a differentiation band width equal to the colony radius (n = 175 colonies). (E) The number of AP2α-positive cells quantified per circumference in a number of different colonies (red data points) shows a constant average number of cells per mm of circumference of 43 (maroon line) ± 12 cells (S.D.) (dotted magenta lines) (n = 11 colonies).
Figure 2
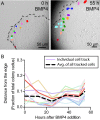
Figure 2. Differentiated cells of the hESC colony originate from the edge of the undifferentiated colony.
(A) Single frames from live DIC imaging throughout the differentiation of an hESC colony. 16 cells were traced from the 55-hour time point to their original location at the 0-hour time point. The 16 cells are marked by the same colors in the top and bottom panels. Cells that divided are indicated as multiple dots of the same color. (B) Quantification of cell movement throughout the differentiation process, as represented by relative distance from the colony edge. The colors correspond to the cells indicated in (A).
Figure 3
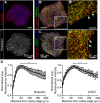
Figure 3. Cytoskeletal organization is distinct at edges of undifferentiated hESC colonies.
(A) Phalloidin staining shows actin organization of a representative undifferentiated colony. (B,C) Non-muscle myosin IIA (NMMIIA) (B) and phospho-myosin light chain (p-MLC) (C) staining of an undifferentiated colony, localized to actin with phalloidin staining. White arrows indicate strong co-localization of myosin with actin. White boxes show where (B′,C′) are located in (B–D) Quantification of phalloidin and co-localized pMLC levels throughout the colony as a function of distance from the edge. (For phalloidin, n = 38 colonies, ****p < 0.0001 and represents statistics for levels between distance 49 μm and 141 μm from the edge using a Wilcoxon signed-rank test. For p-MLC, n = 20 colonies, ****p < 0.0001 and represents statistics for levels between distance 61 μm and 141 μm from the edge using a Wilcoxon signed-rank test). Error bars indicate S.D. of the mean.
Figure 4
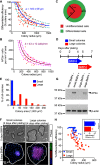
Figure 4. Cellular forces are predominantly on the edge of colonies.
(A) Representative image of an hESC colony after 3 days of BMP4 treatment, grown on PDMS of 3 KPa stiffness. Nuclei are shown by DAPI staining and differentiation at the edge shown by immunostaining against AP2α and SOX2. (B) Bar graph of average differentiation band width on PDMS substrates of different stiffnesses. Soft is measured as 3 KPa, medium is estimated to be 30 KPa and stiff to be 100 KPa. (C) The differentiation band width of hESC colonies plated on matrigel- coated 3 KPa PDMS substrates (gray), overlaid on the data points from matrigel-coated glass coverslips or plastic dishes (red, as seen in Fig. 1D). (D) DIC images (top) and corresponding strain energy densities (bottom) of two undifferentiated hESC colonies, measured by traction force microscopy. 1 pN/μm = 10−6 J/m2. (E) Quantification of localization of peak regions of strain energy hESC colonies shows maximum strain energy peaks are near the edge of the colony, generally within 50 μm. (n = 7 colonies). (F) Histogram of distance from the edge, normalized by total colony effective radius, for peaks of strain energy within the colony. The dashed vertical line indicates the effective colony center. All measured strain energy maxima are closer to the edge than to this center.
Figure 5
Figure 5. Plating hESCs in smaller colonies improves their differentiation efficiency.
(A) Differentiation efficiency after 3 days BMP4 treatment, measured by percent of colony area that is undifferentiated (n = 175 colonies). Experimental data points (red) are plotted with theoretical curves assuming a constant differentiation band width of 149 μm (blue line) ± 59 μm (S.D.) (cyan lines). (B) Differentiation efficiency, measured by the number of AP2α+ cells per colony area (n = 11 colonies). Experimental data points (red) and plotted with theoretical curves assuming a constant number of AP2α+ cells per circumference of 43 cells (maroon line) ± 12 cells (S.D.) (magenta lines). (C) Schematic of idealized circular colony with radius, R, and differentiation band width, a. If R is close to a, then the radius of the undifferentiated cells in the middle, rundiff, will be small. (D) Scheme for controling colony size through single cells. (E) Quantification of average colony size shows colonies are smaller 2–3 days after plating than 4–5 days. (F) Phase (top) and immunostaining (bottom) images of representative small (left) and large (right) colonies. After 3 days of BMP4 treatment, smaller colonies have a greater percentage of differentiated cells. (G) Representative western analysis of AP2α levels with β-actin as loading control. Smaller colonies show greater expression of AP2α compared to larger colonies. Four independent experiments were performed. (H) Quantification of differentiation efficiency, measured by percent of colony area. Smaller colonies have greater efficiency and follow a curve similar to that in panels (A) and (B). Inset: average differentiation efficiency of small (red) versus large (blue) colonies. (n = 83 colonies, ****p < 0.0001 and represents statistics using a Mann-Whitney test).

References

    1. Fox I. J. et al. Stem cell therapy. Use of differentiated pluripotent stem cells as replacement therapy for treating disease. Science (New York, N.Y.) 345, 1247391, 10.1126/science.1247391 (2014). - DOI - PMC - PubMed
    1. Xu C. et al. Feeder-free growth of undifferentiated human embryonic stem cells. Nature biotechnology 19, 971–974, 10.1038/nbt1001-971 (2001). - DOI - PubMed
    1. Xu R.-H. et al. Basic FGF and suppression of BMP signaling sustain undifferentiated proliferation of human ES cells. Nature methods 2, 185–190, 10.1038/nmeth744 (2005). - DOI - PubMed
    1. Keller G. Embryonic stem cell differentiation : emergence of a new era in biology and medicine. Genes Dev. 19, 1129–1155, 10.1101/gad.1303605 (2005). - DOI - PubMed
    1. Tadeu A. M. B. & Horsley V. Notch signaling represses p63 expression in the developing surface ectoderm. Development (Cambridge, England) 140, 3777–3786, 10.1242/dev.093948 (2013). - DOI - PMC - PubMed

Publication types

MeSH terms

LinkOut - more resources