. 2015 Sep 21:15:223.
doi: 10.1186/s12888-015-0608-5.

Occupational class differences in suicide: evidence of changes over time and during the global financial crisis in Australia

Affiliations

Occupational class differences in suicide: evidence of changes over time and during the global financial crisis in Australia

Alison J Milner et al. BMC Psychiatry. .

Abstract

Background: Previous research showed an increase in Australian suicide rates during the Global Financial Crisis (GFC). There has been no research investigating whether suicide rates by occupational class changed during the GFC. The aim of this study was to investigate whether the GFC-associated increase in suicide rates in employed Australians may have masked changes by occupational class.

Methods: Negative binomial regression models were used to investigate Rate Ratios (RRs) in suicide by occupational class. Years of the GFC (2007, 2008, 2009) were compared to the baseline years 2001-2006.

Results: There were widening disparities between a number of the lower class occupations and the highest class occupations during the years 2007, 2008, and 2009 for males, but less evidence of differences for females.

Conclusions: Occupational disparities in suicide rates widened over the GFC period. There is a need for programs to be responsive to economic downturns, and to prioritise the occupational groups most affected.


Figures
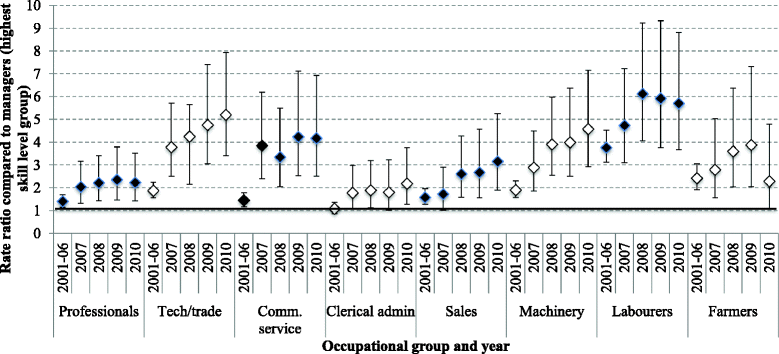
Fig. 1
Fig. 1
Rate ratios with 95 % confidence intervals comparing major occupational groups to the suicide rate in managers (the highest level group, indicated by 1 on the left hand side axis), males. Notes: Upper and lower bars = 95 % Confidence intervals (lower, upper); dot points = Rate ratios; Reference category (1 on vertical axis) = suicide rate in managers (2001–2006 = 5.83 per 100,000; 2007 = 3.24 per 100,000; 2008 = 2.20 per 100,000; 2009 = 2.50 per 100,000; 2010 = 2.34 per 100,000)
Fig. 2
Fig. 2
Rate ratios with 95 % confidence intervals comparing major occupational groups to the suicide rate in managers (the highest level group, indicated by 1 on the left hand side axis), females. Notes: Upper and lower bars = 95 % Confidence intervals (lower, upper); dot points = Rate ratios; Reference category (1 on vertical axis) = suicide rate in managers. The arrows on tech/trade represent 95 % upper CIs that are larger than 10. (2001–2006 = 2.11 per 100,000; 2007 = 1.11 per 100,000; 2008 = 1.23 per 100,000; 2009 = 1.69 per 100,000; 2010 = 1.21 per 100,000)

References

    1. Berk M, Dodd S, Henry M. The effect of macroeconomic variables on suicide. Psychol Med. 2006;36:181–9. doi: 10.1017/S0033291705006665. - DOI - PubMed
    1. Barr B, Taylor-Robinson D, Scott-Samuel A, McKee M, Stuckler D. Suicides associated with the 2008-10 economic recession in England: time trend analysis. BMJ. 2012;345 doi: 10.1136/bmj.e5142. - DOI - PMC - PubMed
    1. Chang S-S, Stuckler D, Yip P, Gunnell D. Impact of 2008 global economic crisis on suicide: time trend study in 54 countries. BMJ. 2013;347: http://dx.doi.org/10.1136/bmj.f5239. - DOI - PMC - PubMed
    1. Reeves A, Stuckler D, McKee M, Gunnell D, Chang S-S, Basu S. Increase in state suicide rates in the USA during economic recession. Lancet. 2012;380:1813–4. doi: 10.1016/S0140-6736(12)61910-2. - DOI - PubMed
    1. Stuckler D, Basu S, Suhrcke M, Coutts A, McKee M. Effects of the 2008 recession on health: a first look at European data. Lancet. 2011;378:124–5. doi: 10.1016/S0140-6736(11)61079-9. - DOI - PubMed

Publication types