. 2015 Sep 22:6:8282.
doi: 10.1038/ncomms9282.

Role of T-cell reconstitution in HIV-1 antiretroviral therapy-induced bone loss

Affiliations

Role of T-cell reconstitution in HIV-1 antiretroviral therapy-induced bone loss

Ighovwerha Ofotokun et al. Nat Commun. .

Abstract

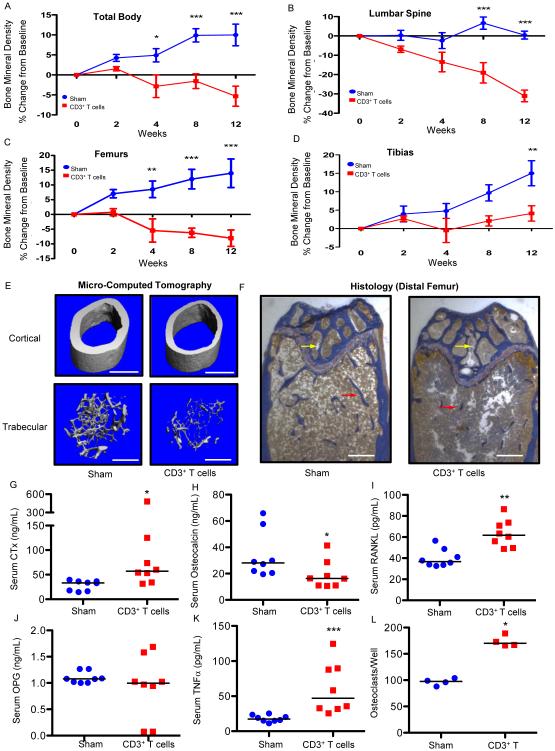
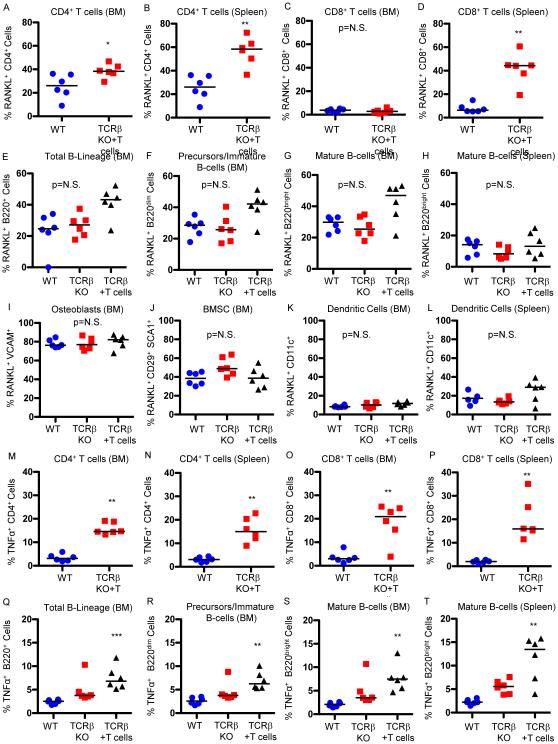
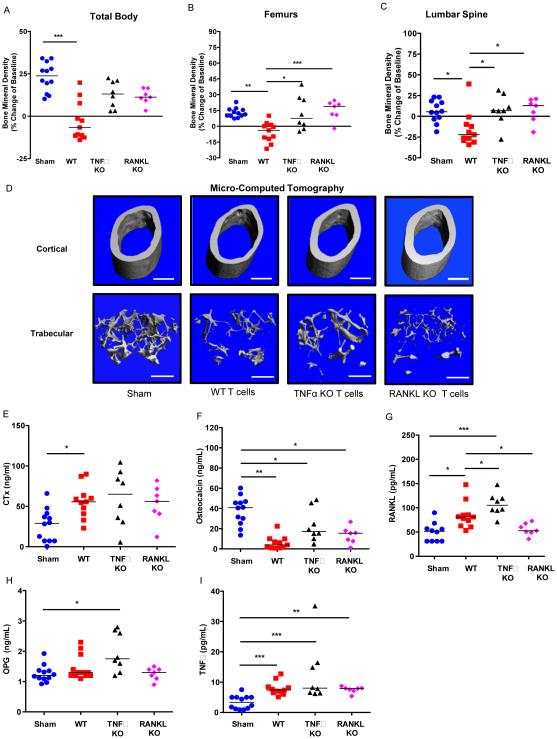
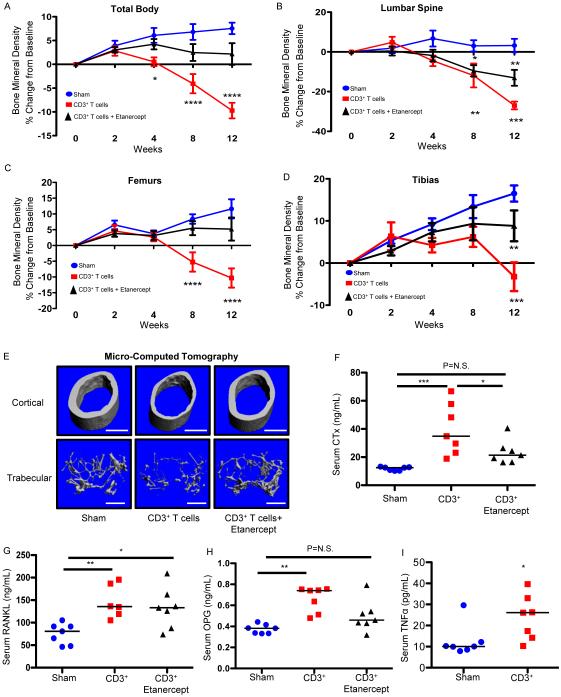
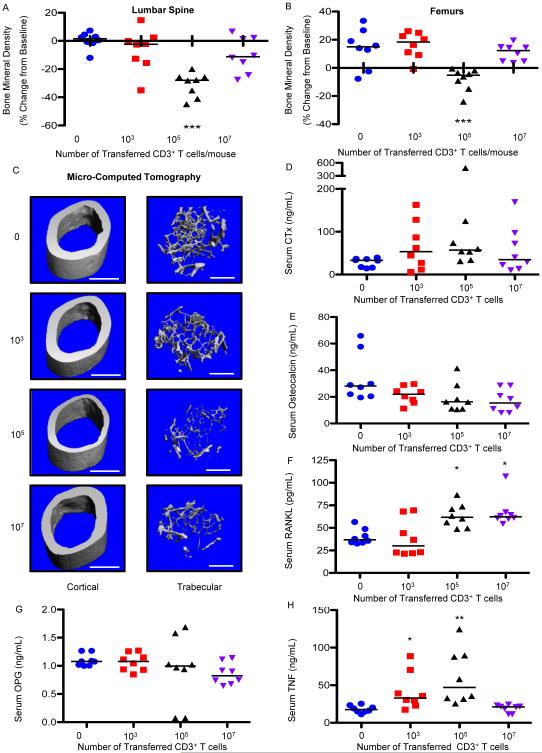
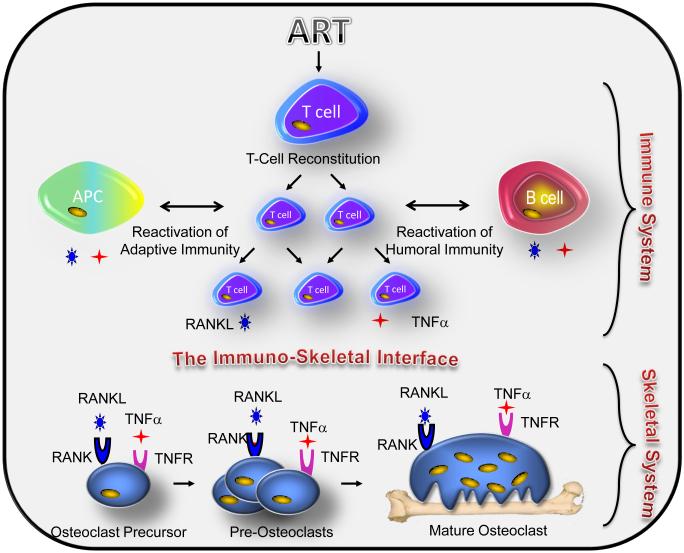
HIV infection causes bone loss. We previously reported that immunosuppression-mediated B-cell production of receptor activator of NF-κB ligand (RANKL) coupled with decline in osteoprotegerin correlate with decreased bone mineral density (BMD) in untreated HIV infection. Paradoxically, antiretroviral therapy (ART) worsens bone loss although existing data suggest that such loss is largely independent of specific antiretroviral regimen. This led us to hypothesize that skeletal deterioration following HIV disease reversal with ART may be related to T-cell repopulation and/or immune reconstitution. Here we transplant T cells into immunocompromised mice to mimic ART-induced T-cell expansion. T-cell reconstitution elicits RANKL and TNFα production by B cells and/or T cells, accompanied by enhanced bone resorption and BMD loss. Reconstitution of TNFα- or RANKL-null T-cells and pharmacological TNFα antagonist all protect cortical, but not trabecular bone, revealing complex effects of T-cell reconstitution on bone turnover. These findings suggest T-cell repopulation and/or immune reconstitution as putative mechanisms for bone loss following ART initiation.


Figures

Figure 1
Figure 1. T cell reconstitution induces bone turnover and loss of BMD and bone structure in TCRβ KO mice
BMD (% change from baseline) was quantified by DXA prospectively at baseline, 2, 4, 8 and 12 weeks following T cell (1 × 10⁵ CD3+ T cells) transplant or vehicle injection (sham) at (A) total body, (B) lumbar spine, (C) femurs and (D) tibias. Data expressed as mean ± SEM, *p<0.05, **p<0.01, ***p<0.001, 2-Way ANOVA with Bonferroni post-test (n=8 mice per group). At 12 weeks the following cross sectional endpoints were analyzed: (E) micro-computed tomography of representative femoral cortical (upper panels) and trabecular (lower panels) high resolution (6 μm) 3D reconstructions. White bar represents 500 μm. (F) Histological sections of distal femur from sham and CD3+ T cell reconstituted mice. Mineralized bone stains blue (red arrows indicate trabeculae in the metaphysis and yellow arrows in the epiphysis). White bar represents 200 μm. Serum ELISAs were used to quantify: (G) CTx, (H) osteocalcin, (I) RANKL, (J) OPG, (K) TNFα. Data points represent individual animals with median (black line), n= 8 mice per group. *P<0.05, **P<0.01 or ***P<0.001 by Mann-Whitney test. (L) In vitro osteoclastogenesis assay. TRAP+ multinucleated (≥ 3 nuclei) cells were generated from bone marrow from 4 individual mice per group with 5 wells per mouse averaged per data point. Data representative of 2 independent experiments and presented as individual wells with median (black line). *P<0.05 by Mann-Whitney test.
Figure 2
Figure 2. Proportion of immune cells producing RANKL and TNFα following T cell reconstitution
Expression of RANKL was quantified by flow cytometry in WT control mice and TCRβ KO mice 1 week following reconstitution with 1 × 10⁵ CD3+ T cells (TCRβ+T cells) in: (A) BM CD4+ T cells; spleen CD4+ T cells; (C) BM CD8+ T cells and (D) spleen CD8+ T cells. Expression of RANKL was further quantified in: (E) total BM B-lineage; (F) BM immature B cells and B cell precursors; (G) mature BM B cells; (H) mature B cells in spleen; (I) osteoblasts: (J) BM stromal cells (BMSC); (K) BM dendritic cells and (L) splenic dendritic cells. Expression of TNFα was quantified by flow cytometry in WT control mice and TCRβ KO mice 1 week after reconstitution with T cells (TCRβ+T cells) in: (M) BM CD4+ T cells; (N) spleen CD4+ T cells; (O) BM CD8+ T cells and (P) spleen CD8+ T cells. Expression of TNFα was further quantified in: (Q) total BM B-lineage; (R) BM immature B cells and B cell precursors; (S) mature BM B cells; (T) mature B cells in spleen. Data points represent individual animals with median (black line), n=6 independent mice per group. *p<0.05, **p<0.01, ***p<0.001, ****p<0.0001 by Kruskal-Wallis 1-way ANOVA with Dunn's Multiple Comparison post-test for 3 groups or Mann-Whitney for simple comparisons between two groups.
Figure 3
Figure 3. Reconstitution of TCRβ KO mice with TNFα KO T cells or RANKL KO T cells blunts cortical but not trabecular bone loss
T cell adoptive transfer was performed by transplanting 1 × 10⁵ WT CD3+ T cells, 1 × 10⁵ TNFα KO CD3+ T cells or 1 × 10⁵ RANKL KO CD3+ T cells into TCRβ KO mice. BMD was quantified by DXA at baseline and 12 weeks following T cell transplant at: (A) total body, (B) femurs and (C) lumbar spine. Cross sectional endpoints were analyzed at 12 weeks after transfer for: (D) micro-computed tomography of representative cortical (left panels) and trabecular (right panels) high resolution (6 μm) 3D reconstructions of femurs. White bar represents 500 μm. Serum ELISAs were used to quantify: (E) CTx, (F) osteocalcin, (G) RANKL, and (H) OPG and (I) TNFα. Data points represent individual animals with median (black line), *p<0.05, **p<0.01, ***p<0.001 by Kruskal-Wallis 1-way ANOVA with Dunn's Multiple Comparison post-test (n=12 sham, 11 WT, 8 TNFα KO and 7 RANKL KO mice per group).
Figure 4
Figure 4. Pharmacological TNFα ablation blunts cortical but not trabecular bone loss caused by T cell reconstitution
TCRβ KO mice were treated with Etanercept, a TNFα decoy receptor, after adoptive transfer of 1 × 10⁵ WT CD3+ T cells. BMD (% change from baseline) was quantified by DXA prospectively at baseline, 2, 4, 8 and 12 weeks following T cell (CD3+ T cells) transplant or vehicle injection (sham) at (A) total body, (B) lumbar spine, (C) femurs and (D) tibias. Data expressed as mean ± SEM, *p<0.05, **p<0.01, ***p<0.001, ****p<0.0001 compared to sham by 2-Way ANOVA with Bonferroni post-test (n=8 mice per group). Cross sectional endpoints were analyzed at 12 weeks after transplant for: (E) micro-computed tomography. Representative cortical (upper panels) and trabecular (lower panels) high-resolution (6 μm) 3D reconstructions of femurs from T cell reconstituted mice, with or without Etanercept at 12 weeks. White bar represents 500 μm. Serum ELISAs were used to quantify: (F) CTx, (H) osteocalcin, (G) RANKL, and (H) OPG and (I) TNFα. Data points represent individual animals with median (black line), *p<0.05, **p<0.01, ***p<0.001 by Kruskal-Wallis 1-way ANOVA with Dunn's Multiple Comparison post-test (n=7 mice per group).
Figure 5
Figure 5. Starting T cell number impacts the magnitude of bone loss in trabecular and cortical bone compartments
T cell adoptive transfer dose response was performed by transplanting (0, 1 × 10³, 1 × 10⁵ or 1 × 10⁷) WT CD3+ T cells into TCRβ KO mice. BMD was quantified by DXA at baseline and 12 weeks following T cell transplant at (A) lumbar spine, and (B) femurs. Cross sectional endpoints were analyzed at 12 weeks after transplant for: (C) micro-computed tomography or representative cortical (upper panels) and trabecular (lower panels) high resolution (6 μm) 3D reconstructions of femurs from T cell reconstituted mice at 12 weeks. White bar represents 500 μm. Serum ELISAs were used to quantify: (D) CTx, (E) osteocalcin, (F) RANKL, (G) OPG, and TNFα (H). Data points represent individual animals with median (black line), *p<0.05, **p<0.01, ***p<0.001 compared to control (0 T cells) by Kruskal-Wallis 1-way ANOVA with Dunn's Multiple Comparison post-test (n=8 mice per group).
Figure 6
Figure 6. Proposed model of ART-induced bone loss
ART-induced T cell restoration and/or immune reactivation (T cell/antigen presenting cell (APC) activity and/or T cell/humoral immunity) leads to osteoclastogenic cytokine production including RANKL and TNFa by T cells and B cells and TNFα by monocytes. These cytokines of immune origin distort the immuno-skeletal interface impacting the skeletal system as RANKL binds to its receptor RANK or osteoclast precursors causing them to differentiate into pre-osteoclasts that fuse into giant multinucleated mature bone resorbing osteoclasts. The association of TNFα with its receptors on osteoclast lineage cells may further synergize with RANKL signal transduction, thus amplifying osteoclast formation and driving up bone resorption leading to bone loss.

Comment in

References

    1. Tebas P, et al. Accelerated bone mineral loss in HIV-infected patients receiving potent antiretroviral therapy. AIDS. 2000;14:F63–67. - PMC - PubMed
    1. Thomas J, Doherty SM. HIV infection--a risk factor for osteoporosis. J Acquir Immune Defic Syndr. 2003;33:281–291. - PubMed
    1. Ofotokun I, Weitzmann MN. HIV-1 infection and antiretroviral therapies: risk factors for osteoporosis and bone fracture. Curr Opin Endocrinol Diabetes Obes. 2010;17:523–529. - PMC - PubMed
    1. Stone B, Dockrell D, Bowman C, McCloskey E. HIV and bone disease. Arch Biochem Biophys. 2010;503:66–77. - PubMed
    1. Arora S, et al. HIV and bone loss. Curr Osteoporos Rep. 2010;8:219–226. - PubMed

Publication types

Substances