. 2015 Oct 19;212(11):1851-68.
doi: 10.1084/jem.20150632. Epub 2015 Sep 21.

Critical role of phospholipase A2 group IID in age-related susceptibility to severe acute respiratory syndrome-CoV infection

Affiliations

Critical role of phospholipase A2 group IID in age-related susceptibility to severe acute respiratory syndrome-CoV infection

Rahul Vijay et al. J Exp Med. .

Abstract

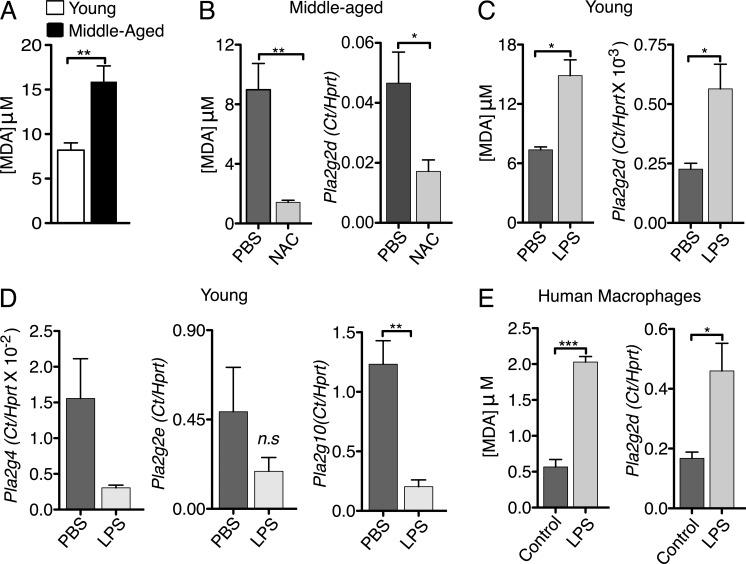
Oxidative stress and chronic low-grade inflammation in the lungs are associated with aging and may contribute to age-related immune dysfunction. To maintain lung homeostasis, chronic inflammation is countered by enhanced expression of proresolving/antiinflammatory factors. Here, we show that age-dependent increases of one such factor in the lungs, a phospholipase A2 (PLA2) group IID (PLA2G2D) with antiinflammatory properties, contributed to worse outcomes in mice infected with severe acute respiratory syndrome-coronavirus (SARS-CoV). Strikingly, infection of mice lacking PLA2G2D expression (Pla2g2d(-/-) mice) converted a uniformly lethal infection to a nonlethal one (>80% survival), subsequent to development of enhanced respiratory DC migration to the draining lymph nodes, augmented antivirus T cell responses, and diminished lung damage. We also observed similar effects in influenza A virus-infected middle-aged Pla2g2d(-/-) mice. Furthermore, oxidative stress, probably via lipid peroxidation, was found to induce PLA2G2D expression in mice and in human monocyte-derived macrophages. Thus, our results suggest that directed inhibition of a single inducible phospholipase, PLA2G2D, in the lungs of older patients with severe respiratory infections is potentially an attractive therapeutic intervention to restore immune function.


Figures

Figure 1.
Figure 1.
Differential gene expression in pulmonary CD11c+ cells from middle-aged and young mice. (A) Lungs from naive young (6–8 wk) and middle-aged (10–13 mo) C57BL/6 mice were analyzed for PGD2 expression by LC/MS analysis. Mean ± SEM; two independent experiments, five mice/group. *, P < 0.05, unpaired Student’s t test. (B) Heat map depicting differential gene expression in pulmonary CD11c+ cells from young and middle-aged mice. (C and D) Heat map and table depicting differential expression of genes involved in AA metabolism in pulmonary CD11c+ cells. Table shows step-up p-value (after correcting for multiple comparisons), fold change, and mean expression values of different genes (n = 4/group).
Figure 2.
Figure 2.
PLA2G2D expression in CD11c cells in the lungs and MLN of middle-aged mice. (A) PLA2G2D mRNA levels in CD11c and CD11c+ cells from the lungs of young and middle-aged mice. CD11c+ and CD11c cells were prepared from the lungs of naive young or middle–aged mice using CD11c magnetic beads and analyzed for PLA2G2D mRNA levels using qPCR. Mean ± SEM; two independent experiments, eight mice/group. ***, P < 0.001, unpaired Student’s t test. (B) Representative histograms comparing the mean fluorescent intensity of PLA2G2D expression in CD11c and CD11c+ cells (gated on CD45+ cells) of young and middle aged mice (left). Summary data are shown on right. Single-cell suspension from the lungs of naive young and middle-aged mice were stained for PLA2G2D and analyzed by flow cytometry as described in the Materials and methods. Mean ± SEM; three independent experiments, four mice/group. *, P < 0.05; **, P < 0.01; ***, P < 0.001, unpaired Student’s t test. (C) Frequency of CD11c+ cells (gated on CD45+) expressing PLA2G2D in the lungs of naive young and middle aged mice. The boxed area in the flow cytometry plots indicates cell populations staining positive for PLA2G2D. Mean ± SEM; three independent experiments, four mice/group. *, P < 0.05, unpaired Student’s t test. (D) Frequency and total number of FoxP3+ CD4+ T reg cells (gated on CD3+CD8). Mean ± SEM; two independent experiments, four mice/group. **, P < 0.01, unpaired Student’s t test. (E) PLA2G2D expression in absence of CD4 T cells. (left) Extent of depletion of CD4 T cells on day 4 after GK1.5 treatment; (right) mRNA expression of PLA2G2D in the lungs of treated (GK1.5) and control groups. CD4 T cells were depleted using mAb GK1.5, delivered i.p. at 0.5 mg/mouse on day 0 and 2. 2 d later, lungs were harvested into TRIzol for quantifying PLA2G2D RNA levels. PBS was administered to control mice. Mean ± SEM; two independent experiments, four mice/group. n.s., not significant, unpaired Student’s t test. (F) CD11c+ and CD11c cells were harvested from the MLN of naive young and middle-aged mice. PLA2G2D mRNA levels were determined using qPCR. Mean ± SEM; two independent experiments, four mice/group. n.s., not significant; ***, P < 0.001, unpaired Student’s t test.
Figure 3.
Figure 3.
Age-dependent changes in the AA cascade in the lung. Young, middle-aged, and aged (22 mo) C57BL/6 mice were analyzed for mRNA expression levels of several enzymes in the AA pathway. (A) PLA2G2D mRNA levels in the lungs. Mean ± SEM; two independent experiments, four mice/group. *, P < 0.05; **, P < 0.01; ***,P < 0.001, unpaired Student’s t test. (B) mRNA levels of other phospholipases. Mean ± SEM; two independent experiments, four mice/group, unpaired Student’s t test. (C) cyclooxygenases and hematopoietic PGD2 synthase (HPGDS) in the lungs. Mean ± SEM; two independent experiments, four mice/group. *, P < 0.05, unpaired Student’s t test. All gene expression data are normalized to Hprt expression.
Figure 4.
Figure 4.
PLA2G2D-dependent alteration of lipid profile in the lungs. Naive young and middle-aged C57BL/6 mice (B–D) and Pla2g2d−/− and Pla2g2d+/+ mice (E–J) were analyzed for pulmonary lipids using ESI-MS as described in Materials and methods. (A) The elution of different endogenous lipids with respect to exogenous standards (SD) is indicated. Retention times and parent m/z to daughter m/s transition are also shown. Levels of (B) free PUFAs, AA, DHA and EPA. Mean ± SEM; three independent experiments, four mice/group. n.s., not significant; *, P < 0.05, unpaired Student’s t test. (C) 6ketoPGF, TXB2, and PGF. Mean ± SEM; three independent experiments, four mice/group. n.s., not significant; *, P < 0.05, unpaired Student’s t test. (D) PGE2 and PGD2 in lungs of young and middle-aged C57BL/6 mice are shown. Mean ± SEM; three independent experiments, four mice/group. n.s., not significant; *, P < 0.05, unpaired Student’s t test. (E) Levels of free PUFAs. Mean ± SEM; two independent experiments, four mice/group, unpaired Student’s t test. (F) 6-keto-PGF, TXB2, and PGF. Mean ± SEM; two independent experiments, four mice/group, unpaired Student’s t test. (G) PGE2 and PGD2 in lungs of young Pla2g2d−/− and Pla2g2d+/+ mice. Mean ± SEM; two independent experiments, four mice/group, unpaired Student’s t test. (H) Levels of free PUFAs. Mean ± SEM; two independent experiments, four mice/group, unpaired Student’s t test. (I) 6-keto-PGF, TXB2, and PGF. Mean ± SEM; two independent experiments, four mice/group, unpaired Student’s t test. (J) PGE2 and PGD2 in lungs of middle-aged Pla2g2d−/− and Pla2g2d+/+ mice. Mean ± SEM; two independent experiments, four mice/group. *, P < 0.05; **, P < 0.01; ***, P < 0.001, unpaired Student’s t test.
Figure 5.
Figure 5.
PLA2G2D-dependent up-regulation of PGD2 and other lipid mediators after SARS-CoV infection. (A) Survival of young and middle-aged C57BL/6 mice after i.n. challenge with 104 PFU of SARS-CoV (two independent experiments, five mice/group). Naive or infected young and middle aged C57BL/6 mice (B–E) or middle-aged Pla2g2d−/− and Pla2g2d+/+ mice (F–H) were analyzed for mRNA expression levels of PLA2G2D in and lipid expression in the lungs using qPCR and ESI-MS, respectively, as described in Materials and methods. (B) mRNA levels of PLA2G2D in the lungs of young and middle-aged mice before (light green) and 4 d p.i. (dark green), expressed relative to Hprt. Mean ± SEM; two independent experiments, four mice/group. *, P < 0.05; ***, P < 0.001, unpaired Student’s t test. Comparison of levels in the lungs of young and middle-aged mice of (C) free PUFAs, AA, DHA, and EPA. Mean ± SEM; two independent experiments, four mice/group. #, P = 0.07; **, P < 0.01; ***, P < 0.001, unpaired Student’s t test. (D) 6ketoPGF, TXB2, and PGF. Mean ± SEM; three independent experiments, four mice/group. **, P < 0.01; ***, P < 0.001, unpaired Student’s t test. (E) PGE2 and PGD2 before and 4 d p.i. Mean ± SEM; three independent experiments, four mice/group. *, P < 0.05; **, P < 0.05; ***, P < 0.001, unpaired Student’s t test. Comparison of levels in the lungs of middle-aged Pla2g2d−/− and Pla2g2d+/+ mice of (F) free PUFAs. Mean ± SEM; two independent experiments, five mice/group. n.s., not significant; *, P < 0.05; **, P < 0.01; ***, P < 0.001 (unpaired Student’s t test). (G) 6ketoPGF, TXB2, and PGF. Mean ± SEM; two independent experiments, five mice/group. n.s., not significant; **, P < 0.01; ***, P < 0.001, unpaired Student’s t test. (H) PGE2 and PGD2 before and 4 d p.i. Mean ± SEM; two independent experiments, five mice/group. n.s., not significant; *, P < 0.05; **, P < 0.01; ***, P < 0.001 (unpaired Student’s t test). All lipid concentrations are expressed as nanogram/milligram lung tissue.
Figure 6.
Figure 6.
rDC activation and function in young and aged mice or Pla2g2d−/− and Pla2g2d+/+ mice. Young and middle-aged C57BL/6 mice (A and B) or middle-aged Pla2g2d−/− or Pla2g2d+/+ mice (C–E, G, and H) were infected with 104 PFU SARS-CoV and analyzed for activation status, and functionality of pulmonary CD11c+ cells after TLR stimulation. (A) Expression of activation markers CD40 (top row), CD80 (middle row), and MHCII (bottom row) on lung CD11c+ from young and middle-aged C57BL/6 mice. Representative histograms and summary bar graphs are shown. Mean ± SEM; two independent experiments, four mice/group. **, P < 0.01; ***, P < 0.001, unpaired Student’s t test. (B) TNF production after vehicle (RP10, top row), LPS (middle row), or poly I:C (bottom row) stimulation is shown. Mean ± SEM; two independent experiments, four mice/group. n.s., not significant. **, P < 0.01; ***, P < 0.001, unpaired Student’s t test. (C) Expression of activation markers CD40 (top row), CD80 (middle row), and MHCII (bottom row) on lung CD11c+ from middle-aged Pla2g2d−/− or Pla2g2d+/+ mice. Representative histograms and summary bar graphs are shown. Mean ± SEM; two independent experiments, four mice/group. n.s., not significant; **, P < 0.01, unpaired Student’s t test. (D) TNF production after vehicle (RP10, top row), LPS (middle row), or poly I:C (bottom row) stimulation. Mean ± SEM; two independent experiments, four mice/group. n.s., not significant; ***, P < 0.001, unpaired Student’s t test. (E) mRNA expression levels of proinflammatory cytokines, TLR3 and TLR4 in the lungs of middle-aged Pla2g2d−/− or Pla2g2d+/+ mice on day 1 (left panel) and day 4 p.i. (right panel) Mean ± SEM; two independent experiments, four mice/group, unpaired Student’s t test. N.D., not detected. (F) Naive middle-aged Pla2g2d−/− or Pla2g2d+/+ mice were intranasally inoculated with 200 µg/75 µl OVA-FITC. 18 h later, MLNs were harvested and analyzed. Mean ± SEM; two independent experiments, four mice/group. *, P < 0.05; **, P < 0.01, unpaired Student’s t test. (G) Frequency and number of airway DCs (CD11c+MHCII+CFSE+) that migrated from the lung to MLN, 18 h after SARS-CoV infection. 50 µl of 8 µM CFSE was instilled intranasally 6 h before infection. At 18 h p.i., MLNs were harvested and analyzed. Gated on CD45+CD11c+MHCII+CFSE+ cells Mean ± SEM; three independent experiments, four mice/group. **, P < 0.01, unpaired Student’s t test. (H) MFI of CCR7 expression on rDCs in lungs (gated on CD45+CD11c+MHCII+CFSE+) 18 h p.i. Mean ± SEM; two independent experiments, four mice/group. *, P < 0.05, unpaired Student’s t test.
Figure 7.
Figure 7.
PLA2G2D dampening of the anti–SARS-CoV T cell response. SARS-CoV–infected middle-aged Pla2g2d−/− or Pla2g2d+/+ mice were analyzed for quantity and quality T cell responses in the lungs, as described in Materials and methods. (A) Representative flow plots showing frequency of virus-specific CD8 (S525 specific) and CD4 (N110 specific) T cell responses on day 6 after infection with 104 PFU SARS-CoV. Summary data for frequency and total number of virus-specific T cells are shown in the bar graphs. Mean ± SEM; of two independent experiments, five mice/group. **, P < 0.01; ***, P < 0.001, unpaired Student’s t test. (B) Amount of IFN-γ produced on a per cell basis by CD8 T cells is depicted as MFI. Mean ± SEM; of two independent experiments, five mice/group. *, P < 0.05, unpaired Student’s t test. (C) Representative data showing proportion of virus-specific T cells in the lungs expressing IFN-γ alone or IFN-γ and TNF. Mean ± SEM; of two independent experiments, five mice/group, unpaired Student’s t test. (D) In vivo cytotoxicity was assessed on day 6 p.i and the percentage killing was determined as described in Materials and methods. Data show killing of target cells in the lungs of Pla2g2d−/− or Pla2g2d+/+ mice. Mean ± SEM; three independent experiments, five mice/group. ***, P < 0.001 (unpaired Student’s t test). (E) Representative flow plots of virus-specific T cell responses in recipient Pla2g2d−/− or Pla2g2d+/+ mice and summary data are shown. Mean ± SEM; two independent experiments with six mice/group. ***, P < 0.001 (unpaired Student’s t test).
Figure 8.
Figure 8.
Pla2g2d−/− mice are protected from SARS-CoV infection. Middle-aged Pla2g2d−/− or Pla2g2d+/+ mice were infected with 104 PFU of SARS-CoV i.n. (A) Mice were monitored daily for survival. Data are representative of two independent experiments, seven mice/group. P < 0.001 (Kaplan-Meier log-rank survival tests). (B) Viral titers in the lungs of Pla2g2d−/− and Pla2g2d+/+ mice at days 1, 4, and 6 p.i. are shown. Mean ± SEM; two independent experiments, seven mice/group. **, P < 0.01 (unpaired Student’s t test). (C) Lung sections from Pla2g2d−/− and Pla2g2d+/+ mice on day 6 p.i. were analyzed for pathological changes. Infiltrating cells (black arrows) and edema (asterisks) are shown. Histological changes were scored for inflammation and edema as described in Materials and methods. Mean ± SEM; two independent experiments, with three to five mice per group. *, P < 0.05; **, P < 0.01. Bars: (10×) 300 µm; (40×) 70 µm.
Figure 9.
Figure 9.
PLA2G2D dampening of the anti-IAV T cell response. Middle-aged Pla2g2d−/− or Pla2g2d+/+ mice were infected with 1020 tissue culture infectious units of IAV (PR8 strain) and analyzed for differences in rDC migration, CD8 T cell response in lungs, and survival. (A) Flow plots and frequency (left bar graph) and number (right bar graph) of airway DCs (CD11c+MHCII+CFSE+) that migrated from the lung to MLN, 18 h after IAV infection. Mean ± SEM; two independent experiments, four mice/group. **, P < 0.01, unpaired Student’s t test. (B) Flow plots and summary data indicate the frequency and numbers of Db/PA224 tetramer+ CD8 T cells at 10 d p.i. Mean ± SEM; two independent experiments, four mice/group. *, P < 0.05; **, P < 0.01, unpaired Student’s t test. (C) Percentage survival. Data are representative of two independent experiments, six mice/group. n.s., not significant (Kaplan-Meier log-rank survival tests).
Figure 10.
Figure 10.
Oxidative stress induces expression of PLA2G2D. A TBARS assay was used to measure lung MDA concentrations as a measure of oxidative stress in mouse lungs and human MDMs. (A) MDA concentration in the lungs of naive young and middle-aged mice. Mean ± SEM; two independent experiments, four mice/group. **, P < 0.01, unpaired Student’s t test. (B) CD11c+ cells from the lungs of naive middle-aged mice that were treated with NAC or PBS (control) i.n. for 10 d, were separated using magnetic beads and expression of PLA2G2D was determined by qPCR and lung MDA concentrations were measured by TBARS assay. Mean ± SEM; two independent experiments, four mice/group. *, P < 0.05; **, P < 0.01 (unpaired Student’s t test). (C and D) CD11c+ cells from the lungs of naive young mice that were treated with low doses of LPS or PBS (control) i.n. for 7 d were separated using magnetic beads. Expression of PLA2G2D (C) and other PLA2s (D) was determined by qPCR and lung MDA concentrations were measured by TBARS assay. Mean ± SEM; two independent experiments, six mice/group. n.s., not significant; *, P < 0.05; **, P < 0.01 (unpaired Student’s t test). (E) Human MDMs were treated with low doses of LPS and MDA concentration (left) and Pla2g2d expression (right) were measured as before. Mean ± SEM; two independent experiments, three human PBMC samples with four replicates/sample. *, P < 0.05; ***, P < 0.001, unpaired Student’s t test.

Comment in

References

    1. Alsolamy S. 2015. Middle East respiratory syndrome: knowledge to date. Crit. Care Med. 43:1283–1290. 10.1097/CCM.0000000000000966 - DOI - PubMed
    1. Angeli V., Faveeuw C., Roye O., Fontaine J., Teissier E., Capron A., Wolowczuk I., Capron M., and Trottein F.. 2001. Role of the parasite-derived prostaglandin D2 in the inhibition of epidermal Langerhans cell migration during schistosomiasis infection. J. Exp. Med. 193:1135–1147. 10.1084/jem.193.10.1135 - DOI - PMC - PubMed
    1. Arita M., Yoshida M., Hong S., Tjonahen E., Glickman J.N., Petasis N.A., Blumberg R.S., and Serhan C.N.. 2005. Resolvin E1, an endogenous lipid mediator derived from omega-3 eicosapentaenoic acid, protects against 2,4,6-trinitrobenzene sulfonic acid-induced colitis. Proc. Natl. Acad. Sci. USA. 102:7671–7676. 10.1073/pnas.0409271102 - DOI - PMC - PubMed
    1. Arnardottir H.H., Dalli J., Colas R.A., Shinohara M., and Serhan C.N.. 2014. Aging delays resolution of acute inflammation in mice: reprogramming the host response with novel nano-proresolving medicines. J. Immunol. 193:4235–4244. 10.4049/jimmunol.1401313 - DOI - PMC - PubMed
    1. Assiri A., Al-Tawfiq J.A., Al-Rabeeah A.A., Al-Rabiah F.A., Al-Hajjar S., Al-Barrak A., Flemban H., Al-Nassir W.N., Balkhy H.H., Al-Hakeem R.F., et al. . 2013. Epidemiological, demographic, and clinical characteristics of 47 cases of Middle East respiratory syndrome coronavirus disease from Saudi Arabia: a descriptive study. Lancet Infect. Dis. 13:752–761. - PMC - PubMed

Publication types