. 2015 Nov;169(3):2064-79.
doi: 10.1104/pp.15.00262. Epub 2015 Sep 21.

Two ATP Binding Cassette G Transporters, Rice ATP Binding Cassette G26 and ATP Binding Cassette G15, Collaboratively Regulate Rice Male Reproduction

Affiliations

Two ATP Binding Cassette G Transporters, Rice ATP Binding Cassette G26 and ATP Binding Cassette G15, Collaboratively Regulate Rice Male Reproduction

Guochao Zhao et al. Plant Physiol. 2015 Nov.

Abstract

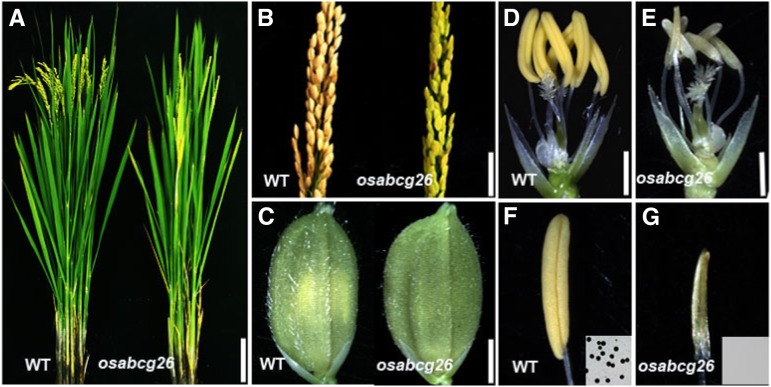
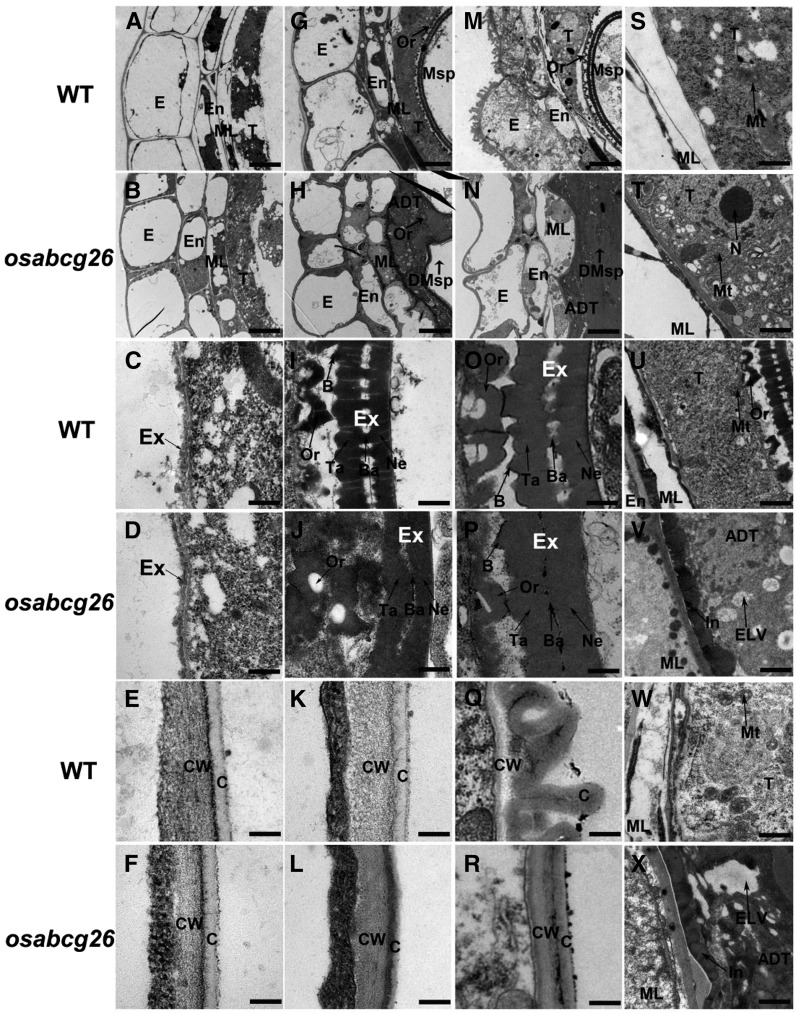
Male reproduction in higher plants requires the support of various metabolites, including lipid molecules produced in the innermost anther wall layer (the tapetum), but how the molecules are allocated among different anther tissues remains largely unknown. Previously, rice (Oryza sativa) ATP binding cassette G15 (ABCG15) and its Arabidopsis (Arabidopsis thaliana) ortholog were shown to be required for pollen exine formation. Here, we report the significant role of OsABCG26 in regulating the development of anther cuticle and pollen exine together with OsABCG15 in rice. Cytological and chemical analyses indicate that osabcg26 shows reduced transport of lipidic molecules from tapetal cells for anther cuticle development. Supportively, the localization of OsABCG26 is on the plasma membrane of the anther wall layers. By contrast, OsABCG15 is polarly localized in tapetal plasma membrane facing anther locules. osabcg26 osabcg15 double mutant displays an almost complete absence of anther cuticle and pollen exine, similar to that of osabcg15 single mutant. Taken together, we propose that OsABCG26 and OsABCG15 collaboratively regulate rice male reproduction: OsABCG26 is mainly responsible for the transport of lipidic molecules from tapetal cells to anther wall layers, whereas OsABCG15 mainly is responsible for the export of lipidic molecules from the tapetal cells to anther locules for pollen exine development.


Figures

Figure 1.
Figure 1.
Phenotypic analysis of osabcg26. A, Wild-type (WT) and osabcg26 plants after heading. B, Wild-type and osabcg26 seed setting. C, Wild-type and osabcg26 flowers before anthesis. D and E, Wild-type and osabcg26 flower organs after removal of the palea and lemma. F and G, Wild-type yellow anther and osabcg26 pale yellow smaller anther. Insets show stained pollen grains. Bars = 10 cm (A), 2.5 cm (B), 2 mm (C), 1.5 mm (D and E), and 1 mm (F and G).
Figure 2.
Figure 2.
Defective cuticle and pollen development in osabcg26. A to H, Comparison of anther development in the wild type (WT) and osabcg26. The images are cross sections of a single locule. Wild-type anthers are shown in A to D, and osabcg26 anthers are shown in E to H. I to P, SEM analysis of anther outer surface of the wild type (I) and osabcg26 (M), anther inner surface of the wild type (J) and osabcg26 (N), pollen grains of the wild type (K) and osabcg26 (O), and pollen grains surface of the wild type (L) and osabcg26 (P) at stage 13 (St13). DMsp, Degenerated microspore; E, epidermis; En, endothecium; GP, germination pore; ML, middle layer; Msp, microspore; T, tapetum; Tds, tetrads; Ub, Ubisch body. Bars = 15 µm (A–H), 10 µm (I and M), 2 µm (J and N), 6 µm (K and O), and 1 µm (L and P).
Figure 3.
Figure 3.
TEM analysis of osabcg26 anthers. A, G, and M, Cross sections of wild-type (WT) anther wall layers at stages 9 to 11. B, H, and N, Cross sections of osabcg26 anther wall layers at stages 9 to 11. C, I, and O, The pollen exine development of the wild type at stages 9 to 11. D, J, and P, The defective pollen exine development of osabcg26 at stages 9 to 11. E, K, and Q, The outer region of anther epidermis in the wild type at stages 9 to 11. F, L, and R, The outer region of anther epidermis in osabcg26 at stages 9 to 11. S and T, The structure of the tapetum in the wild type (S) and osabcg26 (T) at stage 9. U and V, The structure of the tapetum in the wild type (U) and osabcg26 (V) at stage 10. W and X, The structure of the tapetum in the wild type (W) and osabcg26 (X) at stage 11. ADT, Abnormal degenerated tapetum; B, bulged; Ba, bacula; C, cuticle; CW, cell wall; DMsp, degenerated microspore; E, epidermis; En, endothecium; ELV, electron-lucent vacuoles; Ex, exine; In, inclusion; ML, middle layer; Msp, microspore; Mt, mitochondrion; N, nucleus; Ne, nexine; Or, orbicule; T, tapetum; Ta, tectum. Bars = 10 µm (A, B, G, H, M, and N), 500 nm (C–F, I–L, and O–R), and 1 µm (S–X).
Figure 4.
Figure 4.
Analysis of anther wax and cutin in the wild type (WT), osabcg26, osabcg15, and osabcg26 osabcg15. A, Total wax amounts per unit surface area (micrograms per millimeter−2) in wild-type, osabcg26, osabcg15, and osabcg26 osabcg15 anthers. Error bars indicate sd (n = 5). B, Wax constituents per unit surface area (micrograms per millimeter−2) in wild-type, osabcg26, osabcg15, and osabcg26 osabcg15 anthers. Error bars indicate sd (n = 5). C, Total cutin amounts per unit surface area (micrograms per millimeter−2) in wild-type, osabcg26, osabcg15, and osabcg26 osabcg15 anthers. Error bars indicate sd (n = 5). D, Cutin constituents per unit surface area (micrograms per millimeter−2) in wild-type, osabcg26, osabcg15, and osabcg26 osabcg15 anthers. Error bars indicate sd (n = 5). URWC1, Unknown rice wax constituent1; *, P < 0.05; **, P < 0.01.
Figure 5.
Figure 5.
Cloning and analysis of OsABCG26. A, Fine mapping of OsABCG26 on chromosome 10 (Chr. 10). Names and positions of the markers are noted. B, A schematic representation of the exon and intron organization of OsABCG26 (Loc_Os10g35180); +1 indicates the putative starting nucleotide of translation, and the stop codon (TGA) is +5,293. Black boxes indicate exons, and intervening lines indicate introns. Numbers indicate the exon length (base). BAC, Bacterial artificial chromosome; UTR, untranslated regions.
Figure 6.
Figure 6.
Phenotypic analysis of osabcg26 osabcg15 anthers. A to D, Semithin section analysis of anther in the wild type (WT; A), osabcg26 (B), osabcg15 (C), and osabcg26 osabcg15 (D). E to H, The structure of the tapetum and pollen exine in the wild type (E), osabcg26 (F), osabcg15 (G), and osabcg26 osabcg15 (H) by TEM. I to L, The outer region of anther epidermis in the wild type (I), osabcg26 (J), osabcg15 (K), and osabcg26 osabcg15 (L) by TEM. M to P, SEM analysis of the anther surface of the wild type (M), osabcg26 (N), osabcg15 (O), and osabcg26 osabcg15 (P). C, Cuticle; E, exine; In, inclusion; ML, middle layer; St, stage; T, tapetum. Bars = 20 µm (A–D), 1 µm (E–L), and 10 µm (M–P).
Figure 7.
Figure 7.
The expression analysis of OsABCG26. A, qRT-PCR analysis of OsABCG26. RNA was extracted from anthers, Error bars indicate sd, and each reaction had three biological repeats. B, GUS expression was visible in anthers of the OsABCG26pro:GUS transgenic line at various stages. C, GUS expression (arrows) in the epidermis, endothecium, and tapetum at stage 9 (St9). E, Epidermis; En, endothecium; Le/pa, lemma and palea; T, tapetum; WT, wild type.
Figure 8.
Figure 8.
Plasma membrane localization of OsABCG15 and OsABCG26 visualized by confocal microscopy. A to F, Localization of fusions proteins eYFP-OsABCG15 and eYFP-OsABCG26 in onion epidermal cells. In each image pair, the photo on the left was acquired through bright field, and the photo on the right shows the fluorescence image of the same cell. G, eYFP-OsABCG26 signal at the plasma membrane of epidermal cells of anther (arrow). H, Plasma membrane of epidermal cells of anther stained with FM4-64. I, eYFP-OsABCG26 colocalized with plasma membrane stained with FM4-64. Anther derived from plants harboring the pOsABCG26:eYFP-OsABCG26 vector (eYFP fused in the N termini) at stage 9. Bars = 50 µm (A–F) and 5 µm (G–I).
Figure 9.
Figure 9.
Tissue-specific localization of OsABCG26 and OsABCG15. Images were acquired through YFP filter (A, C, E, G, I, K, M, and O) and merge (B, D, F, H, J, L, N, and P) from YFP filter, bright field, and chlorophyll filter. A to J, eYFP-OsABCG26 signal localized at the epidermis, endothecium, and tapetum of anther in pOsABCG26:eYFP-OsABCG26-expressing plants at stage 9. A and B show images taken from a focal plane at a distal region of the epidermis. C and D show images taken from a focal plane at a distal region of the endothecium of the same anther shown in A. E and F show images taken from a focal plane at a distal region of the tapetum of the same anther shown in A. G and H show images taken from a focal plane at a unilateral region of the same anther shown in A. I and J show images taken from anther cross sections. K to P, eYFP-OsABCG15 signal localized at the tapetum of anther in pOsABCG15:eYFP-OsABCG15-expressing plants at stage 9. K and L show images taken from a focal plane at a distal region of tapetum. M and N show images taken from a focal plane at a unilateral region of the same anther shown in K. O and P show images taken from anther cross sections. Chlorophyll autofluorescence is shown for visualization of anther tissue. E, Epidermis; En, endothecium; Msp, microspore; T, tapetum. Bars = 10 µm (A–F, K, and L) and 30 µm (G–J and M–P).
Figure 10.
Figure 10.
The expression analysis of the gene-related lipid metabolism in anthers at stages 9 to 11 (St9–St11). qRT-PCR analysis of genes related to lipid metabolism in the wild type (WT) and osabcg26. Error bars indicate sd, and each reaction had three biological repeats.
Figure 11.
Figure 11.
The proposed model of the role of OsABCG26 and OsABCG15 during anther development. OsABCG26, a half-sized plasma membrane-localized transport protein possibly forming homodimers or heterodimers for export, may export lipidic precursors out of tapetal, endothecial, and epidermal cells to the surface for anther cuticle development at stages 9 and 10 when the middle layer degenerated. OsC6, an LTP protein, may transport lipidic precursors across cell spaces among different plasma membranes (Zhang et al., 2010). OsABCGX, a putative ABCG importer, may import lipidic precursors across the plasma membrane into different anther wall cells. In such a way, the lipidic precursors are eventually transported to the anther surfaces for cuticle formation. Meanwhile, sporopollenin precursors may be exported from tapetum to anther locule by OsABCG15 and then, to the surface of the microspore by OsC6 for exine formation (Zhang et al., 2010). ER, Endoplasmic reticulum.

References

    1. Alejandro S, Lee Y, Tohge T, Sudre D, Osorio S, Park J, Bovet L, Lee Y, Geldner N, Fernie AR, et al. (2012) AtABCG29 is a monolignol transporter involved in lignin biosynthesis. Curr Biol 22: 1207–1212 - PubMed
    1. Ariizumi T, Hatakeyama K, Hinata K, Inatsugi R, Nishida I, Sato S, Kato T, Tabata S, Toriyama K (2004) Disruption of the novel plant protein NEF1 affects lipid accumulation in the plastids of the tapetum and exine formation of pollen, resulting in male sterility in Arabidopsis thaliana. Plant J 39: 170–181 - PubMed
    1. Ariizumi T, Kawanabe T, Hatakeyama K, Sato S, Kato T, Tabata S, Toriyama K (2008) Ultrastructural characterization of exine development of the transient defective exine 1 mutant suggests the existence of a factor involved in constructing reticulate exine architecture from sporopollenin aggregates. Plant Cell Physiol 49: 58–67 - PubMed
    1. Ariizumi T, Toriyama K (2011) Genetic regulation of sporopollenin synthesis and pollen exine development. Annu Rev Plant Biol 62: 437–460 - PubMed
    1. Aya K, Ueguchi-Tanaka M, Kondo M, Hamada K, Yano K, Nishimura M, Matsuoka M (2009) Gibberellin modulates anther development in rice via the transcriptional regulation of GAMYB. Plant Cell 21: 1453–1472 - PMC - PubMed

Publication types

MeSH terms

Substances