. 2015 Sep 21;16(1):198.
doi: 10.1186/s13059-015-0767-1.

HiCPlotter integrates genomic data with interaction matrices

Affiliations

HiCPlotter integrates genomic data with interaction matrices

Kadir Caner Akdemir et al. Genome Biol. .

Abstract

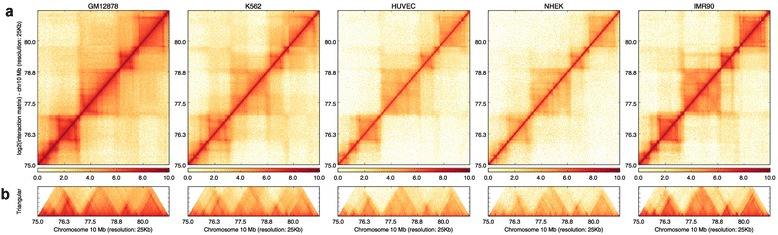
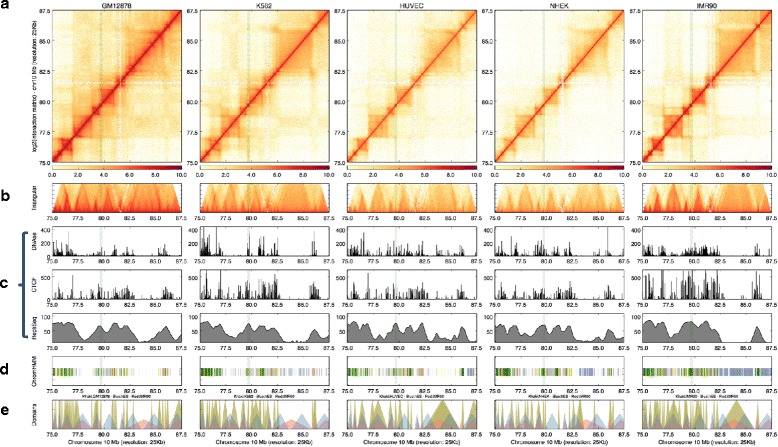
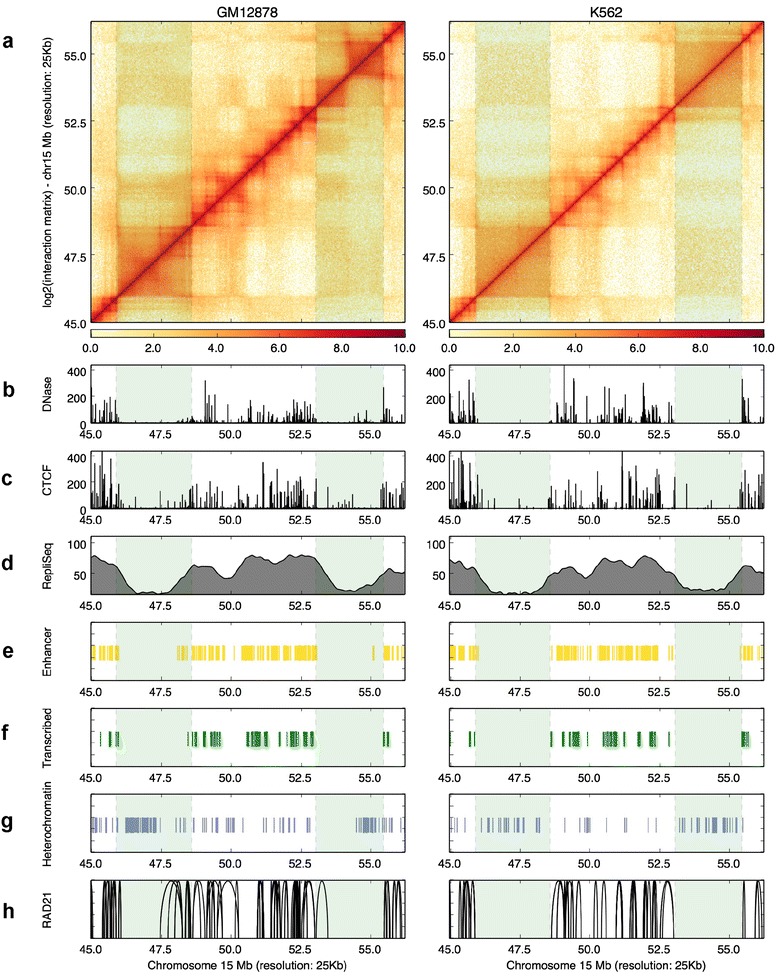
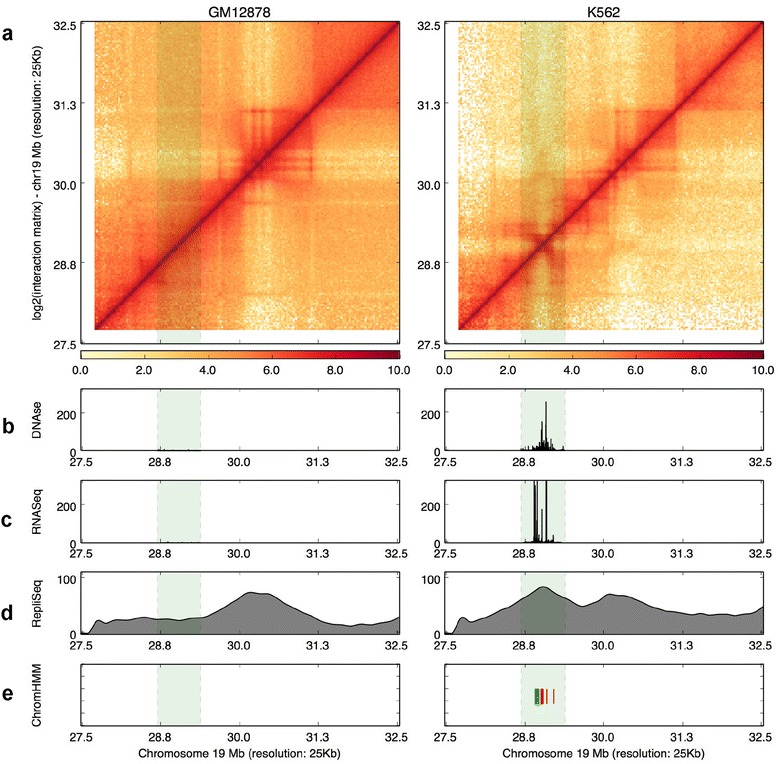
Metazoan genomic material is folded into stable non-randomly arranged chromosomal structures that are tightly associated with transcriptional regulation and DNA replication. Various factors including regulators of pluripotency, long non-coding RNAs, or the presence of architectural proteins have been implicated in regulation and assembly of the chromatin architecture. Therefore, comprehensive visualization of this multi-faceted structure is important to unravel the connections between nuclear architecture and transcriptional regulation. Here, we present an easy-to-use open-source visualization tool, HiCPlotter, to facilitate juxtaposition of Hi-C matrices with diverse genomic assay outputs, as well as to compare interaction matrices between various conditions. https://github.com/kcakdemir/HiCPlotter.


Figures

Fig. 1
Fig. 1
Basic usage of HiCPlotter. Genomic region inside human chromosome 10 as viewed with HiCPlotter. Interaction matrices of GM12878, K562, HUVEC, NHEK, and IMR90 cells can be displayed as a heatmap (a) and rotated half matrix (b), with the range of the rotated half matrix being 8 megabases from the diagonal
Fig. 2
Fig. 2
Adding tracks. Interaction matrices of GM12878, K562, HUVEC, NHEK, and IMR90 cells can be displayed as a heatmap (a) and rotated half matrix (b), with the range of the rotated half matrix being 8 megabases from the diagonal. c Histograms representing DNAseI hypersensitivity (top) and CTCF (middle) and Repli-Seq (bottom) signals for each type. d Tile plot of ChromHMM [20] calls within the represented locus. e Custom domain visualization as triangles. Arrowhead domains identified by Rao et al. [8] (khaki), and TADs reported [7] in human embryonic stem cells (blue) and IMR90 cells (red) are superimposed. An example arrowhead domain is highlighted by green shaded column inside the represented locus
Fig. 3
Fig. 3
Cohesin ChIA-PET interactions coincide with early replication sites. a Hi-C contact maps are visualized as heatmaps for GM12878 and K562 cells. Histograms representing DNAseI hypersensitivity (b) and CTCF (c) and Repli-Seq (d) signals for each type. e Tiles mark enhancer calls with ChromHMM inside the visualized genomic segment. f Tiles mark transcribed regions identified with ChromHMM inside the visualized genomic segment. g Tiles mark heterochromatin regions identified with ChromHMM inside the visualized genomic segment. h Arcs visualize significantly interacting ChIA-PET tags for RAD21 inside the represented locus. Late replicating loci are highlighted by the two green shaded columns
Fig. 4
Fig. 4
A lincRNA locus exhibits active chromatin formation in K562 cells. a Hi-C contact maps are visualized as heatmaps for GM12878 and K562 cells. Histograms representing DNAseI hypersensitivity (b), RNA-Seq expression (c), and Repli-Seq signals (d) for each type. e Tiles mark active transcription start site (red) and transcribed (green) state calls by ChromHMM inside the highlighted genomic segment. The lincRNA locus gaining active chromatin in K562 cells is highlighted by the green shaded column

References

    1. Bickmore WA, van Steensel B. Genome architecture: domain organization of interphase chromosomes. Cell. 2013;152:1270–1284. doi: 10.1016/j.cell.2013.02.001. - DOI - PubMed
    1. Dekker J, Rippe K, Dekker M, Kleckner N. Capturing chromosome conformation. Science. 2002;295:1306–1311. doi: 10.1126/science.1067799. - DOI - PubMed
    1. van Steensel B, Dekker J. Genomics tools for unraveling chromosome architecture. Nat Biotechnol. 2010;28:1089–1095. doi: 10.1038/nbt.1680. - DOI - PMC - PubMed
    1. Dekker J, Marti-Renom MA, Mirny LA. Exploring the three-dimensional organization of genomes: interpreting chromatin interaction data. Nat Rev Genet. 2013;14:390–403. doi: 10.1038/nrg3454. - DOI - PMC - PubMed
    1. Lieberman-Aiden E, van Berkum NL, Williams L, Imakaev M, Ragoczy T, Telling A, et al. Comprehensive mapping of long-range interactions reveals folding principles of the human genome. Science. 2009;326:289–293. doi: 10.1126/science.1181369. - DOI - PMC - PubMed

Publication types

LinkOut - more resources