. 2015 Dec;25(12):1801-11.
doi: 10.1101/gr.192005.115. Epub 2015 Sep 21.

Bacterial infection remodels the DNA methylation landscape of human dendritic cells

Affiliations

Bacterial infection remodels the DNA methylation landscape of human dendritic cells

Alain Pacis et al. Genome Res. 2015 Dec.

Abstract

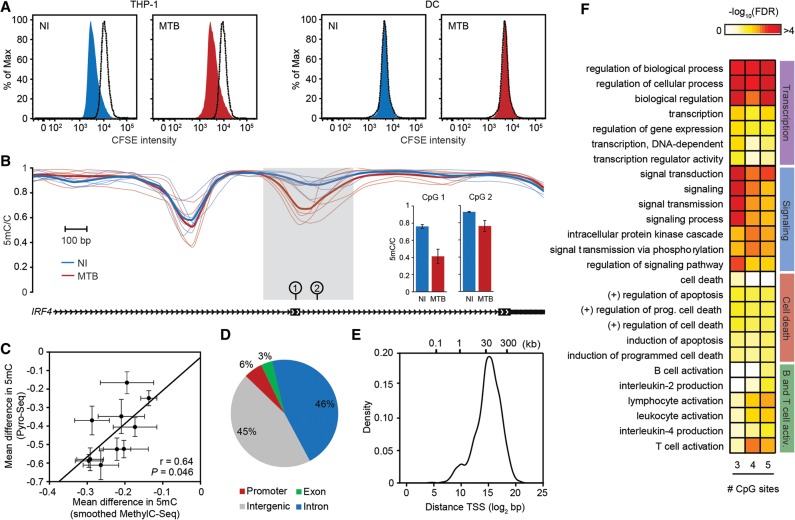
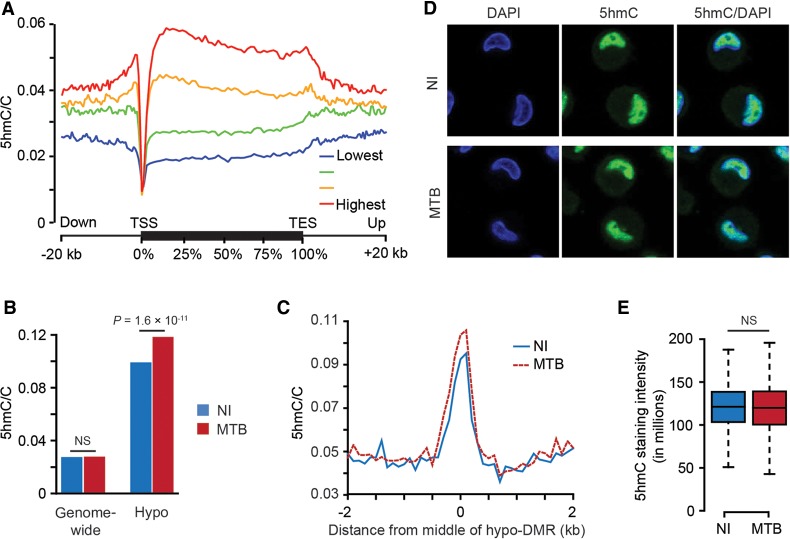
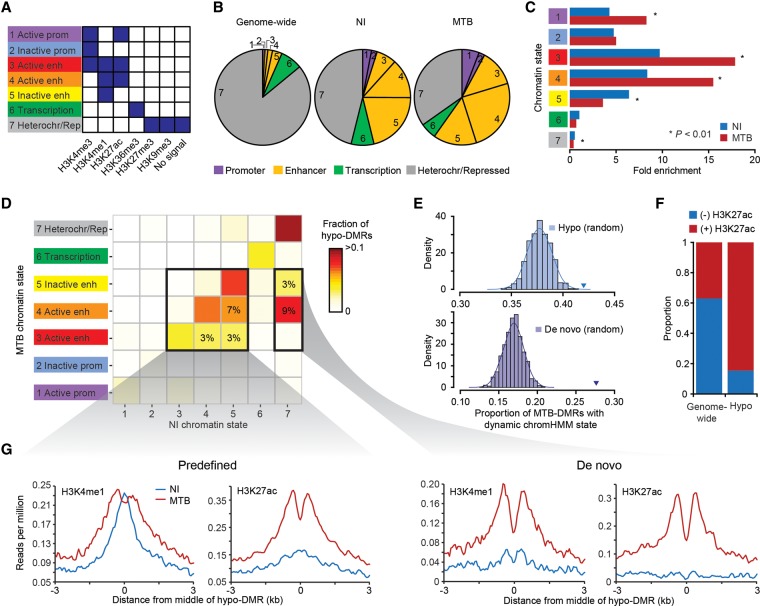
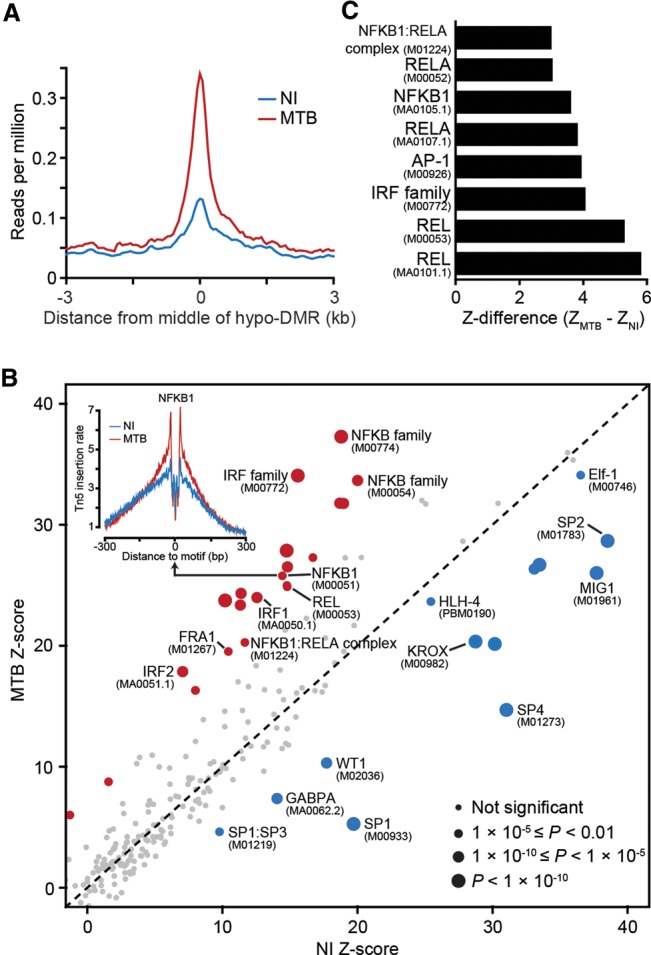
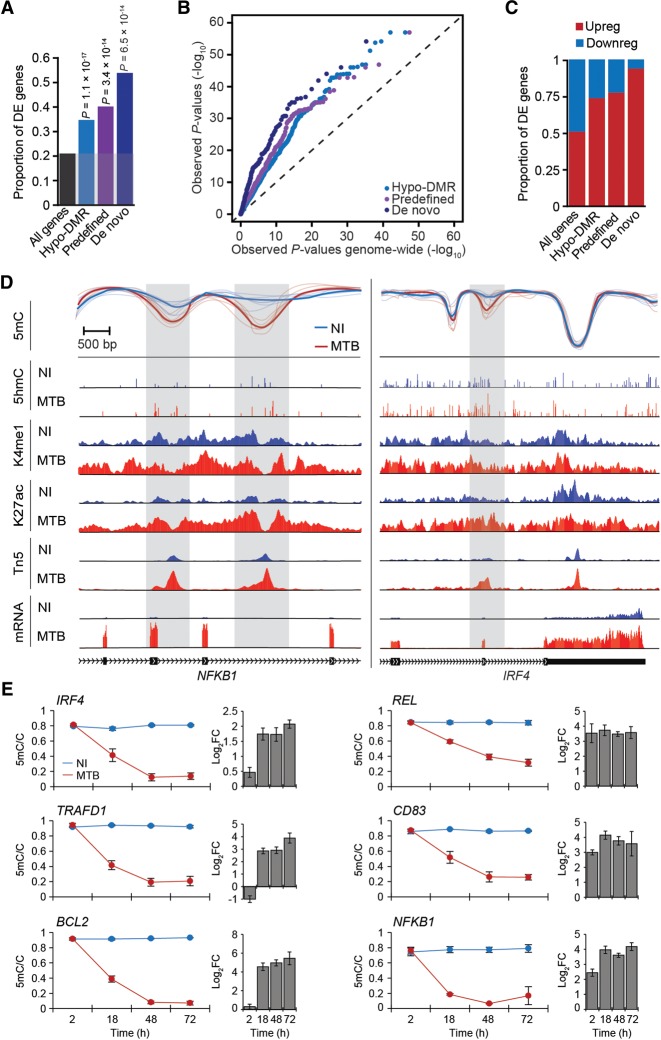
DNA methylation is an epigenetic mark thought to be robust to environmental perturbations on a short time scale. Here, we challenge that view by demonstrating that the infection of human dendritic cells (DCs) with a live pathogenic bacteria is associated with rapid and active demethylation at thousands of loci, independent of cell division. We performed an integrated analysis of data on genome-wide DNA methylation, histone mark patterns, chromatin accessibility, and gene expression, before and after infection. We found that infection-induced demethylation rarely occurs at promoter regions and instead localizes to distal enhancer elements, including those that regulate the activation of key immune transcription factors. Active demethylation is associated with extensive epigenetic remodeling, including the gain of histone activation marks and increased chromatin accessibility, and is strongly predictive of changes in the expression levels of nearby genes. Collectively, our observations show that active, rapid changes in DNA methylation in enhancers play a previously unappreciated role in regulating the transcriptional response to infection, even in nonproliferating cells.


Figures

Figure 1.
Figure 1.
MTB-induced changes in methylation in post-mitotic human DCs. (A) CFSE-labeled THP-1 (left) and CFSE-labeled DCs (right). Proliferation was assayed in either noninfected cells (NI) or cells infected for 18 h with MTB. Similar results were observed 48 h post-infection (Supplemental Fig. S16). (B) Example of a region showing active loss of DNA methylation in response to MTB infection (gray shading). The plot shows smoothed methylation values (y-axis) for six noninfected (blue) and six MTB-infected samples (red). Thick blue and red lines show average methylation levels for noninfected and infected cells, respectively. The inset on the right shows methylation levels at two individual CpG sites within the hypomethylated region using bisulfite pyrosequencing as a validation method. (C) Scatterplot showing the correlation between MethylC-seq (x-axis; smoothed data) and pyrosequencing data (y-axis) for mean differences in methylation between infected and noninfected cells, at 10 CpG sites within hypomethylated DMRs. Data are represented as mean ± SEM, n = 6 for MethylC-seq and n = 5 for Pyro-seq. (D) Pie chart showing the distribution of hypomethylated regions in different genomic regions. Each MTB-DMR is counted only once: The overlap of a genomic region excludes all previously overlapped MTB-DMRs, starting clockwise from promoters (TSS ± 500 bp; red). (E) Distribution of distances of MTB-DMRs to the nearest TSS. (F) Representative gene ontology (GO) terms enriched among genes associated with hypomethylated regions. To demonstrate that the enriched biological processes are largely robust to the cutoff used to define MTB-DMRs, we show how these results differ depending on the number of differentially methylated CpG sites (P < 0.01) required to call an MTB-DMR (from at least three to at least five consecutive sites).
Figure 2.
Figure 2.
5hmC is enriched in MTB-DMRs prior to infection. (A) Metagene profiles of 5hmC levels relative to Ensembl transcripts expressed at different levels in human DCs. We grouped genes in four quantiles based on their expression levels in noninfected DCs. (B) Barplots showing mean 5hmC/C ratios within hypomethylated regions, before (blue) and after infection (red). (C) Composite plots of patterns of 5hmC before (blue) and after (red) MTB infection ±3 kb around the midpoint of hypomethylated regions. (D) 5hmC staining in noninfected (top panel) and MTB-infected DCs (bottom panel). 5hmC levels are given by the levels of Alexa 488 (green: middle panel). Cells counterstained with DAPI to localize the nucleus are shown in the first panel. (E) Box plots showing the distribution of 5hmC staining intensity. No significant differences were observed between the two groups.
Figure 3.
Figure 3.
MTB-DMRs overlap with enhancer elements that become active upon infection in hypomethylated regions. (A) Combination of histone patterns used to define the seven chromatin states. The precise relative contribution of each chromatin mark to each of the chromHMM-defined states can be found in Supplemental Figure S3. Note that state 7 was defined by either no signal or the presence of either H3K27me3/H3K9me3. (B) Pie charts showing the distribution of chromatin state annotations genome-wide (on noninfected cells) and within all MTB-DMRs in either noninfected (NI) or MTB-infected cells. The chromatin state codes are as defined in A. (C) Fold enrichments of the different chromatin states within hypomethylated regions as compared to genome-wide expectations in noninfected (blue) and MTB-infected cells (red). (D) Heat map of the proportion of hypomethylated regions by chromatin transition state. The x-axis represents the chromatin states defined in noninfected DCs and the y-axis the chromatin state of the same region in MTB-infected DCs. The two bold inner boxes indicate two subgroups of hypomethylated regions, (left) predefined enhancers (detectable enhancers in noninfected DCs) and (right) de novo enhancers (detectable enhancers only in MTB-infected DCs). The numbers inside the cells refer to the proportion of hypomethylated regions that undergo each of the highlighted transitions. (E) (Top panel) Histogram showing the observed proportion of regions that change chromatin state after infection (any transition) when sampling 1000 random sets of regions matched to the chromatin states found in noninfected samples within hypomethylated regions. Each random set contains the same number of hypomethylated regions as those identified in the true data (n = 1714). The blue triangle represents the observed proportion of hypomethylated regions that changed chromatin state in response to MTB infection. (Bottom panel) Same as above but focusing on regions of the genome labeled as heterochromatin/repressed before infection (state 7; n = 790) that gain de novo enhancer marks upon MTB infection (states 3, 4, or 5). The purple triangle represents the proportion observed within the true set of hypomethylated regions. (F) Bar plot showing the proportion of hypomethylated regions that overlap with enhancers and show dynamic changes in chromatin state, as defined by the gain or loss of H3K27ac mark. (G) Composite plots of patterns of H3K4me1 and H3K27ac ChIP-seq signals ±3 kb around the midpoints of hypomethylated regions (x-axis) overlapping with predefined (left) and de novo (right) enhancers.
Figure 4.
Figure 4.
MTB-DMRs are bound by signal-dependent transcription factors. (A) Tn5-accessibility profiles before (NI) and after MTB infection, ±3 kb around the midpoints of hypomethylated regions. (B) Scatterplot comparing transcription factor occupancy score predictions between noninfected (x-axis) and MTB-infected DCs (y-axis). The size of the dots is proportional to the level of statistical significance supporting differential binding in response to MTB infection. Red dots represent TFs that show evidence for increased binding after MTB infection, and blue dots represent TFs that show evidence for decreased binding after infection. The inset on the top left corner shows the genome-wide footprint of the NF-κB (p50) motif (motif ID: M00051) in noninfected (blue) and MTB-infected DCs (red). In this example, the footprint in MTB-infected DCs is clearly stronger, which supports increased TF binding to the NF-κB (p50) motif genome-wide, upon MTB infection. (C) TF motifs (motif IDs in parentheses) that show significantly increased binding in hypomethylated regions after MTB infection.
Figure 5.
Figure 5.
Differential methylation is coupled to differential gene expression. (A) Proportion of differentially expressed (DE) genes (y-axis) observed among all tested genes and among genes associated with different subgroups of hypo-DMRs. (B) QQ-plot showing that genes in the vicinity of hypo-DMRs show stronger statistical evidence for being differentially expressed in response to MTB infection (P-values on y-axis) compared to all genes tested (P-values on x-axis). (C) Proportion of up- and down-regulated genes among DE genes associated with the different subgroups of hypo-DMRs. (D) Examples of genes encoding for two key transcription factors, NFKB1 (left panel) and IRF4 (right panel) that are strongly up-regulated in response to MTB infection and for which we identified one or more hypomethylated regions (gray shading) that overlap with putative enhancer elements. Normalized read signals for the indicated features are shown for noninfected (blue tracks) and infected conditions (red tracks). (K4me1) H3K4me1, (K27ac) H3K27ac, (Tn5) transposase-accessible chromatin, (mRNA) mRNA expression levels. (E) Changes in DNA methylation levels (y-axis) measured by pyrosequencing across four time points after MTB infection (2, 18, 48, and 72 h) along with the corresponding fold changes in log2 scale (log2FC) in normalized gene expression of the associated gene. Blue and red lines represent average methylation levels in noninfected and MTB-infected DCs, respectively. All data are represented as mean ± SEM, with a minimum of three biological replicates per group. PyroMark and real-time PCR data are reported in Supplemental Tables S7 and S8, respectively.

References

    1. Anders S, McCarthy DJ, Chen Y, Okoniewski M, Smyth GK, Huber W, Robinson MD. 2013. Count-based differential expression analysis of RNA sequencing data using R and Bioconductor. Nat Protoc 8: 1765–1786. - PubMed
    1. Ardeshna KM, Pizzey AR, Thomas NS, Orr S, Linch DC, Devereux S. 2000. Monocyte-derived dendritic cells do not proliferate and are not susceptible to retroviral transduction. Br J Haematol 108: 817–824. - PubMed
    1. Barreiro LB, Tailleux L, Pai AA, Gicquel B, Marioni JC, Gilad Y. 2012. Deciphering the genetic architecture of variation in the immune response to Mycobacterium tuberculosis infection. Proc Natl Acad Sci 109: 1204–1209. - PMC - PubMed
    1. Bierne H, Hamon M, Cossart P. 2012. Epigenetics and bacterial infections. Cold Spring Harb Perspect Med 2: a010272. - PMC - PubMed
    1. Bruniquel D, Schwartz RH. 2003. Selective, stable demethylation of the interleukin-2 gene enhances transcription by an active process. Nat Immunol 4: 235–240. - PubMed

Publication types

MeSH terms