

Resistance of glia-like central and peripheral neural stem cells to genetically induced mitochondrial dysfunction--differential effects on neurogenesis
- PMID: 26392570
- PMCID: PMC4641503
- DOI: 10.15252/embr.201540982
Resistance of glia-like central and peripheral neural stem cells to genetically induced mitochondrial dysfunction--differential effects on neurogenesis
Abstract
Mitochondria play a central role in stem cell homeostasis. Reversible switching between aerobic and anaerobic metabolism is critical for stem cell quiescence, multipotency, and differentiation, as well as for cell reprogramming. However, the effect of mitochondrial dysfunction on neural stem cell (NSC) function is unstudied. We have generated an animal model with homozygous deletion of the succinate dehydrogenase subunit D gene restricted to cells of glial fibrillary acidic protein lineage (hGFAP-SDHD mouse). Genetic mitochondrial damage did not alter the generation, maintenance, or multipotency of glia-like central NSCs. However, differentiation to neurons and oligodendrocytes (but not to astrocytes) was impaired and, hence, hGFAP-SDHD mice showed extensive brain atrophy. Peripheral neuronal populations were normal in hGFAP-SDHD mice, thus highlighting their non-glial (non hGFAP(+)) lineage. An exception to this was the carotid body, an arterial chemoreceptor organ atrophied in hGFAP-SDHD mice. The carotid body contains glia-like adult stem cells, which, as for brain NSCs, are resistant to genetic mitochondrial damage.
Keywords: carotid body stem cells; mitochondrial dysfunction; neural stem cells; peripheral versus central neurogenesis.
© 2015 The Authors.
Figures
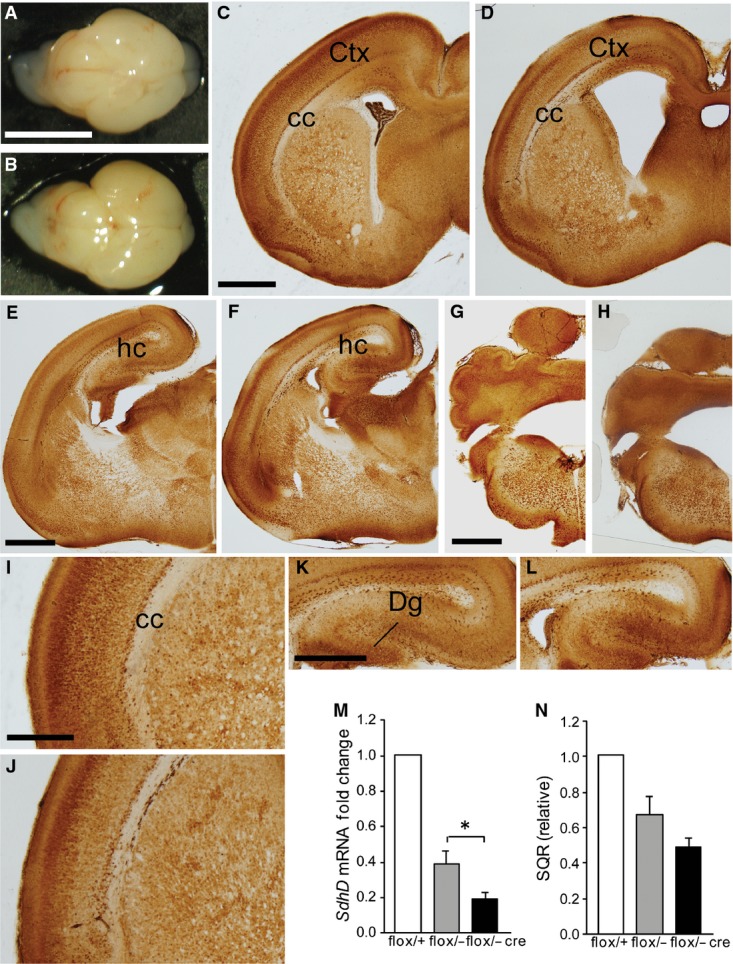
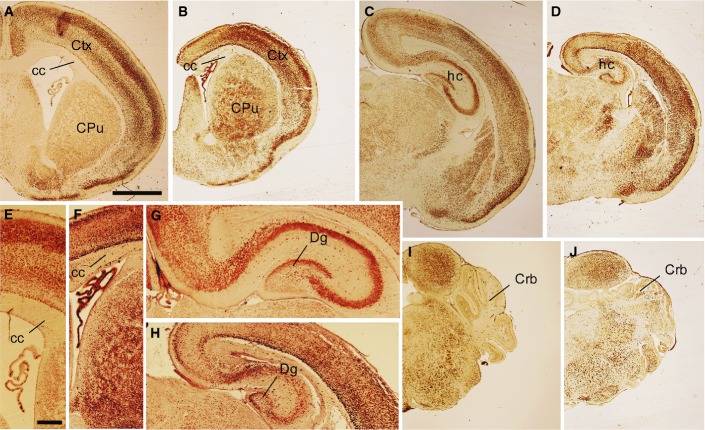
A, B Whole brain of control (A) and hGFAP-SDHD (B) mice. Scale bar: 5 mm.
C–L Brain sections of newborn (P0) control (C, E, G, I, K) and hGFAP-SDHD (D, F, H, J, L) mice immunostained with NeuN antibody. Scale bars: 1 mm (C–H), 200 μm (I–L). Ctx: cortex; cc: corpus callosum; Dg: dentate gyrus; hc: hippocampus.
M Relative levels of SdhD mRNA in the entire brain (P0) as determined by RT–qPCR of total RNA. Data are presented as mean ± SEM (n = 3–5). Statistical significance: *P ≤ 0.05. The Mann–Whitney U-test was applied.
N Succinate-ubiquinone oxidoreductase (SQR) activity of mitochondria isolated from the entire brain (P0). Data are presented as mean ± SEM (n = 4–8).
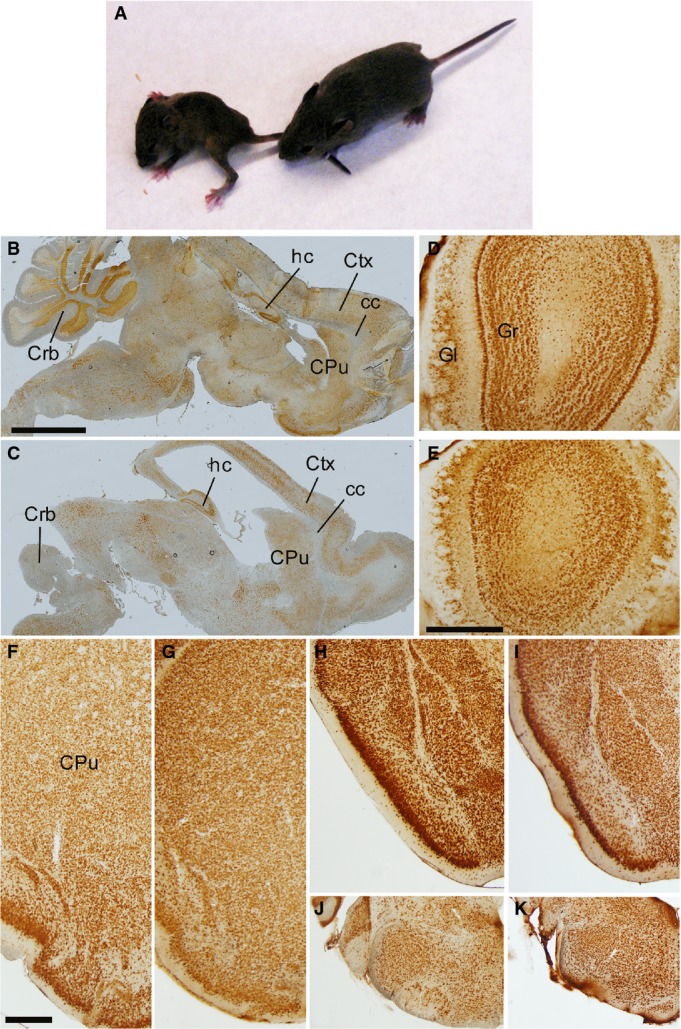
A GFAP-SDHD mutant (left) and control (right) littermates at P15.
B–K Brain sections from postnatal (P15) control (B, D, F, H, J) and GFAP-SDHD (C, E, G, I, K) mice immunostained with NeuN antibody. The images in (B, C) represent sagittal sections of different areas of the brain. The images in (D, E) correspond to sections of the olfactory bulb. The images in (F–K) present brain regions shown in Fig 1 at higher magnification. (F, G) Ventrolateral brain as in Fig 1B and C. (H, I) Ventrolateral brain as in Fig 1F and G. (J, K) Ventrolateral brain stem as in Fig 1J and K. Scale bars: 2 mm (B, C), 500 μm (D–K). CPu: caudate putamen; Crb: cerebellum; Ctx: cortex; cc: corpus callosum; Gl: glomerular layer; Gr: granular layer; hc: hippocampus.
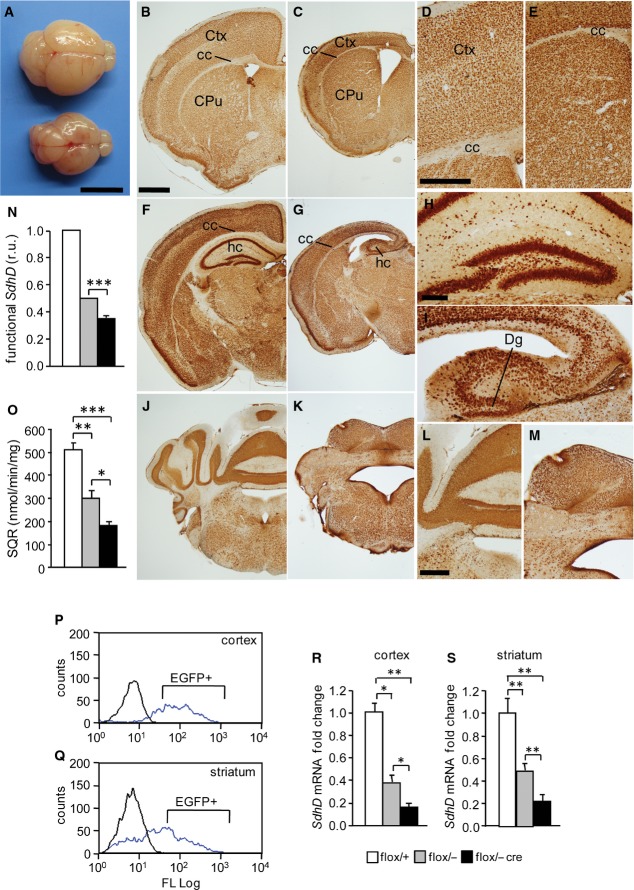
A Photographs of control (top) and hGFAP-SDHD (bottom) brains at P15. Scale bar: 5 mm.
B–M Brain sections of postnatal (P15) control (B, D, F, H, J, L) and hGFAP-SDHD (C, E, G, I, K, M) mice immunostained with NeuN antibody. Scale bars: 1 mm (B, C, F, G, J, K), 500 μm (D, E, H, I), and 200 μm (L, M). Ctx: cortex; cc: corpus callosum; CPu: caudate putamen; hc: hippocampus; Dg: dentate gyrus.
N Relative levels of functional SdhD allele in the entire brain (P15) as determined by qPCR of genomic DNA. r.u.: relative units (n = 4).
O Succinate–ubiquinone oxidoreductase (SQR) activity of mitochondria isolated from the entire brain (P15) (n = 6).
P, Q Representative profiles of sorted astrocytes from cortex and striatum of mice carrying the hGFAP-EGFP transgene (blue lines). Animals without the construct (black line) were used as blanks to determine the selection gates.
R, S Relative SdhD mRNA levels in sorted GFAP-expressing astrocytes from the cortex and striatum of control and hGFAP-SDHD mice.
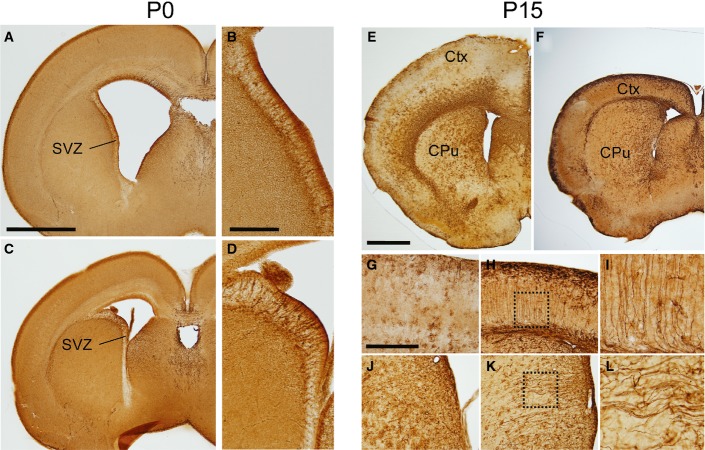
A–L Brain sections of newborn (P0; A–D) and postnatal (P15; E–L) control (A, B, E, G, J) and hGFAP-SDHD littermates (C, D, F, H, K, I, L) immunostained with GFAP antibody. The images in (B) and (D) are higher magnifications of the subventricular zone in (A) and (C), respectively. Images in (G, H) are higher magnifications of the cortex, and images in (J, K) of caudate-putamen areas shown in (E, F), respectively. Insets in (H) and (K) are higher magnified in (I) and (L), respectively. Scale bars: 1 mm (A, C, E, F), 200 μm (B, D), 500 μm (G, H, J, K). Ctx: cortex; CPu: caudate putamen; SVZ: subventricular zone.
A–J Brain sections of postnatal (P5) control (A, C, E, G, I) and GFAP-SDHD (B, D, F, H, J) mice immunostained with NeuN antibody. Scale bar: 2 mm (A–D, I, J), 500 μm (E–H). CPu: caudate putamen, Crb: cerebellum; cc: corpus callosum; Ctx: cortex; Dg: dentate gyrus; hc: hippocampus.
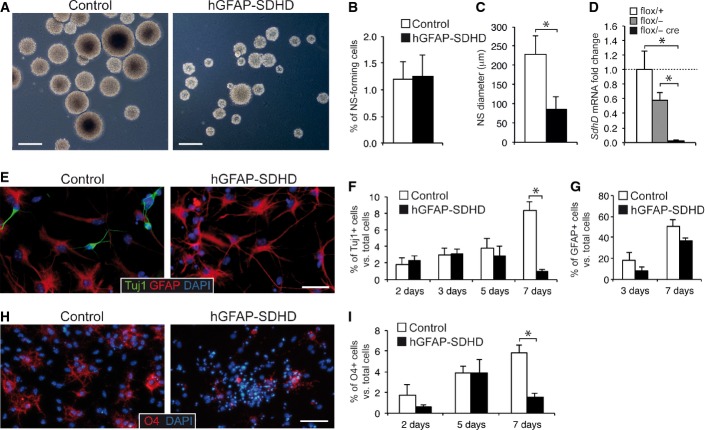
A Bright-field images of neurospheres obtained from SVZ neural stem cells of P15 control and hGFAP-SDHD mouse brains. Scale bars: 500 μm.
B, C Neurosphere (NS) forming efficiency (B) and core diameter (C) in cultures grown from SVZ of P15 control and hGFAP-SDHD mice (n = 6 cultures/mice for each genotype).
D Quantitative RT–PCR detection of SdhD expression levels in SVZ neurospheres of wild-type (flox/+) and mutant (flox/−, and flox/− cre) mice (n = 3–4 mice on each group).
E Immunofluorescence detection of the neuronal marker Tuj1 in SVZ neural stem cell-derived adherent cultures from P15 control or hGFAP-SDHD brains. Nuclei were counterstained with DAPI. Scale bar: 25 μm.
F Number of Tuj1+ neurons generated in SVZ neural stem cell adherent cultures in vitro for several days (n = 8 cultures/mice for each genotype).
G Number of GFAP+ astrocytes present in adherent cultures of SVZ neurospheres illustrating the resistance of glial cells to the loss of mitochondrial function (n = 5 independent cultures).
H Immunofluorescence detection of the oligodendrocyte marker O4 in SVZ neural stem cell-derived adherent cultures from P15 control or hGFAP-SDHD brains. Nuclei were counterstained with DAPI. Scale bar: 25 μm.
I Number of O4+ neurons generated in SVZ neural stem cell adherent cultures in vitro for several days (n = 5–7 cultures/mice for each genotype). See also Fig EV5.
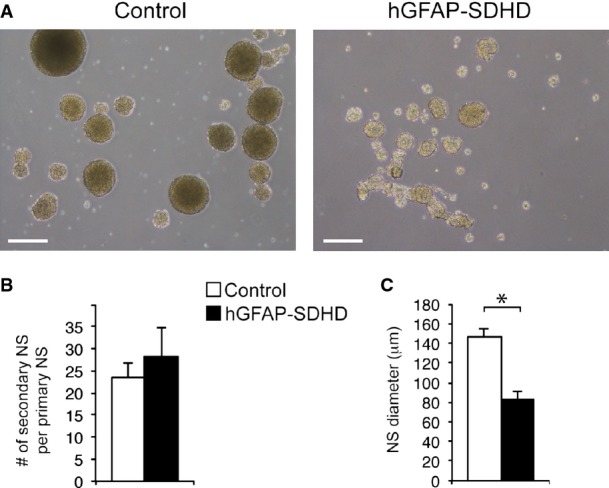
Bright-field pictures of secondary neurospheres obtained after dispersion and re-plating of SVZ primary neurospheres from wild-type or hGFAP-SDHD mice. Scale bar: 200 μm.
Quantification of the number of secondary neurospheres obtained per primary neurosphere. Data are presented as mean ± SEM (n = 3 cultures/mice per genotype).
Diameter of secondary neurospheres. Mean ± SEM (n = 3 cultures/mice per genotype). Statistical significance: *P ≤ 0.05. The two-tailed Student’s t-test was applied.
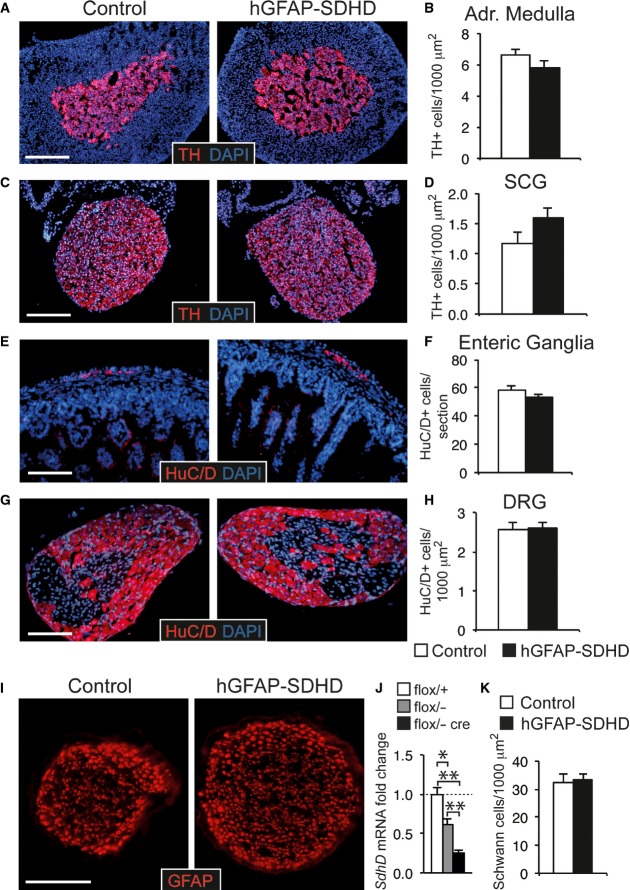
A–H Immunofluorescence detection of neuronal markers TH (A, C) and HuC/D (E, G) in the adrenal medulla (A), superior cervical ganglion (C), enteric ganglia at the level of the distal small intestine (E), and dorsal root ganglion (G) of P15 control and hGFAP-SDHD mice. Scale bars: 200 μm (A, C), 100 μm (E, G). Cell number in adrenal medulla (B), superior cervical ganglion (D), enteric ganglia (F), and dorsal root ganglion (H) in the same animal models. Data are presented as mean ± SEM (n = 4–7 per group).
I Immunofluorescence detection of GFAP expression in cross sections of peripheral sciatic nerve illustrating the normal shape of Schwann cells forming myelin sheaths in P15 control and hGFAP-SDHD mice. Scale bar: 50 μm.
J Results of quantitative RT–PCR to detect SdhD expression in the peripheral nerves of wild-type (flox/+) and mutant (flox/−, and flox/− cre) mice. Data are presented as mean ± SEM (n = 3 flox/+, n = 6 flox/−, and n = 8 flox/− cre mice). Statistical significance: *P ≤ 0.05; **P ≤ 0.01. The two-tailed Student’s t-test was applied.
K Number of myelin sheaths per unit area in sciatic nerves of P15 control and mutant mice. Data are presented as mean ± SEM (n = 4 mice for each genotype). See also Fig EV6.
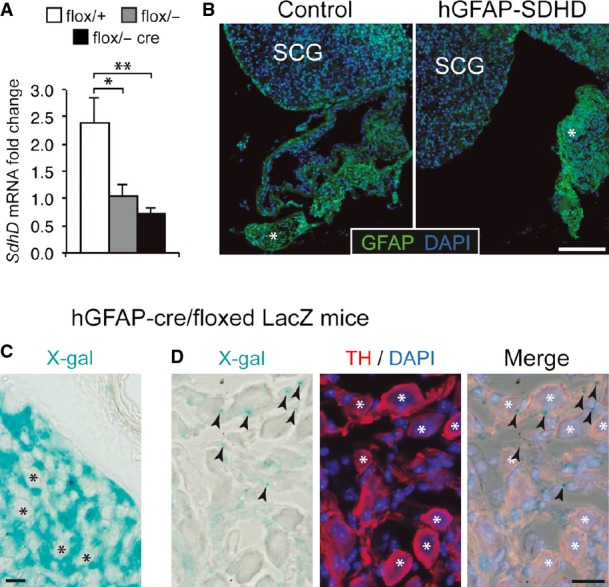
Results of quantitative RT–PCR to detect SdhD expression in the superior cervical ganglia of wild-type (flox/+) and mutant (flox/−, and flox/− cre) mice. Note the non-significant difference between flox/− (heterozygous) and flox/− cre mice, suggesting no major increase in deletion after GFAP-cre expression. Data are presented as mean ± SEM (n = 3–5 mice). Statistical significance: *P ≤ 0.05; **P ≤ 0.01. The ANOVA test with appropriate post hoc analysis was applied.
Superior cervical ganglion (SCG) sections from control or hGFAP-SDHD P15 mice, immunostained with GFAP antibody. Note the relatively low expression of GFAP in the adult SCG as compared to Schwann cells of nearby nerves (asterisk).
Intense X-gal staining (24 h) of an SCG section from an hGFAP-cre/floxed LacZ mouse, to label derivatives of GFAP+ cells. Note the absence of staining in the large sympathetic neurons of the organ (asterisks), indicating that they do not derive from hGFAP+ neural stem cells. Scale bar: 20 μm.
Mild X-gal staining (12 h) of an SCG section from an hGFAP-cre/floxed LacZ mouse, to label derivatives of GFAP+ cells. Large sympathetic neurons are stained with TH antibody (asterisks). Note that X-gal+ precipitates (arrowheads) are always outside the neuronal somas, confirming that these neurons do not derive from hGFAP+ neural stem cells. Scale bar: 20 μm.
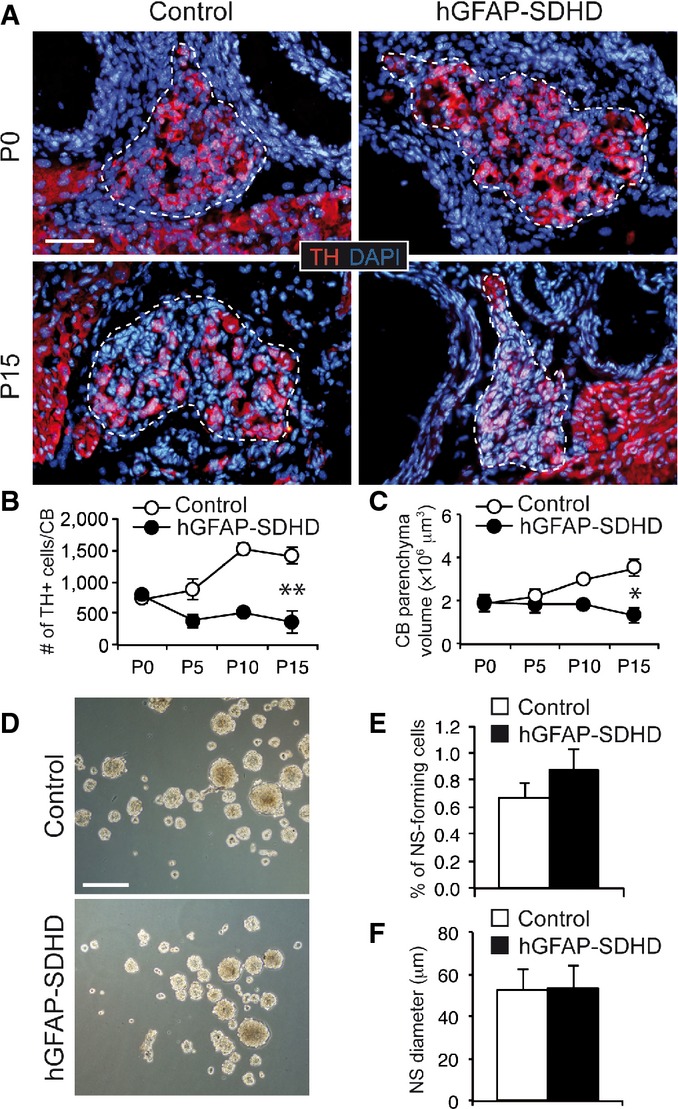
A Immunofluorescence detection of TH expression in newborn (P0) and P15 wild-type (control) and hGFAP-SDHD mouse carotid body (CB). Boundaries of the CB parenchyma are indicated by the dotted lines. Scale bar: 50 μm.
B, C Number of TH+ cells (B) and size (C) per CB at different ages in control and hGFAP-SDHD mice. Data are presented as mean ± SEM (n = 3–5 mice in each group). *P ≤ 0.05; **P ≤ 0.01. The two-tailed Student’s t-test was applied.
D Bright-field images of CB neurospheres obtained from control and mutant mice at P15. Scale bar: 200 μm.
E, F Neurosphere forming efficiency (E) and diameter (F) of floating cultures of dispersed CB cells from P15 control and hGFAP-SDHD mice. Data are presented as mean ± SEM (n = 6 cultures/mice for each genotype).
References
-
- Suda T, Takubo K, Semenza GL. Metabolic regulation of hematopoietic stem cells in the hypoxic niche. Cell Stem Cell. 2011;9:298–310. - PubMed
-
- Xu X, Duan S, Yi F, Ocampo A, Liu GH, Izpisua Belmonte JC. Mitochondrial regulation in pluripotent stem cells. Cell Metab. 2013;18:325–332. - PubMed
-
- Mohyeldin A, Garzon-Muvdi T, Quinones-Hinojosa A. Oxygen in stem cell biology: a critical component of the stem cell niche. Cell Stem Cell. 2010;7:150–161. - PubMed
Publication types
MeSH terms
Substances
LinkOut - more resources
Full Text Sources
Other Literature Sources
