. 2015 Sep 22;10(9):e0138437.
doi: 10.1371/journal.pone.0138437. eCollection 2015.

FXN Promoter Silencing in the Humanized Mouse Model of Friedreich Ataxia

Affiliations

FXN Promoter Silencing in the Humanized Mouse Model of Friedreich Ataxia

Yogesh K Chutake et al. PLoS One. .

Abstract

Background: Friedreich ataxia is caused by an expanded GAA triplet-repeat sequence in intron 1 of the FXN gene that results in epigenetic silencing of the FXN promoter. This silencing mechanism is seen in patient-derived lymphoblastoid cells but it remains unknown if it is a widespread phenomenon affecting multiple cell types and tissues.

Methodology / principal findings: The humanized mouse model of Friedreich ataxia (YG8sR), which carries a single transgenic insert of the human FXN gene with an expanded GAA triplet-repeat in intron 1, is deficient for FXN transcript when compared to an isogenic transgenic mouse lacking the expanded repeat (Y47R). We found that in YG8sR the deficiency of FXN transcript extended both upstream and downstream of the expanded GAA triplet-repeat, suggestive of deficient transcriptional initiation. This pattern of deficiency was seen in all tissues tested, irrespective of whether they are known to be affected or spared in disease pathogenesis, in both neuronal and non-neuronal tissues, and in cultured primary fibroblasts. FXN promoter function was directly measured via metabolic labeling of newly synthesized transcripts in fibroblasts, which revealed that the YG8sR mouse was significantly deficient in transcriptional initiation compared to the Y47R mouse.

Conclusions / significance: Deficient transcriptional initiation accounts for FXN transcriptional deficiency in the humanized mouse model of Friedreich ataxia, similar to patient-derived cells, and the mechanism underlying promoter silencing in Friedreich ataxia is widespread across multiple cell types and tissues.


Conflict of interest statement

Competing Interests: The authors have declared that no competing interests exist.

Figures

Fig 1
Fig 1. FXN transcriptional deficiency in the YG8sR mouse extends both upstream and downstream of the expanded GAA-TR mutation.
(A) Relevant portions of the FXN gene are depicted schematically, with the GAA-TR mutation in intron 1, the FXN transcriptional start site (arrow) at position -59 relative to the initiation codon (“A” in ATG as +1), the three CpG sites in intron 1 used for DNA methylation analysis (relative to the first “G” in the GAA-TR sequence). Quantitative RT-PCR was performed to measure FXN transcript both upstream (Ex1; immediately downstream of the transcriptional start site) and downstream (Ex3-Ex4) of the GAA-TR mutation. Amplicons used for measuring the length of the GAA-TR sequence (GAA-PCR) and for methylation sensitive—high resolution melting (MS-HRM) are also depicted. Solid lines above the gene depict the shorter predicted FXN transcripts caused by defects in transcriptional elongation through the expanded GAA-TR mutation and by deficient transcriptional initiation due to FXN promoter silencing. Deficiency of transcript at both upstream and downstream locations would suggest a defect in transcriptional initiation, and deficiency of only Ex3-Ex4 would suggest a defect in transcriptional elongation. (B) PCR analysis to measure the length of the GAA-TR sequence in intron 1 of the FXN gene in various tissues from Y47R and YG8sR mice (for each tissue, the paired samples depict Y47R and YG8sR in the left and right lanes, respectively). The precise length of the GAA-9 product from Y47R fibroblasts and the GAA-133 product from YG8sR fibroblasts were determined by direct sequencing, which also showed that the repeat tract was pure (i.e., absence of non-GAA repeat sequence). (C, D) Quantitative RT-PCR showing deficiency of FXN transcript in 1-month-old YG8sR mouse tissues compared to Y47R, both upstream (Ex1) and downstream (Ex3-Ex4) of the expanded GAA-TR sequence. (E) Quantitative RT-PCR showing deficiency of FXN transcript in fibroblasts from YG8sR compared to Y47R, both upstream (Ex1) and downstream (Ex3-Ex4) of the expanded GAA-TR sequence. (F, G) Quantitative RT-PCR showing deficiency of FXN transcript in 12-month-old YG8sR mouse tissues compared to Y47R, both upstream (Ex1) and downstream (Ex3-Ex4) of the expanded GAA-TR sequence. CBR = cerebrum; CBL = cerebellum; DRG = dorsal root ganglia; SkM = skeletal muscle. Data shown in panels C through G represent three complete experiments using tissues isolated from two YG8sR and two Y47R individuals. Error bars represent +/-SEM. ** = p<0.01, *** = p<0.001.
Fig 2
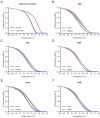
Fig 2. Increased DNA methylation at the FXN locus in the 1-month-old YG8sR mouse.
(A) Normalized melting curves in a high resolution melting (HRM) assay of two reference double-stranded templates simulating 100% (red curve) and 0% (blue curve) DNA methylation at three CpG sites upstream of the GAA-TR mutation (see Fig 1A) showing a clear separation of the curves indicating that the HRM assay is able to detect methylation at the three CpG sites. (B) Normalized melting curves in a methylation sensitive—high resolution melting (MS-HRM) assay to detect CpG methylation in lymphoblastoid cell lines from three FRDA (red curve) and three non-FRDA control subjects (blue curve) at the three CpG sites upstream of the GAA-TR mutation (see Fig 1A) showing a clear separation of the curves indicating that the MS-HRM assay is able to detect a relative increase in methylation at the three CpG sites. (C-H) Normalized melting curves in a MS-HRM assay to detect CpG methylation in fibroblast cell lines and multiple tissues from 1-month-old YG8sR (red curves) and Y47R (blue curves) mice at the three CpG sites upstream of the GAA-TR mutation (see Fig 1A) showing a clear separation of the curves indicating a relative increase in methylation at the three CpG sites in YG8sR tissues and fibroblasts. For all HRM curves, X-axis = melting temperature, Y-axis = relative fluorescence, and error bars represent 95% confidence intervals at each of 15 points assayed in triplicate for fluorescence per°C change. LBCLs = lymphoblastoid cell lines; CBR = cerebrum; CBL = cerebellum; DRG = dorsal root ganglia; SkM = skeletal muscle.
Fig 3
Fig 3. Increased DNA methylation at the FXN locus in the 12-month-old YG8sR mouse.
(A) Normalized melting curves in a high resolution melting (HRM) assay of two reference double-stranded templates simulating 100% (red curve) and 0% (blue curve) DNA methylation at three CpG sites upstream of the GAA-TR mutation (see Fig 1A) showing a clear separation of the curves indicating that the HRM assay is able to detect methylation at the three CpG sites. (B-F) Normalized melting curves in a MS-HRM assay to detect CpG methylation in multiple tissues from 12-month-old YG8sR (red curves) and Y47R (blue curves) mice at the three CpG sites upstream of the GAA-TR mutation (see Fig 1A) showing a clear separation of the curves indicating a relative increase in methylation at the three CpG sites in YG8sR tissues. For all HRM curves, X-axis = melting temperature, Y-axis = relative fluorescence, and error bars represent 95% confidence intervals at each of 15 points assayed in triplicate for fluorescence per°C change. CBR = cerebrum; CBL = cerebellum; DRG = dorsal root ganglia; SkM = skeletal muscle.
Fig 4
Fig 4. Metabolic labeling of nascent FXN transcript in primary fibroblasts showing deficiency of transcriptional initiation in the YG8sR mouse.
(A, B) Quantitative RT-PCR of metabolically labeled nascent transcript for the indicated incubation times (1, 2 and 4 hours) is shown for FXN mRNA upstream (“Ex1” in Fig 1A) and downstream (“Ex3-Ex4” in Fig 1A) of the GAA-TR sequence in intron 1. YG8sR cells showed 2.0–3.4 fold less nascent FXN transcript (exact fold changes are indicated) compared with Y47R cells at all the time points assayed. Graphs represent cumulative data from four independent metabolic labeling experiments. Error bars represent +/-SEM. * = p<0.05; ** = p<0.01, *** = p<0.001.

References

    1. Bidichandani SI, Delatycki MB. Friedreich Ataxia. In: Pagon RA, Adam MP, Ardinger HH, Wallace SE, Amemiya A, Bean LJH, et al., editors. GeneReviews(R). Seattle (WA)1993 [updated 2014]. - PubMed
    1. Campuzano V, Montermini L, Molto MD, Pianese L, Cossee M, Cavalcanti F, et al. Friedreich's ataxia: autosomal recessive disease caused by an intronic GAA triplet repeat expansion. Science. 1996;271(5254):1423–7. - PubMed
    1. Bidichandani SI, Ashizawa T, Patel PI. The GAA triplet-repeat expansion in Friedreich ataxia interferes with transcription and may be associated with an unusual DNA structure. Am J Hum Genet. 1998;62(1):111–21. - PMC - PubMed
    1. Colin F, Martelli A, Clemancey M, Latour JM, Gambarelli S, Zeppieri L, et al. Mammalian frataxin controls sulfur production and iron entry during de novo Fe4S4 cluster assembly. J Am Chem Soc. 2013;135(2):733–40. 10.1021/ja308736e - DOI - PubMed
    1. Bridwell-Rabb J, Fox NG, Tsai CL, Winn AM, Barondeau DP. Human frataxin activates Fe-S cluster biosynthesis by facilitating sulfur transfer chemistry. Biochemistry. 2014;53(30):4904–13. 10.1021/bi500532e - DOI - PMC - PubMed

Publication types

MeSH terms

Substances