. 2015 Sep;56(10):6007-18.
doi: 10.1167/iovs.15-17174.

Molecular Heterogeneity Within the Clinical Diagnosis of Pericentral Retinal Degeneration

Molecular Heterogeneity Within the Clinical Diagnosis of Pericentral Retinal Degeneration

Rodrigo Matsui et al. Invest Ophthalmol Vis Sci. 2015 Sep.

Abstract

Purpose: To characterize in detail the phenotype and genotype of patients with pericentral retinal degeneration (PRD).

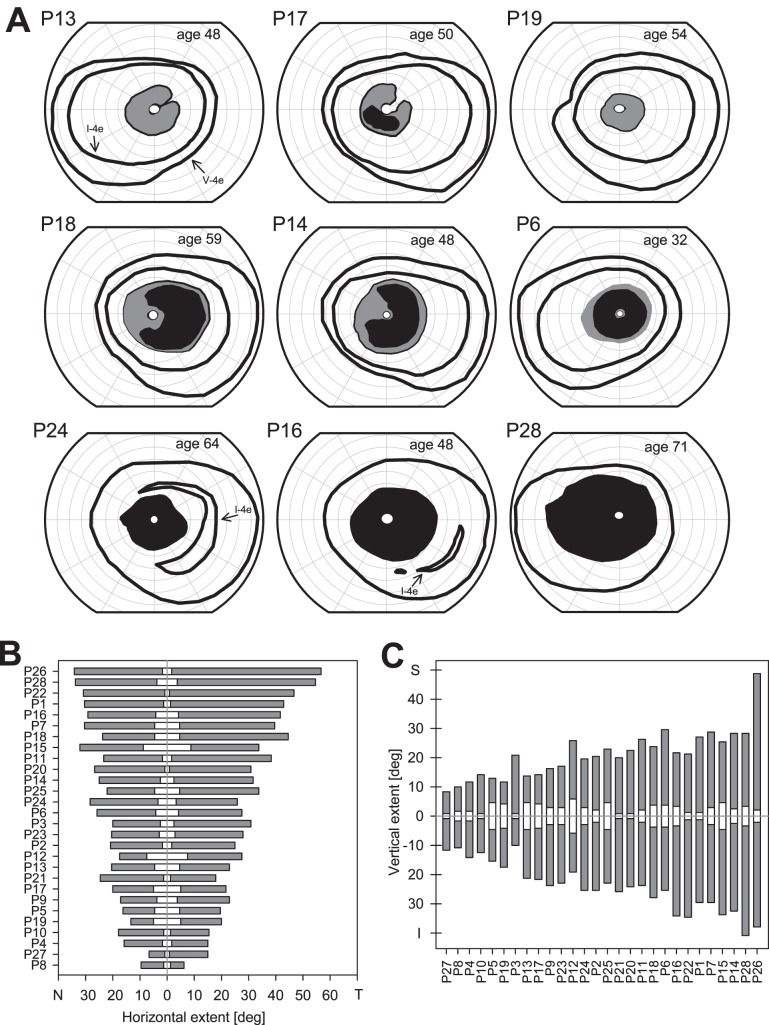
Methods: Patients were screened for an annular ring scotoma ranging from 3° to 40° (n = 28, ages 24-71) with kinetic perimetry. All patients had pigmentary retinopathy in the region of the dysfunction. Further studies included cross-sectional and en face imaging, static chromatic perimetry, and electroretinography. Molecular screening was performed.

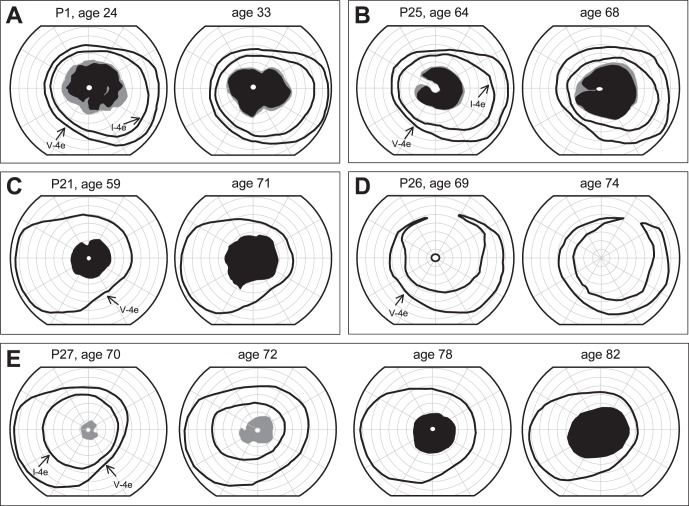
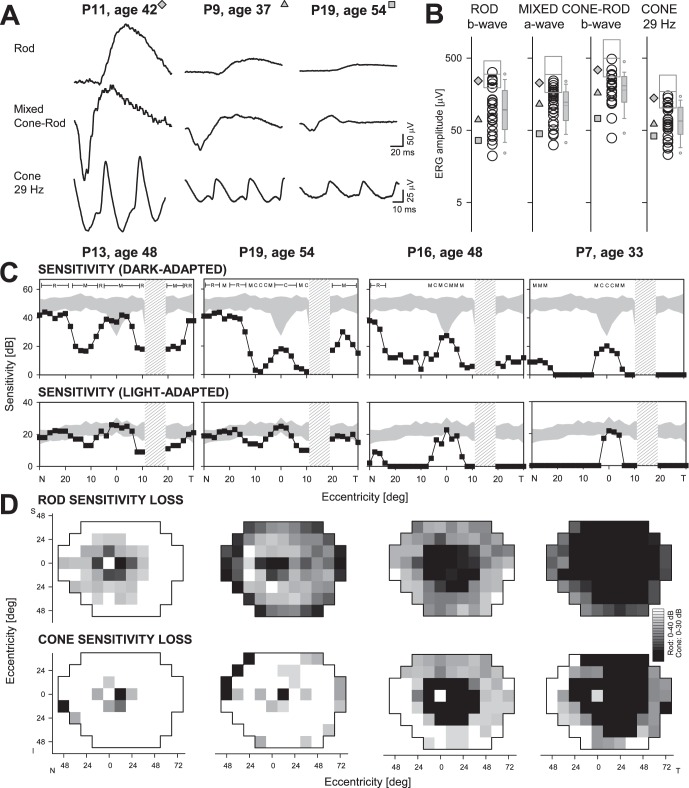
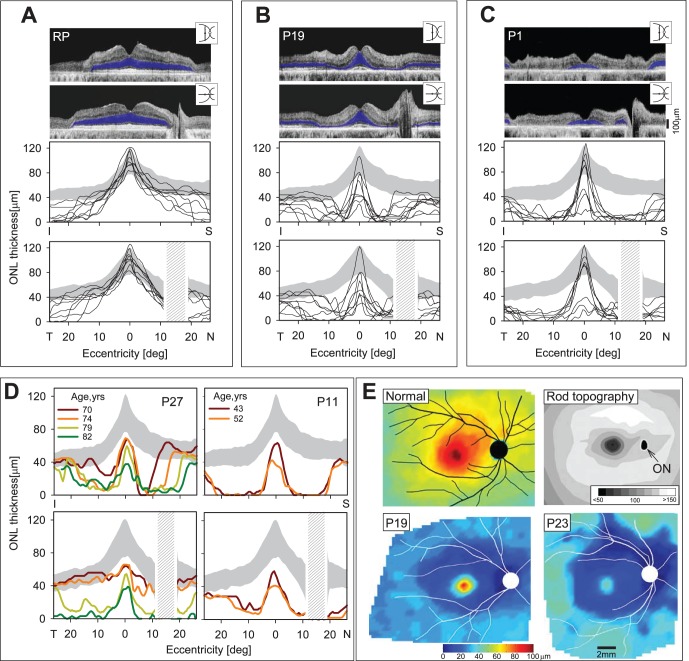
Results: Genotypes of 14 of 28 PRD patients were identified: There were mutations in eight different genes previously associated with autosomal dominant or autosomal recessive RDs. Kinetic fields monitored in some patients over years to more than a decade could be stable or show increased extent of the scotoma. Electroretinograms were recordable but with different severities of dysfunction. Patterns of photoreceptor outer nuclear layer (ONL) loss corresponded to the distribution of visual dysfunction. Outer nuclear layer thickness topography and en face imaging indicated that the greatest disease expression was in the area of known highest rod photoreceptor density.

Conclusions: Molecular heterogeneity was a feature of the PRD phenotype. Many of the molecular causes were also associated with other phenotypes, such as maculopathies, typical retinitis pigmentosa (RP) and cone-rod dystrophy. The pericentral pattern of retinal degeneration is thus confirmed to be an uncommon phenotype of many different genotypes rather than a distinct disease entity.


Figures

Figure 1
Figure 1
Kinetic visuals fields in patients with pericentral RD. (A) Kinetic visual fields using V- and I-4e test targets in one eye of nine representative PRD patients. P28 did not detect the I-4e target whereas the other patients shown had measurable fields with both target sizes. Gray areas: relative scotomas; black areas: absolute scotomas. (B) Horizontal (nasal and temporal field) extent of the pericentral scotomas (gray) and of the central island of vision (white) within the scotoma for the entire cohort of pericentral RP patients. Patient numbers (Table) are along the left vertical axis. (C) Vertical extent (superior and inferior field) of the pericentral scotomas (gray) and of the central island (white) within the scotoma for these patients. Patient numbers are along the lower horizontal axis of the graph.
Figure 2
Figure 2
Serial kinetic fields in pericentral RD. (AE) Longitudinal kinetic field data in five pericentral RD patients showing responses to V-4e and I-4e targets. Gray areas: relative scotomas; black areas: absolute scotomas.
Figure 3
Figure 3
Rod and cone function in pericentral RD. (A) Representative ERG waveforms from three PRD patients with different degrees of retinal dysfunction. (B) Four measured ERG parameters in the 22 patients with recordings. The three gray symbols to the left correspond to patients whose waveforms are shown in (A). In the center of each parameter column are all patient data (circles) and a box defining ±2 SD and the mean normal. To the right in each column is a boxplot summarizing the data for the patient group, indicating interquartile range (gray box), 10/90th percentiles (error bars), 5/95th percentiles (symbols above and below), median (thicker line within box) and mean (thin line). (C) Dark-adapted (500 nm, top) and light-adapted (600 nm, bottom) horizontal sensitivity profiles in four pericentral RP patients (square filled symbols connected by lines) compared with normal data (shaded area, ±2 SD from mean). For dark-adapted sensitivities, photoreceptor mediation based on two-color (500 nm, 650 nm) testing, is shown above the results: R, rod-mediated; M, mixed rod- and cone-mediated; C, cone-mediated. Hatched bar: physiologic blind spot. (D) Maps of rod sensitivity loss (500 nm dark-adapted, top) and cone sensitivity loss (600 nm light-adapted, bottom) in the same four patients. Gray scale has 16 levels, representing 0- to 40-dB losses for rods and 0- to 30-dB losses for cones. Black square: physiologic blind spot represented at 12° in the temporal field. N, nasal; T, temporal; I, inferior; S, superior visual field.
Figure 4
Figure 4
Retinal laminar architecture in patients with pericentral RD. (AC) Cross-sectional OCT images along the vertical and horizontal meridians through the fovea in a 58-year-old patient with RP simplex (A) compared with P19 (B) and P1 (C), two patients with PRD. Outer nuclear layer is highlighted in blue in the scans (top). Vertical (middle) and horizontal (bottom) thickness profiles of ONL in eight patients with RP or Usher syndrome (A) and 20 PRD patients (B, C) are shown. Gray areas: normal limits (±2 SD from mean). (D) Serial ONL thickness profiles along the vertical and horizontal meridians in P27 and P11, two PRD patients. Gray areas: normal limits (±2 SD from mean). (E) Topographic map of ONL thickness in a 45-year-old woman with normal vision (top, left). For reference, topography of rod photoreceptor density in the human retina (reprinted and modified from Curcio CA, Sloan KR, Kaline RE, Hendrickson AE. Human photoreceptor topography. J Comp Neurol. 1990; 292:497–523; top, right). Lighter intensities correspond to higher spatial densities and darker intensities to lower densities (intensity bar is in rod cells X 1000/mm2). Black oval: optic nerve (ON) head. Outer nuclear layer thickness topography in two PRD patients, P19 and P23 (bottom left and right, respectively). Traces of major blood vessels and location of optic nerve head are overlaid on each map (depicted as right eyes).
Figure 5
Figure 5
Digitally-stitched wide-field near-infrared (NIR) reduced-illuminance autofluorescence imaging (RAFI) results of a representative healthy subject compared with five patients with pericentral RD. Upper insets: short-wavelength (SW) RAFI; lower insets: NIR reflectance (REF) images in the same eyes. (A) Near-infrared–RAFI of the 16-year-old normal subject demonstrates higher signal near the fovea smoothly transitioning to a lower signal in the pericentral and midperipheral regions. Blood vessels and the optic nerve appear dark. Short-wavelength–RAFI shows central depression corresponding to the macular pigment absorption. (BF) Near-infrared–RAFI of pericentral RD patients P6, P12, P16, P19, and P11 demonstrate an annular region (arrowheads) of greater visibility of choroidal pattern of blood vessels implying depigmentation of the RPE and greater penetration of excitation light to choroidal layers. This region is bounded centrally by a relatively preserved macular region with or without regions of atrophy, and a relatively preserved peripheral region beyond the eccentricity of the optic nerve head. Near-infrared–REF images (lower insets) show locally increased reflectivity corresponding to the regions of greater choroidal visibility. Macular SW-RAFI images (upper insets) demonstrate that some of the pericentral demelanization corresponds to RPE atrophy, whereas others retain RPE lipofuscin signal. All images are shown as equivalent right eyes and contrast stretched for visibility of features. Pair of calibrations shown in (F) apply to all panels; both upper and lower insets are displayed at the same magnification.

References

    1. Grover S,, Fishman GA,, Brown J,, Jr. Patterns of visual field progression in patients with retinitis pigmentosa. Ophthalmology. 1998; 105: 1069–1075. - PubMed
    1. Gonin J. Le scotome annulaire dans la dégénérescence pigmentaire de la rétine. Ann d'Ocul. 1901; 125: 101–130.
    1. Francois J,, De Rouck A,, Cambie E,, De Laey JJ. Visual functions in pericentral and central pigmentary retinopathy. Ophthalmologica. 1972; 165: 38–61. - PubMed
    1. Krill AE. Central and Pericentral Retinitis Pigmentosa. Krill's Hereditary Retinal and Choroidal Diseases Volume 2. Hagerstown: Harper & Row Publishing Co.; 1977.
    1. Szamier RB,, Berson EL. Histopathologic study of an unusual form of retinitis pigmentosa. Invest Ophthalmol Vis Sci. 1982; 22: 559–570. - PubMed

Publication types

MeSH terms