. 2015 Sep 22;10(9):e0138440.
doi: 10.1371/journal.pone.0138440. eCollection 2015.

Severe Nephrotoxic Nephritis following Conditional and Kidney-Specific Knockdown of Stanniocalcin-1

Affiliations

Severe Nephrotoxic Nephritis following Conditional and Kidney-Specific Knockdown of Stanniocalcin-1

Luping Huang et al. PLoS One. .

Abstract

Background: Inflammation is the hallmark of nephrotoxic nephritis. Stanniocalcin-1 (STC1), a pro-survival factor, inhibits macrophages, stabilizes endothelial barrier function, and diminishes trans-endothelial migration of leukocytes; consistently, transgenic (Tg) overexpression of STC1 protects from nephrotoxic nephritis. Herein, we sought to determine the phenotype of nephrotoxic nephritis after conditional and kidney-specific knockdown of STC1.

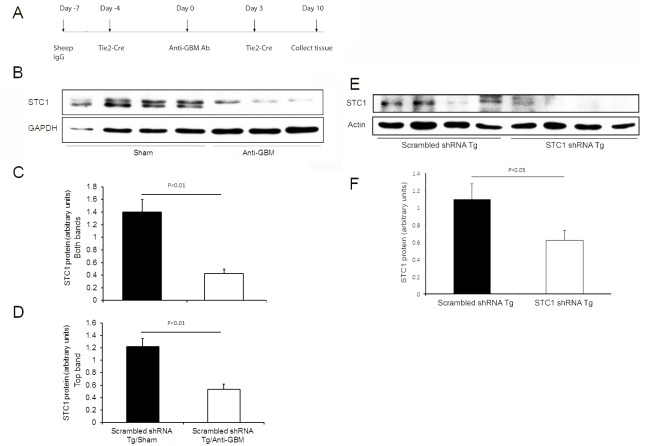
Methods: We used Tg mice that, express either STC1 shRNA (70% knockdown of STC1 within 4d) or scrambled shRNA (control) upon delivery of Cre-expressing plasmid to the kidney using ultrasound microbubble technique. Sheep anti-mouse GBM antibody was administered 4d after shRNA activation; and mice were euthanized 10 days later for analysis.

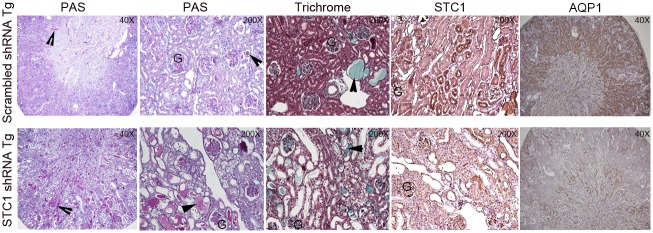
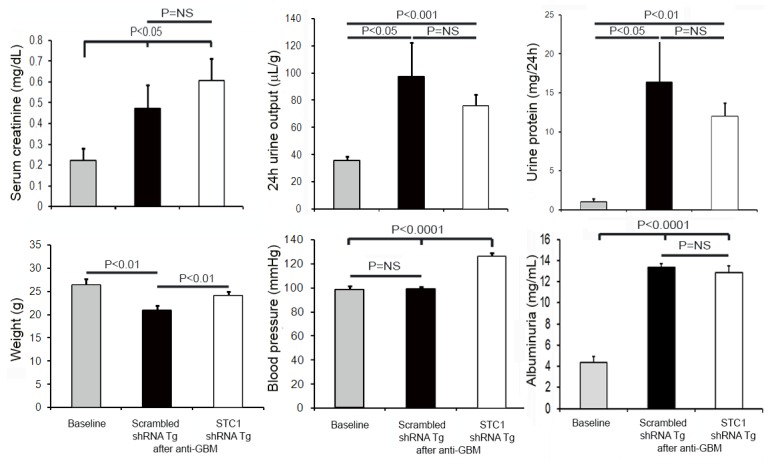
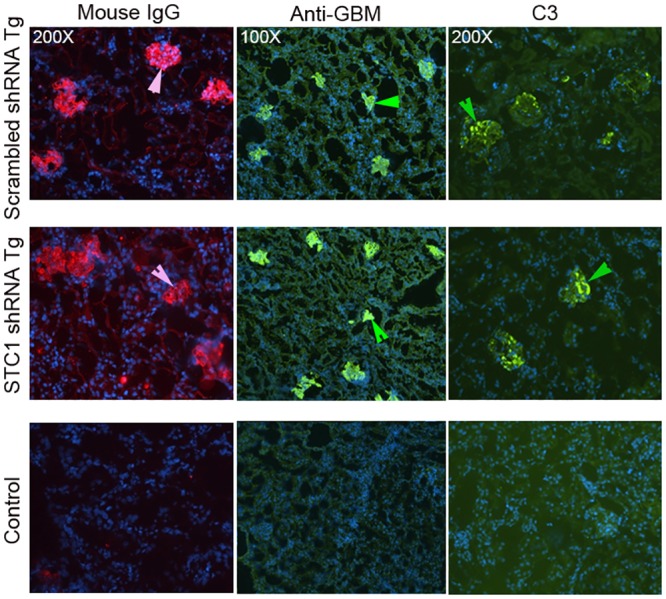
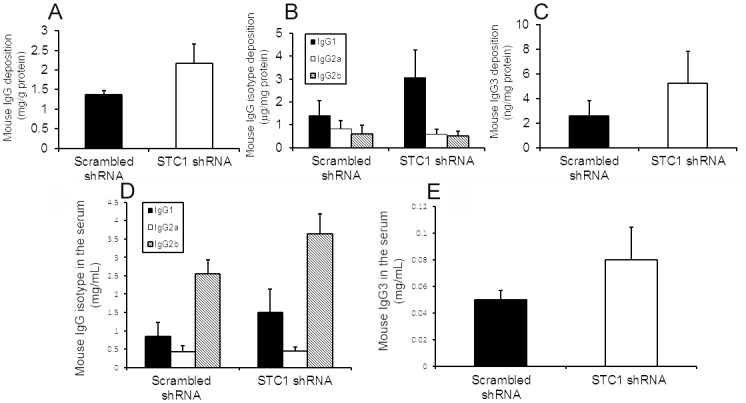
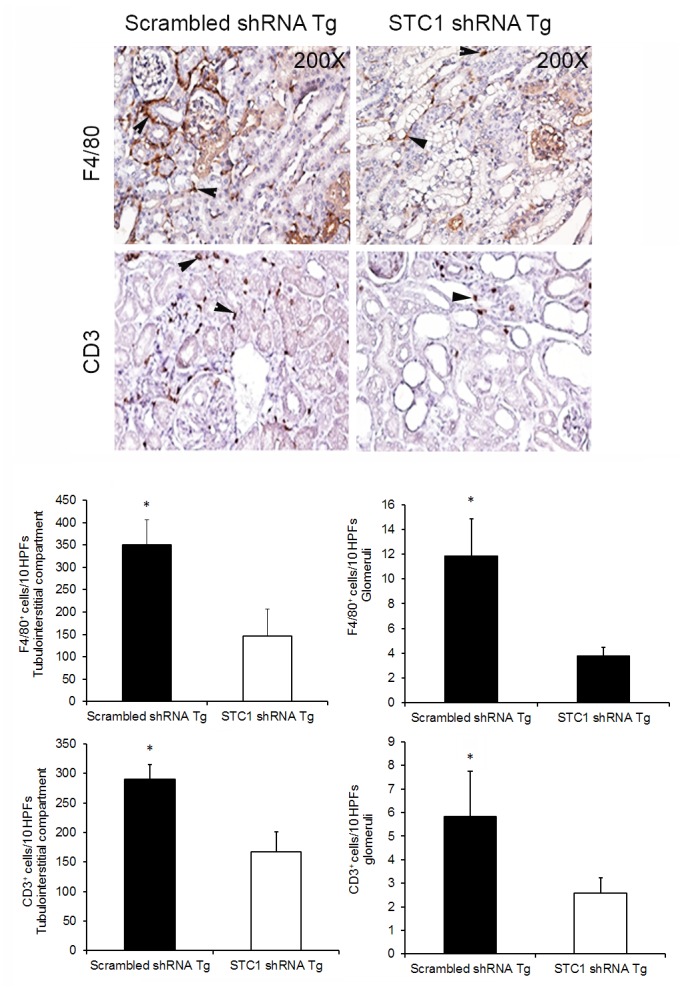
Results: Serum creatinine, proteinuria, albuminuria and urine output were similar 10 days after anti-GBM delivery in both groups; however, anti-GBM antibody delivery to mice with kidney-specific knockdown of STC1 produced severe nephrotoxic nephritis, characterized by severe tubular necrosis, glomerular hyalinosis/necrosis and massive cast formation, while control mice manifested mild tubular injury and crescentic glomerulonephritis. Surprisingly, the expression of cytokines/chemokines and infiltration with T-cells and macrophages were also diminished in STC1 knockdown kidneys. Staining for sheep anti-mouse GBM antibody, deposition of mouse C3 and IgG in the kidney, and antibody response to sheep IgG were equal.

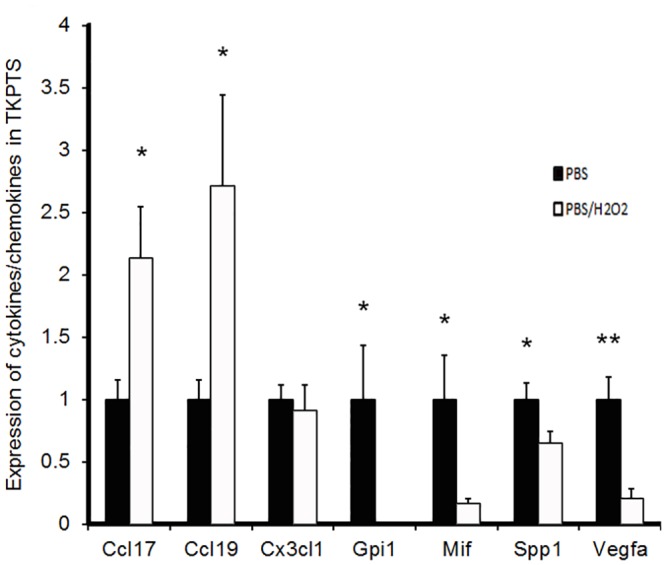
Conclusions: nephrotoxic nephritis after kidney-specific knockdown of STC1 is characterized by severe tubular and glomerular necrosis, possibly due to loss of STC1-mediated pro-survival factors, and we attribute the paucity of inflammation to diminished release of cytokines/chemokines/growth factors from the necrotic epithelium.


Conflict of interest statement

Competing Interests: The authors have declared that no competing interests exist.

Figures

Fig 1
Fig 1
A. Timeline of nephrotoxic nephritis experiment. B. Representative Western blot depicting STC1 and GAPDH expression in control kidneys 10 days after the administration of anti-GBM or sham. C & D. Bar graphs represent the mean ± SEM of STC1 protein/GAPDH in control kidneys 10 days after the administration of anti-GBM (n = 3) or sham (n = 4); C, quantitation of both STC1 protein bands relative to GAPDH; D, quantitation of top STC1 protein band relative to GAPDH. E. Representative Western blot depicting STC1 and actin expression in the kidneys of STC1 shRNA Tg and scrambled shRNA Tg mice, 10 days after the administration of anti-GBM antibody. F. Bar graph represents the mean ± SEM of STC1 protein/actin in the kidneys of STC1 shRNA Tg and scrambled shRNA Tg mice, 10 days after the administration of anti-GBM antibody (n = 4).
Fig 2
Fig 2. Kidney morphology, fibrosis and the expression of STC1 and AQP1 after nephrotoxic nephritis in STC1 knockdown kidneys (STC1 shRNA Tg), compared with control kidneys (scrambled shRNA Tg).
Kidney tissue was harvested 10 days after the administration of anti-GBM antibody and stained with Periodic Acid Schiff’s (PAS), Masson’s trichrome, STC1 and AQP1; 40X-200X magnification. Arrowheads point to casts; G, denotes glomerulus.
Fig 3
Fig 3. Serum creatinine, urine output, urine protein, albuminuria, weight and blood pressure after nephrotoxic nephritis in STC1 knockdown (STC1 shRNA Tg) compared with control mice (scrambled shRNA Tg).
Following nephrotoxic nephritis and compared to baseline, serum creatinine was numerically higher in STC1 knockdown kidneys relative to controls (3-fold vs. 2.5-fold); urine output and proteinuria where numerically lower (2.1-fold vs. 2.85-fold and 12-fold vs. 17-fold, respectively), but the differences between the groups were not statistically significant; albuminuria was increased to a similar degree. Blood pressure and weight were higher following nephrotoxic nephritis in STC1 knockdown kidneys compared to control kidneys.
Fig 4
Fig 4. Equal binding of sheep IgG to GBM, and deposition of mouse IgG and C3 in STC1 knockdown kidneys and control kidneys.
Ten days after anti-GBM Ab injection, kidney sections were labeled with: rabbit anti-mouse IgG antibodies; rabbit anti-sheep IgG antibodies; or rabbit anti-mouse C3 antibodies. Equal staining for sheep anti-mouse GBM antibody and deposition of mouse IgG and C3 in both STC1 knockdown and control kidneys is illustrated; representative images are shown; 100X-200X magnification. Arrowheads point to glomeruli; lower panels show negative staining in wild type kidneys (control).
Fig 5
Fig 5. Equal deposition of mouse IgG and IgG isotypes after nephrotoxic nephritis in STC1 knockdown and control kidneys.
Bar graphs depict eluted mouse IgG (A) and IgG isotypes (B & C) from STC1 knockdown and control kidneys after nephrotoxic nephritis. Data represent the means ± SEM of 7 independent determinations for STC1 shRNA Tg and 5 independent determinations for scrambled shRNA Tg. Equal mouse antibody response to sheep IgG after nephrotoxic nephritis in STC1 knockdown and control mice. Bar graphs depict mouse serum IgG isotypes (D & E) after nephrotoxic nephritis in STC1 knockdown and control mice. Data represent the means ± SEM of 7 independent determinations for STC1 shRNA Tg and 5 independent determinations for scrambled shRNA Tg.
Fig 6
Fig 6. Diminished infiltration with macrophages and T-cells after nephrotoxic nephritis in STC1 knockdown kidneys, compared with controls.
Top panels show representative images for F4/80+ (macrophages and dendritic cells) and CD3+ (lymphocytes) staining; arrowheads point to positively stained cells; 200X magnification. Bar graphs depict macrophage and T-cell count in the glomeruli and interstitial compartment (see methods); data represent the means and ± SEM of 5–7 independent determinations. *, P<0.05.
Fig 7
Fig 7. Differential expression of cytokines/chemokines/growth factors by proximal tubule cells in response to H2O2 stress.
Immortalized mouse proximal tubules cells (TKPTS) were treated with vehicle or H2O2; mRNA for select cytokines/chemokines (CCL17, CCL19, CX3CL1 and Mif) and growth factors (Gpi1, Spp1 and VEGF) were quantitated using RT-PCR (see methods). Data are normalized to actin, and represent the mean ± SEM of 6 independent determinations. *, P<0.05; **, P<0.01.

References

    1. De Niu P, Radman DP, Jaworski EM, Deol H, Gentz R, Su J, et al. (2000) Development of a human stanniocalcin radioimmunoassay: serum and tissue hormone levels and pharmacokinetics in the rat. Mol Cell Endocrinol 162: 131–144. - PubMed
    1. Jellinek DA, Chang AC, Larsen MR, Wang X, Robinson PJ, Reddel RR (2000) Stanniocalcin 1 and 2 are secreted as phosphoproteins from human fibrosarcoma cells. Biochem J 350 Pt 2: 453–461. - PMC - PubMed
    1. Luo CW, Kawamura K, Klein C, Hsueh AJ (2004) Paracrine regulation of ovarian granulosa cell differentiation by stanniocalcin (STC) 1: mediation through specific STC1 receptors. Mol Endocrinol 18: 2085–2096. - PubMed
    1. McCudden CR, James KA, Hasilo C, Wagner GF (2002) Characterization of mammalian stanniocalcin receptors. Mitochondrial targeting of ligand and receptor for regulation of cellular metabolism. J Biol Chem 277: 45249–45258. - PubMed
    1. Sazonova O, James KA, McCudden CR, Segal D, Talebian A, Wagner GF (2008) Stanniocalcin-1 secretion and receptor regulation in kidney cells. Am J Physiol Renal Physiol 294: F788–F794. 10.1152/ajprenal.00553.2007 - DOI - PubMed

Publication types

MeSH terms

LinkOut - more resources