. 2015 Sep 17;16(9):22509-26.
doi: 10.3390/ijms160922509.

Mitochondrial Optic Atrophy (OPA) 1 Processing Is Altered in Response to Neonatal Hypoxic-Ischemic Brain Injury

Affiliations

Mitochondrial Optic Atrophy (OPA) 1 Processing Is Altered in Response to Neonatal Hypoxic-Ischemic Brain Injury

Ana A Baburamani et al. Int J Mol Sci. .

Abstract

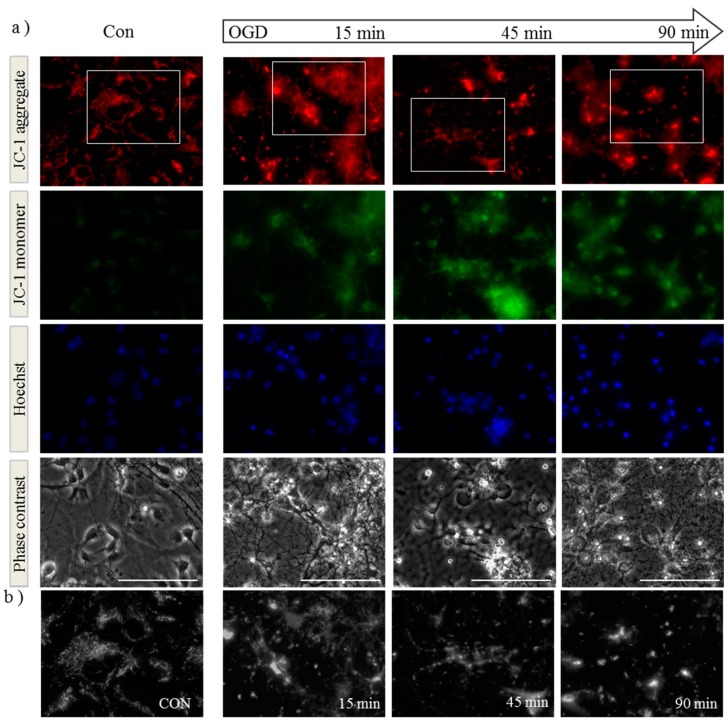
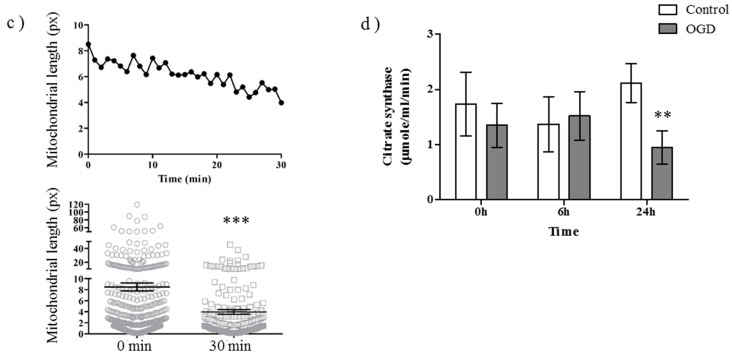
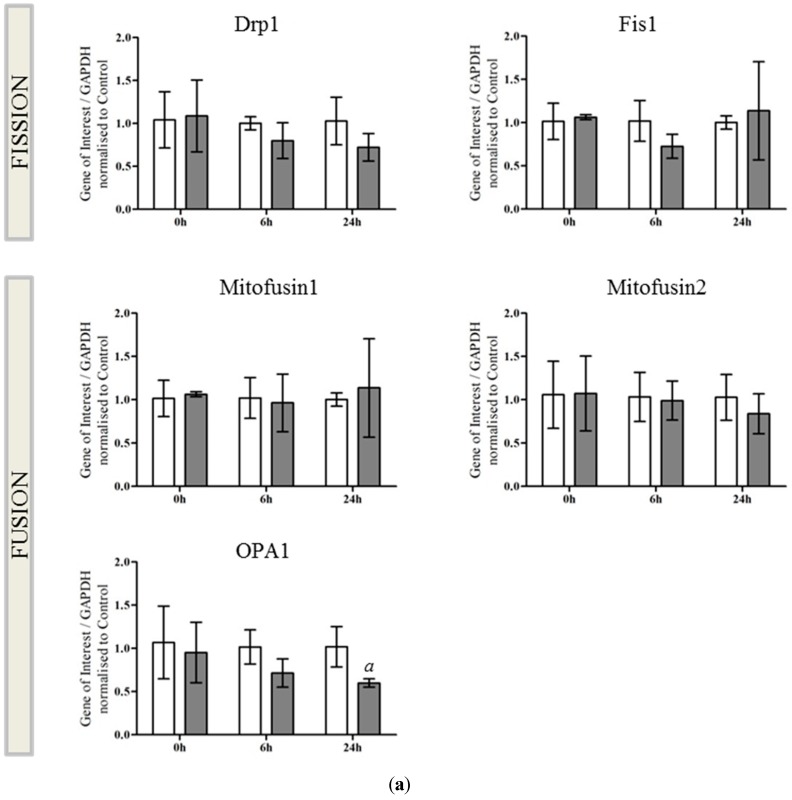
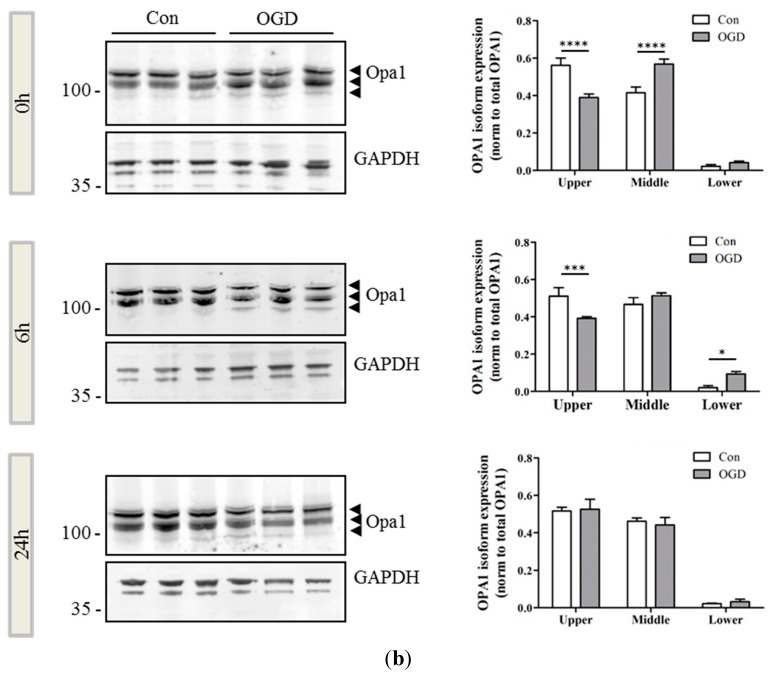
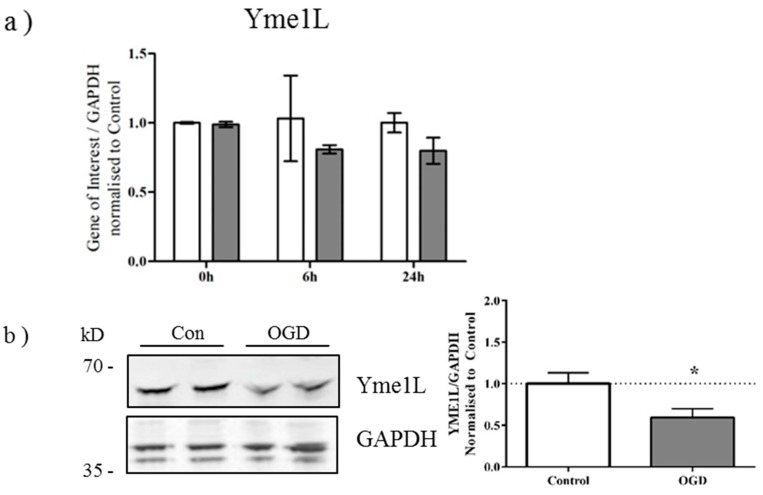
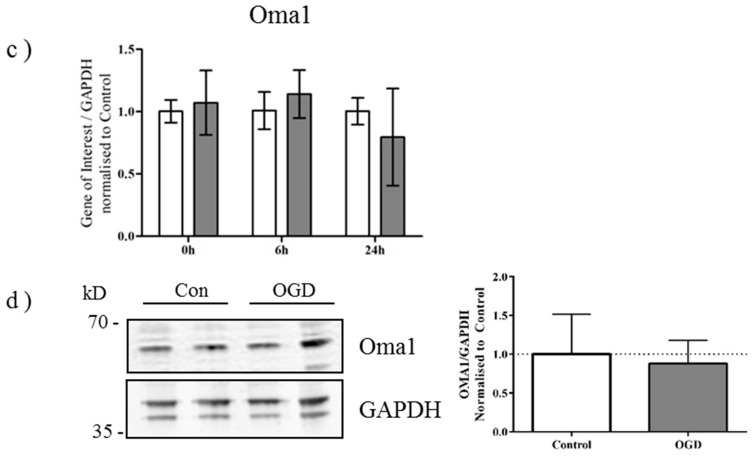
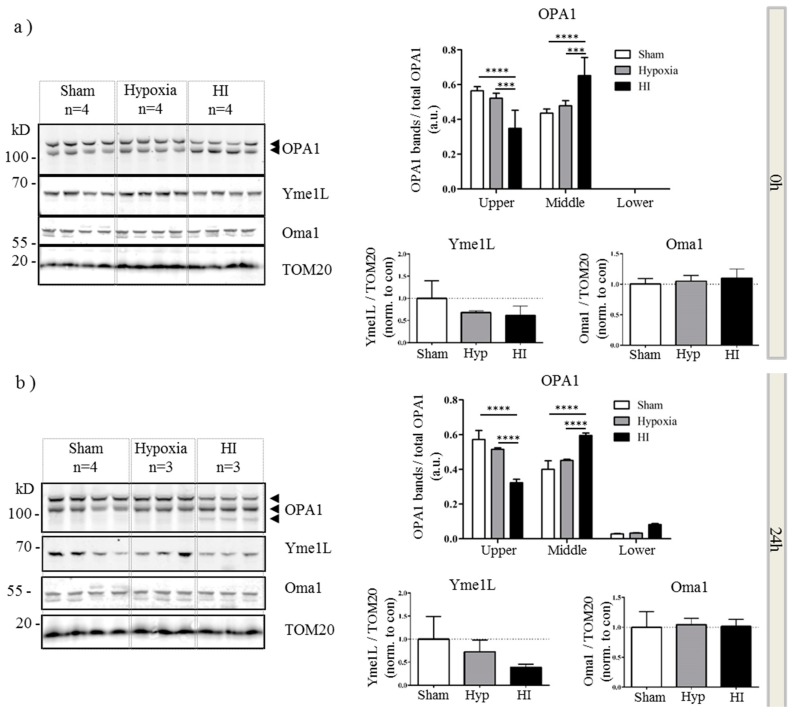
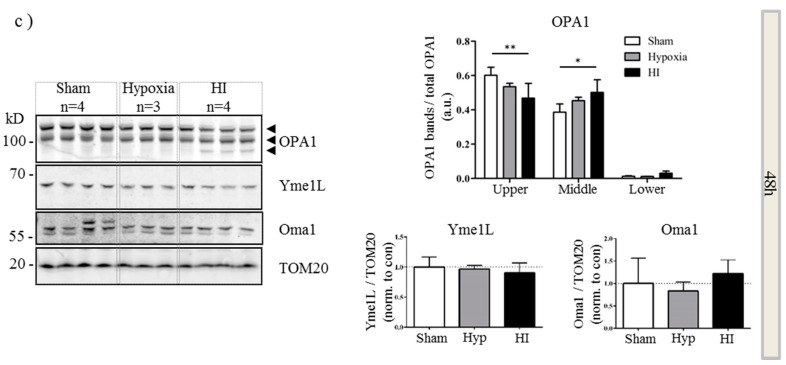
Perturbation of mitochondrial function and subsequent induction of cell death pathways are key hallmarks in neonatal hypoxic-ischemic (HI) injury, both in animal models and in term infants. Mitoprotective therapies therefore offer a new avenue for intervention for the babies who suffer life-long disabilities as a result of birth asphyxia. Here we show that after oxygen-glucose deprivation in primary neurons or in a mouse model of HI, mitochondrial protein homeostasis is altered, manifesting as a change in mitochondrial morphology and functional impairment. Furthermore we find that the mitochondrial fusion and cristae regulatory protein, OPA1, is aberrantly cleaved to shorter forms. OPA1 cleavage is normally regulated by a balanced action of the proteases Yme1L and Oma1. However, in primary neurons or after HI in vivo, protein expression of YmelL is also reduced, whereas no change is observed in Oma1 expression. Our data strongly suggest that alterations in mitochondria-shaping proteins are an early event in the pathogenesis of neonatal HI injury.

Keywords: OPA1; Oma1; Yme1L; hypoxia-ischaemia; mitochondria; neonatal brain injury; oxygen-glucose deprivation (OGD).


Figures

Figure 1
Figure 1
Oxygen-glucose deprivation (OGD) alters mitochondrial membrane potential, morphology and function in primary cortical neurons. (a) Primary mouse cortical neurons were loaded with JC-1 dye and Hoechst before exposure to OGD. Cells were imaged live before (Con) and at 15, 45 and 90 min during OGD. Both mitochondrial morphology (as observed in red, top row) and membrane potential (increased green signal, second row) are altered during exposure to OGD. Scale bar represents 100 µm; Figures are representative of three individual experiments: (b) Enlargement (3×) of regions defined by white boxes in (a). As the experiment progresses, mitochondria morphology appears to alter from tubular structures to round punctate or larger aggregations; (c) Primary neurons loaded with JC-1 were imaged every minute during OGD followed by analyses of mitochondrial length. Data shown are an average of 360 mitochondria per time point, and mitochondria from the first and last time points analyzed by student’s t-test in the panel below, *** p < 0.001; (d) Primary neurons were subjected to 90 min of OGD followed by up to 24 h incubation in normal growth medium. Lysates were assayed for citrate synthase activity at time points shown following the insult. Data is shown ± SD, n = 4–6 independent litters, determined by two-way ANOVA followed by a Bonferroni post-hoc test, ** p < 0.01 for interaction and treatment.
Figure 1
Figure 1
Oxygen-glucose deprivation (OGD) alters mitochondrial membrane potential, morphology and function in primary cortical neurons. (a) Primary mouse cortical neurons were loaded with JC-1 dye and Hoechst before exposure to OGD. Cells were imaged live before (Con) and at 15, 45 and 90 min during OGD. Both mitochondrial morphology (as observed in red, top row) and membrane potential (increased green signal, second row) are altered during exposure to OGD. Scale bar represents 100 µm; Figures are representative of three individual experiments: (b) Enlargement (3×) of regions defined by white boxes in (a). As the experiment progresses, mitochondria morphology appears to alter from tubular structures to round punctate or larger aggregations; (c) Primary neurons loaded with JC-1 were imaged every minute during OGD followed by analyses of mitochondrial length. Data shown are an average of 360 mitochondria per time point, and mitochondria from the first and last time points analyzed by student’s t-test in the panel below, *** p < 0.001; (d) Primary neurons were subjected to 90 min of OGD followed by up to 24 h incubation in normal growth medium. Lysates were assayed for citrate synthase activity at time points shown following the insult. Data is shown ± SD, n = 4–6 independent litters, determined by two-way ANOVA followed by a Bonferroni post-hoc test, ** p < 0.01 for interaction and treatment.
Figure 2
Figure 2
OPA1 processing is altered after OGD (a) mRNA generated from control (white bars) and OGD-treated (grey bars) primary neurons was analyzed by qRT-PCR for changes in expression of fission (Drp1, Fis1) and fusion genes (Mitofusin 1 and 2, OPA1). There was a small but significant decrease in OPA1 expression in response to OGD exposure (a = 0.0296). Mean data shown ± SD (n = 4–5 independent litters), significance determined by two way ANOVA; (b) Protein lysates were generated from primary neurons either immediately after 90 min OGD (0 h) or following 6 or 24 h recovery. Proteins were resolved by SDS-PAGE and OPA1 analyzed by western blot. Equal protein loading was determined by GAPDH expression. Size distribution of the OPA1 immunoreactivity is expressed as a proportion of total OPA1 (arrowheads). There was a significant increase in the expression of the OPA1 lower band at 0 and 6 h, significance determined by two-way ANOVA for treatment and band. If there was a significant interaction, a Bonferroni post-hoc was performed. Data are mean ± SD (n = 3 independent litters), * p < 0.05, *** p < 0.001, **** p < 0.0001.
Figure 2
Figure 2
OPA1 processing is altered after OGD (a) mRNA generated from control (white bars) and OGD-treated (grey bars) primary neurons was analyzed by qRT-PCR for changes in expression of fission (Drp1, Fis1) and fusion genes (Mitofusin 1 and 2, OPA1). There was a small but significant decrease in OPA1 expression in response to OGD exposure (a = 0.0296). Mean data shown ± SD (n = 4–5 independent litters), significance determined by two way ANOVA; (b) Protein lysates were generated from primary neurons either immediately after 90 min OGD (0 h) or following 6 or 24 h recovery. Proteins were resolved by SDS-PAGE and OPA1 analyzed by western blot. Equal protein loading was determined by GAPDH expression. Size distribution of the OPA1 immunoreactivity is expressed as a proportion of total OPA1 (arrowheads). There was a significant increase in the expression of the OPA1 lower band at 0 and 6 h, significance determined by two-way ANOVA for treatment and band. If there was a significant interaction, a Bonferroni post-hoc was performed. Data are mean ± SD (n = 3 independent litters), * p < 0.05, *** p < 0.001, **** p < 0.0001.
Figure 3
Figure 3
Yme1L protein expression is reduced after OGD (a) mRNA generated from control and OGD-treated primary neurons was analyzed by qRT-PCR for changes in expression of Yme1L. Data shown ± SD, n = 3–4 independent litters; (b) Protein lysates were generated from primary neurons immediately following OGD and analyzed by western blot for expression of Yme1L. Equal protein loading was determined by GAPDH expression which was used for the quantification (right hand panel). Figure is representative of three individual litters, * p < 0.05 determined by students t-test; (c) Oma1 gene expression or (d) Oma1 protein expression was determined as above with GAPDH for equal loading. Data was analyzed as above. Figure is representative of three individual litters.
Figure 3
Figure 3
Yme1L protein expression is reduced after OGD (a) mRNA generated from control and OGD-treated primary neurons was analyzed by qRT-PCR for changes in expression of Yme1L. Data shown ± SD, n = 3–4 independent litters; (b) Protein lysates were generated from primary neurons immediately following OGD and analyzed by western blot for expression of Yme1L. Equal protein loading was determined by GAPDH expression which was used for the quantification (right hand panel). Figure is representative of three individual litters, * p < 0.05 determined by students t-test; (c) Oma1 gene expression or (d) Oma1 protein expression was determined as above with GAPDH for equal loading. Data was analyzed as above. Figure is representative of three individual litters.
Figure 4
Figure 4
Aberrant processing of OPA1 in vivo. Mitochondrial fractions were generated from hypoxic-ischemic (HI), hypoxia alone or sham control mice. Proteins were resolved by SDS-PAGE and analyzed by western blot for OPA1, Yme1L and Oma1 at 0 (a), 24 (b) and 48 h (c) following HI. Tom20 was used as a loading control for mitochondria (bottom panel). Total OPA1 expression was determined by densitometry and OPA1 isoforms or cleavage products expressed as a proportion of that total. Arrowheads indicate alternate forms of OPA1. Mean data shown ± SD. OPA1 significance was determined by two-way ANOVA for band size and treatment followed by a Bonferroni post-hoc test * p < 0.05, ** p < 0.01, *** p < 0.001, **** p < 0.0001. YME1L and Oma1 data were analyzed with a one-way ANOVA.
Figure 4
Figure 4
Aberrant processing of OPA1 in vivo. Mitochondrial fractions were generated from hypoxic-ischemic (HI), hypoxia alone or sham control mice. Proteins were resolved by SDS-PAGE and analyzed by western blot for OPA1, Yme1L and Oma1 at 0 (a), 24 (b) and 48 h (c) following HI. Tom20 was used as a loading control for mitochondria (bottom panel). Total OPA1 expression was determined by densitometry and OPA1 isoforms or cleavage products expressed as a proportion of that total. Arrowheads indicate alternate forms of OPA1. Mean data shown ± SD. OPA1 significance was determined by two-way ANOVA for band size and treatment followed by a Bonferroni post-hoc test * p < 0.05, ** p < 0.01, *** p < 0.001, **** p < 0.0001. YME1L and Oma1 data were analyzed with a one-way ANOVA.

References

    1. Evans K., Rigby A.S., Hamilton P., Titchiner N., Hall D.M. The relationships between neonatal encephalopathy and cerebral palsy: A cohort study. J. Obstet. Gynaecol. 2001;21:114–120. doi: 10.1080/01443610020025967. - DOI - PubMed
    1. Smith J., Wells L., Dodd K. The continuing fall in incidence of hypoxic-ischaemic encephalopathy in term infants. BJOG. 2000;107:461–466. doi: 10.1111/j.1471-0528.2000.tb13262.x. - DOI - PubMed
    1. Lawn J.E., Bahl R., Bergstrom S., Bhutta Z.A., Darmstadt G.L., Ellis M., English M., Kurinczuk J.J., Lee A.C., Merialdi M., et al. Setting research priorities to reduce almost one million deaths from birth asphyxia by 2015. PLoS Med. 2011;8:e1000389. doi: 10.1371/journal.pmed.1000389. - DOI - PMC - PubMed
    1. Vannucci R.C., Perlman J.M. Interventions for perinatal hypoxic-ischemic encephalopathy. Pediatrics. 1997;100:1004–1014. doi: 10.1542/peds.100.6.1004. - DOI - PubMed
    1. Azzopardi D., Wyatt J.S., Cady E.B., Delpy D.T., Baudin J., Stewart A.L., Hope P.L., Hamilton P.A., Reynolds E.O. Prognosis of newborn infants with hypoxic-ischemic brain injury assessed by phosphorus magnetic resonance spectroscopy. Pediatr. Res. 1989;25:445–451. doi: 10.1203/00006450-198905000-00004. - DOI - PubMed

Publication types

LinkOut - more resources