. 2015 Sep 22;10(9):e0138705.
doi: 10.1371/journal.pone.0138705. eCollection 2015.

Local Delivery of High-Dose Chondroitinase ABC in the Sub-Acute Stage Promotes Axonal Outgrowth and Functional Recovery after Complete Spinal Cord Transection

Affiliations

Local Delivery of High-Dose Chondroitinase ABC in the Sub-Acute Stage Promotes Axonal Outgrowth and Functional Recovery after Complete Spinal Cord Transection

Chu-Hsun Cheng et al. PLoS One. .

Abstract

Chondroitin sulfate proteoglycans (CSPGs) are glial scar-associated molecules considered axonal regeneration inhibitors and can be digested by chondroitinase ABC (ChABC) to promote axonal regeneration after spinal cord injury (SCI). We previously demonstrated that intrathecal delivery of low-dose ChABC (1 U) in the acute stage of SCI promoted axonal regrowth and functional recovery. In this study, high-dose ChABC (50 U) introduced via intrathecal delivery induced subarachnoid hemorrhage and death within 48 h. However, most SCI patients are treated in the sub-acute or chronic stages, when the dense glial scar has formed and is minimally digested by intrathecal delivery of ChABC at the injury site. The present study investigated whether intraparenchymal delivery of ChABC in the sub-acute stage of complete spinal cord transection would promote axonal outgrowth and improve functional recovery. We observed no functional recovery following the low-dose ChABC (1 U or 5 U) treatments. Furthermore, animals treated with high-dose ChABC (50 U or 100 U) showed decreased CSPGs levels. The extent and area of the lesion were also dramatically decreased after ChABC treatment. The outgrowth of the regenerating axons was significantly increased, and some partially crossed the lesion site in the ChABC-treated groups. In addition, retrograde Fluoro-Gold (FG) labeling showed that the outgrowing axons could cross the lesion site and reach several brain stem nuclei involved in sensory and motor functions. The Basso, Beattie and Bresnahan (BBB) open field locomotor scores revealed that the ChABC treatment significantly improved functional recovery compared to the control group at eight weeks after treatment. Our study demonstrates that high-dose ChABC treatment in the sub-acute stage of SCI effectively improves glial scar digestion by reducing the lesion size and increasing axonal regrowth to the related functional nuclei, which promotes locomotor recovery. Thus, our results will aid in the treatment of spinal cord injury.


Conflict of interest statement

Competing Interests: The authors have declared that no competing interests exist.

Figures

Fig 1
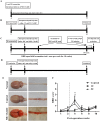
Fig 1. Experimental design of the chondroitinase ABC application.
Flow chart of the lesion and treatment paradigm: intrathecal delivery of high-dose ChABC in the acute stage of complete spinal cord transection (A). Intraparenchymal injection of low-dose ChABC in the sub-acute stage of complete spinal cord transection (B). Intraparenchymal injection of high-dose ChABC in the sub-acute stage of complete spinal cord transection (C). Intraparenchymal injection of high-dose ChABC in the sub-acute stage of spinal cord contusion (D). Two rats that received high-dose ChABC (50 U) after spinal cord transection exhibited severe subarachnoid hemorrhage in the brain and spinal cord (not observed in normal or control rats), which resulted in the rats' death within 48 h (E). Hind limb locomotor function following intraparenchymal injection of low-dose ChABC in sub-acute SCI was evaluated by the BBB locomotor score. Statistical analysis demonstrated that locomotion was significantly improved at 4 weeks (1 U and 5 U) compared to the control group, but there was no significant functional recovery at any other time point (control group n = 6; 1 U and 5 U groups each n = 3; **p<0.01 for 1 U compared to the control; #p<0.05 for 5 U compared to the control, two-way ANOVA, Tukey post hoc test). The error bars denote the SEM.
Fig 2
Fig 2. Expression of CSPGs in the high-dose ChABC treatment groups at 4 weeks after spinal cord transection.
The figures present CSPG immunohistochemistry in longitudinal spinal cord sections at 4 weeks after parenchymal chondroitinase injections at 2 weeks after injury. The undigested CSPG, CS56 (A, E, I), and digested CSPGs, 2B6 (B, F, J), C4S (C, G, K), and C6S (D, H, L), were detected with specific antibodies. There was an abundance of CS56 immunoreactivity within the lesion site in the transected spinal cord (A). In contrast, the ChABC treatment dramatically decreased the CS56 immunoreactivity in the 50 U (E) and 100 U (I) groups. The digested CSPGs, which were detected by the anti-2B6, C4S and C6S antibodies, were significantly increased in the 50 U (F, G, H) and 100 U (J, K, L) groups compared to the control group (B, C, D). The histogram represents the quantitative analysis of the digested and undigested CSPG immunoreactivity at the injured site (M). There were significant differences in the levels of CS56, 2B6, C4S and C6S immunoreactivity between the ChABC-treated and control groups (each n = 4; *p<0.05; **p<0.01, one-way ANOVA, Tukey’s post hoc test), but there was no significant difference between the 50 U and 100 U ChABC-treated groups. The error bars denote the SEM. Scale bar = 1000 μm.
Fig 3
Fig 3. Expression of CSPGs in the high-dose ChABC treatment groups at 10 weeks after spinal cord transection.
The figures present the CSPG immunohistochemistry in the longitudinal spinal cord sections at 10 weeks after parenchymal chondroitinase injections at 2 weeks after injury. The undigested CSPG, CS56 (A, E, I), and digested CSPGs, 2B6 (B, F, J), C4S (C, G, K), and C6S (D, H, L), were identified by specific antibodies. There was abundant CS56 immunoreactivity within the lesion site in the transected spinal cord (A). In contrast, ChABC treatment dramatically decreased the CS56 immunoreactivity in the 50 U (E) and 100 U (I) groups. The digested CSPGs, which were detected by the anti-2B6, C4S and C6S antibodies, were significantly increased in the 50 U (F, G, H) and 100 U (J, K, L) groups compared to the control group (B, C, D). The histogram represents the quantitative analysis of the digested and undigested CSPG immunoreactivity in the injured site (M). There were significant differences in the levels of CS56, 2B6, C4S and C6S immunoreactivity between the ChABC-treated and control groups (each n = 4; *p<0.05; **p<0.01, one-way ANOVA, Tukey’s post hoc test), but there was no significant difference between the 50 U and 100 U ChABC-treated groups. The error bars denote the SEM. Scale bar = 1000 μm.
Fig 4
Fig 4. Photographs showing the cavities and cyst formation after T8 spinal cord transection.
Longitudinal spinal cord sections from the control (A, D), 50 U (B, E) and 100 U (C, F) ChABC-treated groups were stained with hematoxylin and eosin (H&E) at 4 (A-C) and 10 (D-F) weeks after spinal cord injury. In the control group, many cavities and cysts (holes filled with hematoxylin-positive cells) had obviously appeared in the rostral and distal stump near the lesion site at 4 weeks after injury (A). Subsequently, the shrinking spinal cord tissue created additional cavities and cysts around the lesion site that became larger and farther from the spinal stumps at 10 weeks after injury (D). In ChABC-treated groups, cysts with hematoxylin-positive cells were also exhibited around the epicenter of the lesion site after treatment with 50 U (B) or 100 U ChABC (C), but fewer cavities had formed and extended at 4 weeks after spinal cord injury. In the 50 U (E) and 100 U (F) ChABC-treated groups, cysts also formed around the lesion site and extended a shorter distance from the spinal stumps compared to the control group at 10 weeks after SCI. The histograms represent measurements of the cavities' length between the rostral and caudal edges of the cavities (G) and the lesion area (H) in the spinal cord. The histograms show that treatment with 50 U and 100 U ChABC significantly decreased the length of the cavities compared to the control group at 4 and 10 weeks after spinal cord injury, but there was no significant difference between the ChABC-treated groups (n = 4 per group; **p<0.01, one-way ANOVA, Tukey’s post hoc test). The error bars denote the SEM.
Fig 5
Fig 5. Axonal outgrowth in the injured spinal cord after high-dose ChABC treatment.
Longitudinal spinal cord sections from the control (A, D) and the 50 U (B, E) and 100 U (C, F) ChABC-treated groups were labeled with β-III tubulin (red) and GFAP (green, astrocytes) at 4 (A-C) and 10 (D-F) weeks after spinal cord injury; the dotted square indicates the higher magnification image of the lesion epicenter in each group (A’-F’). The GFAP+ astrocytes were considered as the boundary of the glial scar in the lesion site. In the control group, some β-III tubulin axons were able to outgrow to the interface of the lesion site, and a few axons extended to the injury epicenter at 4 weeks after injury (A). The number of β-III tubulin-positive axons decreased and there was no detectable axon outgrowth in the lesion epicenter at 10 weeks after SCI (D). It is notable that the 50 U (B) and 100 U (C) ChABC-treated groups showed a greater number of outgrown axons that crossed the astrocyte-rich territory and filled in the lesion site at 4 weeks after SCI. At 10 weeks, there were still many β-III tubulin-positive axons in the proximal and distal stumps in the 100 U (F) ChABC-treated group, but they were decreased in the 50 U (E) ChABC-treated group. However, β-III tubulin-positive axon outgrowth was also observed in the lesion site in both the 50 U and 100 U ChABC-treated groups (E, F) at 10 weeks after injury. The histograms show the percentage of β-III tubulin-positive axons in the lesion site at 4 and 10 weeks after injury (G). Statistical analysis demonstrated that the levels of β-III tubulin were significantly increased in the 50 U and 100 U ChABC-treated groups compared to the control group at 4 weeks and 10 weeks after spinal cord injury (n = 4 per group; *p<0.05, **p<0.01, one-way ANOVA, Tukey’s post hoc test). The error bars denote the SEM. Scale bars: A-F = 1000 μm; A’-F’ = 100 μm.
Fig 6
Fig 6. Fluoro-Gold (FG) retrogradely labeled neurons in the spinal cord.
The presence of FG-positive neurons in the rostral stumps suggested that FG, which was injected at the T13 level, was absorbed by the anterogradely regenerating axons crossing the transection gap. In the control group, there were virtually no FG-positive neurons beyond the rostral stumps, demonstrating an absence of axonal regeneration (A, magnifications in A’-A”’). In contrast, there were many FG-positive neurons in the 50 U (B, magnifications in B’-B”’) and 100 U (C, magnifications in C’-C”’) ChABC-treated groups, showing that the ChABC treatment could promote axons to regenerate and cross the transection gap. Mean number of FG-positive neurons in the rostral spinal cord stump (D). There were no labeled neurons in the rostral spinal cord from the control groups. (n = 3 per group; *p<0.05, one-way ANOVA, Tukey’s post hoc test). The error bars denote the SEM. Scale bars: A, B, C = 1000 μm; A’-A”‘, B’-B”’, C’-C”’ = 100 μm.
Fig 7
Fig 7. Fluoro-Gold (FG) retrogradely labeled neurons in specific brain stem nuclei.
The coronal brain sections demonstrated that no FG-positive cells were detected in the brainstems in the control group (Fig A-E, magnifications in A’-E’, P). In the high-dose ChABC-treated groups, FG-positive neurons were detected in the descending/motor related pathway in the medial longitudinal fasciculus (50 U: F, magnifications in F’; 100 U: K, magnifications in K’) and rubrospinal tract (olivary body, 50 U: H, magnifications in H’, H”; 100 U: M, magnifications in M’, M”), and in the ascending/sensory related pathway in the parvicellular reticular nucleus (50 U: G, G’, G”; 100 U: L, magnifications in L’, L”), reticular formation (50 U: I, magnifications in I’, I”; 100 U: N, magnifications in N’, N”), and cuneate and gracile nuclei (50 U: J, magnifications in J’; 100 U: O, magnifications in O’). Mean number of FG-positive neurons in the target regions of the brainstem (P) (n = 3 per group; *p<0.05, **p<0.01, ****p<0.0001, two-way ANOVA, Tukey’s post hoc test). Linear regression analysis comparing the total number of FG-positive cells in the brainstem of the different treatment groups (Q). These reconnections of the descending and ascending pathways suggest that high-dose ChABC may partially promote functional recovery after spinal cord transection. Scale bars: A-J = 1000 μm; A’-J’ = 100 μm. mlf, medial longitudinal fasciculus; RST, rubrospinal tract; PCRt, parvicellular reticular nucleus; RF, reticular formation; Cu & Gr, cuneate and gracile nuclei, respectively. The boxed areas show the higher magnification images of a neuron with visible punctate FG staining (J’) and an artifact (E’).
Fig 8
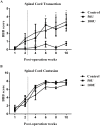
Fig 8. Time course of functional recovery in the high-dose ChABC-treated and control groups.
The dotted line indicates the intraparenchymal injection of high-dose ChABC at 2 weeks after spinal cord transection. The BBB score shows that there was no significant improvement of the BBB score in the control group. In contrast, locomotion mildly improved with the 50 U and 100 U ChABC treatments. Statistical analysis demonstrated that locomotion significantly improved at 6 (50 U), 8 and 10 weeks (50 U and 100 U) compared to the control group, but there was no significant difference between the 50 U and 100 U ChABC-treated groups (A). After spinal cord contusive injury, there was no significant functional recovery in the ChABC-treated groups compared to the control group (B) (for transection, n = 6 per group; for contusion, n = 4 per group, *p<0.05 for 50 U compared to the control; #p<0.05 for 100 U compared to the control, two-way ANOVA, Tukey’s post hoc test). The error bars denote the SEM.

Similar articles

Cited by

References

    1. McKerracher L, David S, Jackson DL, Kottis V, Dunn RJ, Braun PE. Identification of myelin-associated glycoprotein as a major myelin-derived inhibitor of neurite growth. Neuron. 1994;13(4):805–11. . - PubMed
    1. Oertle T, van der Haar ME, Bandtlow CE, Robeva A, Burfeind P, Buss A, et al. Nogo-A inhibits neurite outgrowth and cell spreading with three discrete regions. The Journal of neuroscience: the official journal of the Society for Neuroscience. 2003;23(13):5393–406. . - PMC - PubMed
    1. Wang KC, Koprivica V, Kim JA, Sivasankaran R, Guo Y, Neve RL, et al. Oligodendrocyte-myelin glycoprotein is a Nogo receptor ligand that inhibits neurite outgrowth. Nature. 2002;417(6892):941–4. 10.1038/nature00867 . - DOI - PubMed
    1. Monnier PP, Sierra A, Macchi P, Deitinghoff L, Andersen JS, Mann M, et al. RGM is a repulsive guidance molecule for retinal axons. Nature. 2002;419(6905):392–5. 10.1038/nature01041 . - DOI - PubMed
    1. McKeon RJ, Jurynec MJ, Buck CR. The chondroitin sulfate proteoglycans neurocan and phosphacan are expressed by reactive astrocytes in the chronic CNS glial scar. The Journal of neuroscience: the official journal of the Society for Neuroscience. 1999;19(24):10778–88. . - PMC - PubMed

Publication types

Substances