

Changes in Intake of Fruits and Vegetables and Weight Change in United States Men and Women Followed for Up to 24 Years: Analysis from Three Prospective Cohort Studies
- PMID: 26394033
- PMCID: PMC4578962
- DOI: 10.1371/journal.pmed.1001878
Changes in Intake of Fruits and Vegetables and Weight Change in United States Men and Women Followed for Up to 24 Years: Analysis from Three Prospective Cohort Studies
Erratum in
-
Correction: Changes in Intake of Fruits and Vegetables and Weight Change in United States Men and Women Followed for Up to 24 Years: Analysis from Three Prospective Cohort Studies.PLoS Med. 2016 Jan 20;13(1):e1001956. doi: 10.1371/journal.pmed.1001956. eCollection 2016 Jan. PLoS Med. 2016. PMID: 26789645 Free PMC article. No abstract available.
Abstract
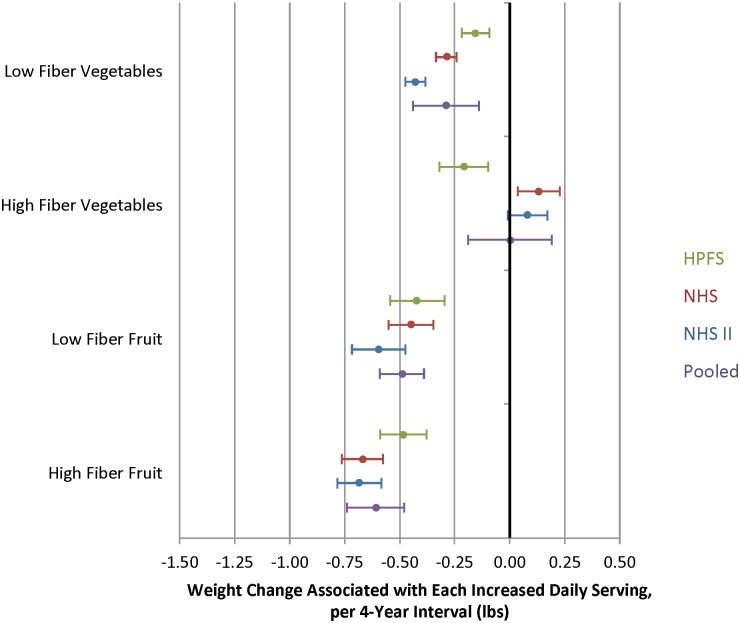
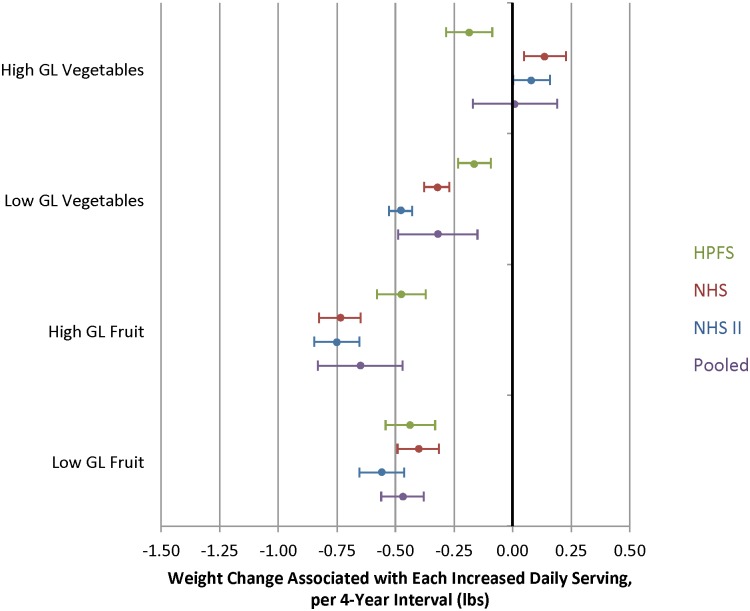
Background: Current dietary guidelines recommend eating a variety of fruits and vegetables. However, based on nutrient composition, some particular fruits and vegetables may be more or less beneficial for maintaining or achieving a healthy weight. We hypothesized that greater consumption of fruits and vegetables with a higher fiber content or lower glycemic load would be more strongly associated with a healthy weight.
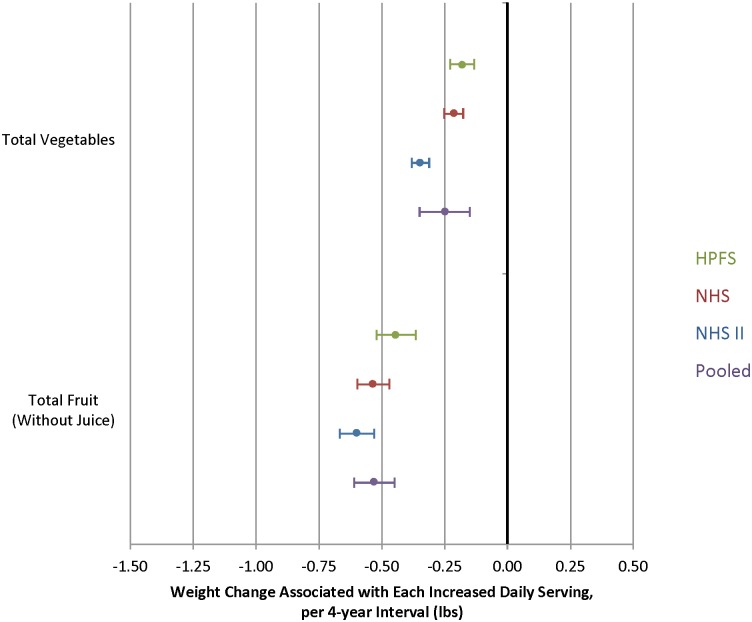
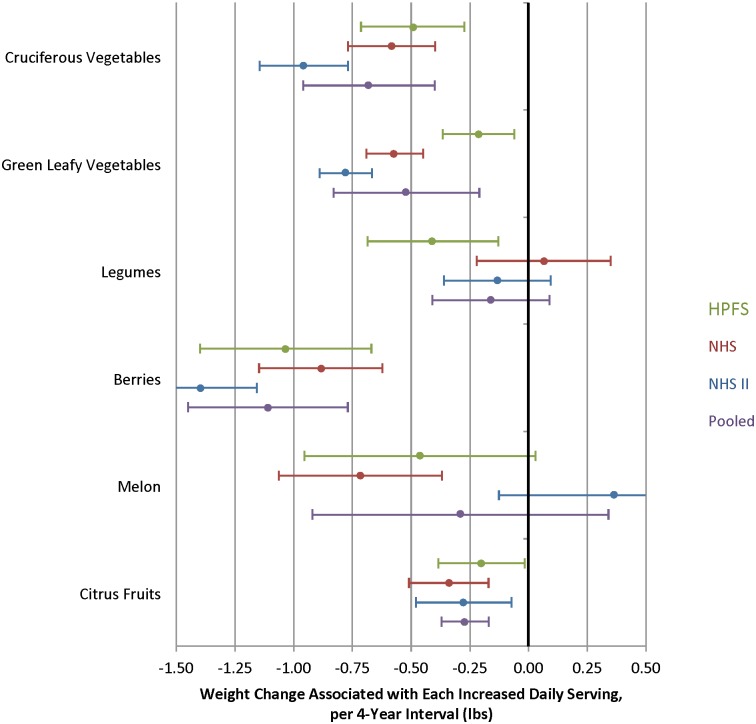
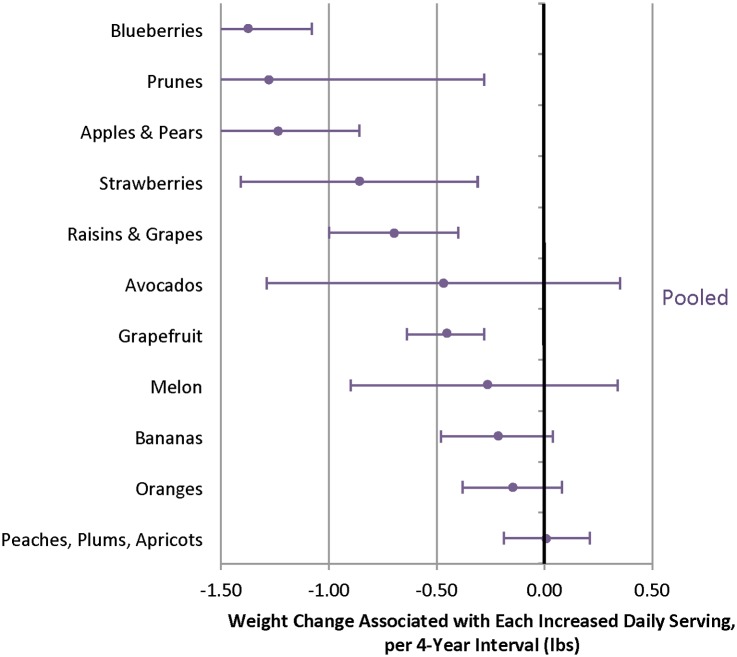
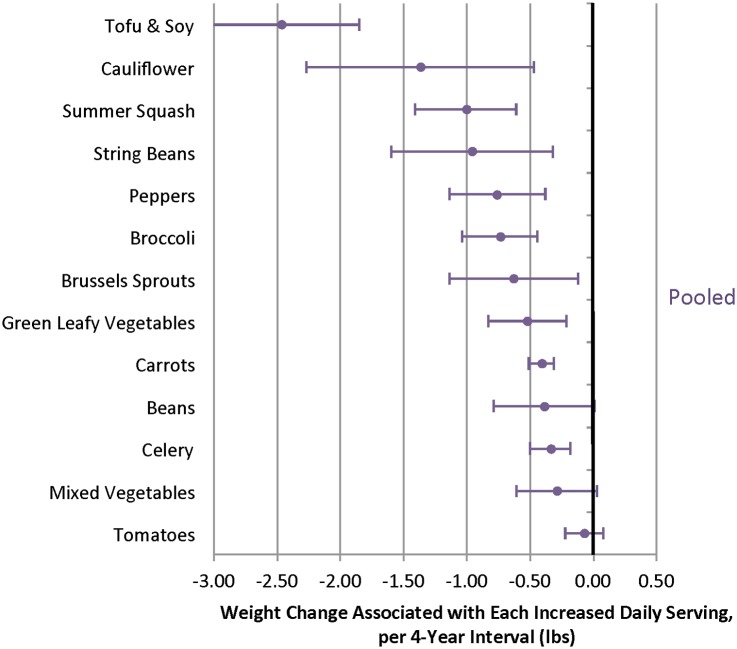
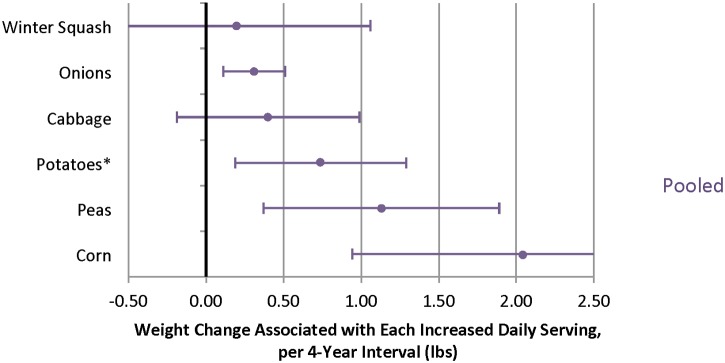
Methods and findings: We examined the association between change in intake of specific fruits and vegetables and change in weight in three large, prospective cohorts of 133,468 United States men and women. From 1986 to 2010, these associations were examined within multiple 4-y time intervals, adjusting for simultaneous changes in other lifestyle factors, including other aspects of diet, smoking status, and physical activity. Results were combined using a random effects meta-analysis. Increased intake of fruits was inversely associated with 4-y weight change: total fruits -0.53 lb per daily serving (95% CI -0.61, -0.44), berries -1.11 lb (95% CI -1.45, -0.78), and apples/pears -1.24 lb (95% CI -1.62, -0.86). Increased intake of several vegetables was also inversely associated with weight change: total vegetables -0.25 lb per daily serving (95% CI -0.35, -0.14), tofu/soy -2.47 lb (95% CI, -3.09 to -1.85 lb) and cauliflower -1.37 lb (95% CI -2.27, -0.47). On the other hand, increased intake of starchy vegetables, including corn, peas, and potatoes, was associated with weight gain. Vegetables having both higher fiber and lower glycemic load were more strongly inversely associated with weight change compared with lower-fiber, higher-glycemic-load vegetables (p < 0.0001). Despite the measurement of key confounders in our analyses, the potential for residual confounding cannot be ruled out, and although our food frequency questionnaire specified portion size, the assessment of diet using any method will have measurement error.
Conclusions: Increased consumption of fruits and non-starchy vegetables is inversely associated with weight change, with important differences by type suggesting that other characteristics of these foods influence the magnitude of their association with weight change.
Conflict of interest statement
I have read the journal's policy and the authors of this manuscript have the following competing interests: EBR has funding from the USDA/US Blueberry Highbush Council to conduct observational and experimental studies of blueberries and CVD health outcomes. DM has received ad hoc honoraria and consulting fees from Bunge, Haas Avocado Board, Nutrition Impact, Amarin, Astra Zeneca, Boston Heart Diagnostics, and Life Sciences Research Organization. He is on the scientific advisory board of Unilever North America. DSL has grants from philanthropic organizations and receives royalties from books on obesity. In all cases, these funding sources are unrelated to this project, and the authors perceive no pertinent conflicts. All other authors declare that no competing interests exist.
Figures
References
-
- U.S. Department of Agriculture and U.S. Department of Health and Human Services (2010) Dietary Guidelines for Americans, 2010. 7 ed Washington, D.C.: Government Printing Office.
-
- Howarth NC, Saltzman E, Roberts SB. Dietary fiber and weight regulation. Nutr Rev. 2001;59: 129–139. - PubMed
-
- Porikos K, Hagamen S. Is fiber satiating? Effects of a high fiber preload on subsequent food intake of normal-weight and obese young men. Appetite. 1986;7: 153–162. - PubMed
-
- Alfieri MA, Pomerleau J, Grace DM, Anderson L. Fiber intake of normal weight, moderately obese and severely obese subjects. Obes Res. 1995;3: 541–547. - PubMed
Publication types
MeSH terms
Grants and funding
- UM1 CA176726/CA/NCI NIH HHS/United States
- R01 HL35464/HL/NHLBI NIH HHS/United States
- R01 CA49449/CA/NCI NIH HHS/United States
- K24 DK082730/DK/NIDDK NIH HHS/United States
- UM1 CA167552/CA/NCI NIH HHS/United States
- R01 CA049449/CA/NCI NIH HHS/United States
- P01 CA087969/CA/NCI NIH HHS/United States
- R01 CA67262/CA/NCI NIH HHS/United States
- R01 CA067262/CA/NCI NIH HHS/United States
- K24DK082730/DK/NIDDK NIH HHS/United States
- P01 CA87969/CA/NCI NIH HHS/United States
- R01 HL034594/HL/NHLBI NIH HHS/United States
- R01 HL035464/HL/NHLBI NIH HHS/United States
- R01 HL088521/HL/NHLBI NIH HHS/United States
LinkOut - more resources
Full Text Sources
Other Literature Sources
Medical
