. 2015 Sep 22;10(9):e0138572.
doi: 10.1371/journal.pone.0138572. eCollection 2015.

Magnetic Resonance Detection of CD34+ Cells from Umbilical Cord Blood Using a 19F Label

Affiliations

Magnetic Resonance Detection of CD34+ Cells from Umbilical Cord Blood Using a 19F Label

Lucia E Duinhouwer et al. PLoS One. .

Abstract

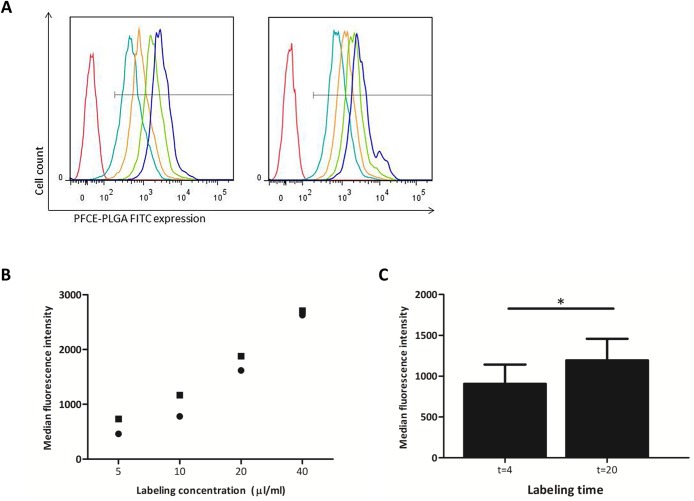
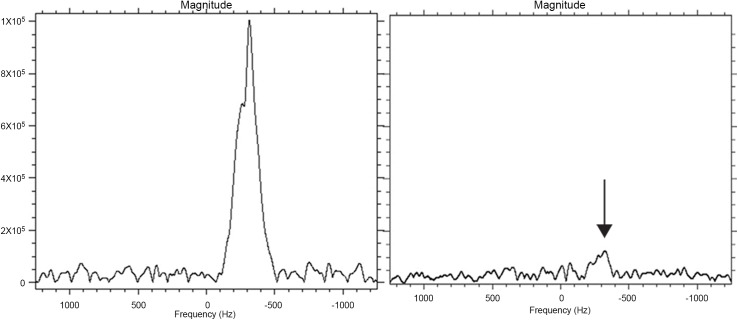
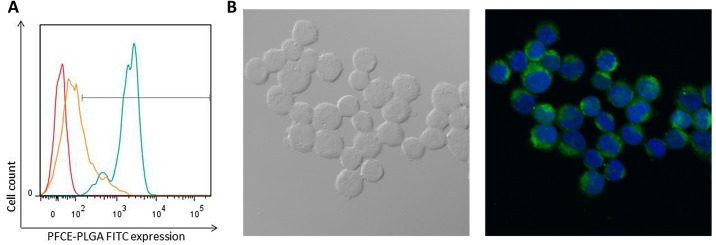
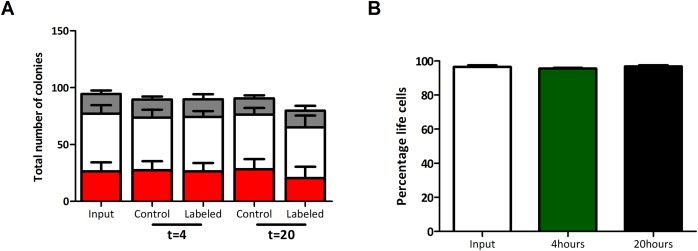
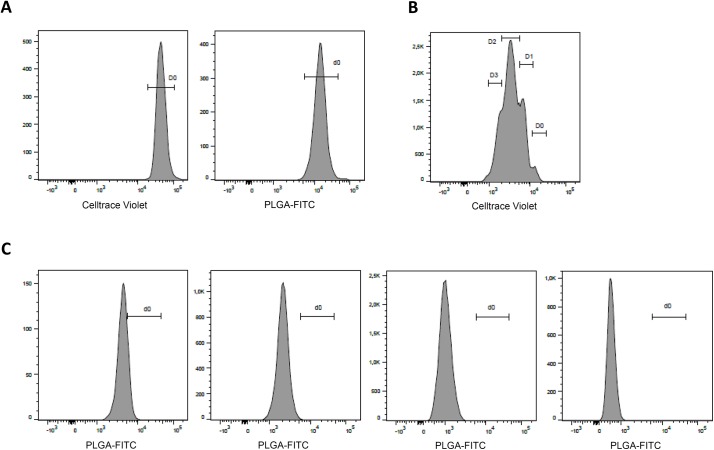
Impaired homing and delayed recovery upon hematopoietic stem cell transplantation (HSCT) with hematopoietic stem cells (HSC) derived from umbilical cord blood (UCB) is a major problem. Tracking transplanted cells in vivo will be helpful to detect impaired homing at an early stage and allows early interventions to improve engraftment and outcome after transplantation. In this study, we show sufficient intracellular labeling of UCB-derived CD34+ cells, with 19F-containing PLGA nanoparticles which were detectable with both flow cytometry and magnetic resonance spectroscopy (MRS). In addition, labeled CD34+ cells maintain their capacity to proliferate and differentiate, which is pivotal for successful engraftment after transplantation in vivo. These results set the stage for in vivo tracking experiments, through which the homing efficiency of transplanted cells can be studied.


Conflict of interest statement

Competing Interests: The authors have declared that no competing interests exist.

Figures

Fig 1
Fig 1. CD34+ cells can be labeled efficiently with 19F -PLGA nanoparticles with the intensity increasing with longer incubation time and higher labeling concentration.
(A) Fluorescence histograms of cells labeled with 0 (red), 5 (turquoise), 10 (orange), 20 (green) and 40 (blue) μl/ml nanoparticles at incubation times of 4 (left panel) or 20 (right panel) hours. Horizontal axes show the intensity of the FITC signal, representing the 19F -PLGA nanoparticles. (B) Median fluorescence intensity per labeling concentration after 4 (circle) and 20 (square) hours of labeling. Figs 1A and 1B show a representative experiment out of 2 experiments. (C) Median fluorescence intensity of cells labeled with 20 μl/ml 19F -PLGA nanoparticles for 4 and 20 hours (n = 5). * = p<0.05.
Fig 2
Fig 2. Detection of labeled CD34+ cells by magnetic resonance spectroscopy and imaging.
Left and right panel show the 19F MRS spectrum of 2 agar gel phantoms containing 105 and 104 labeled CD34+ cells in 150 μl respectively. Shown is the 19F resonance line, the horizontal axes shows the frequency offset from the transmitter. Here the transmitter frequency has been set to the resonance frequency of the 19F in PFCE. Labeled cells were labeled with 20 μl/ml 19F -PLGA nanoparticles with an incubation time of 20 hours.
Fig 3
Fig 3. Uptake of the label is an active process and results in intracellular accumulation of the label.
(A) Fluorescence histogram for mock-labeled control cells (red) and cells labeled 20 hours at 37°C (turquoise) or 4°C (orange). Horizontal axes show the intensity of the FITC signal, representing the 19F -PLGA nanoparticles. (B) Differential Interference Contrast image (left) and fluorescent image (right) of CD34+ cells labeled with 19F -PLGA nanoparticles, showing the blue DAPI-signal (nucleus of the cell) and the green FITC-signal (19F -PLGA nanoparticles).
Fig 4
Fig 4. Labeling with 19F-PLGA does not affect the relative proportion of committed hematopoietic progenitors and cell viability.
(A) Total number of colonies per 500 CD34+ cells for BFU-E (red), CFU-GM (white) and CFU-GEMM (gray). (B) Percentage of life cells at input (white), and after 4 (green) and 20 (black) hours of labeling with 20 μl/ml 19F-PLGA (n = 5).
Fig 5
Fig 5. 19F-PLGA labeled cells remain detectable over time and upon cell division, although label intensity decreases.
Fluorescence histograms for CellTrace and 19F -PLGA-labeled CD34+ cells (A) Population shown is labeled cells at day 0. Horizontal axes show the intensity of the CellTrace Violet signal (left panel) and of the FITC signal, representing the 19F -PLGA nanoparticles (right panel). (B) Population shown is labeled cells after 4 days of culture. The horizontal axes show the intensity of the CellTrace Violet signal, indicating the number of cell divisions. (C) Populations shown are labeled cells after 4 days of culture who had undergone 0, 1, 2 or 3 cell division respectively (depicted in the panels from left to right). Horizontal axes show the intensity of the FITC signal, representing the 19F -PLGA nanoparticles.

References

    1. Bernsen MR, Moelker AD, Wielopolski PA, van Tiel ST, Krestin GP. Labelling of mammalian cells for visualisation by MRI. Eur Radiol. 2010. February;20(2):255–74. 10.1007/s00330-009-1540-1 - DOI - PubMed
    1. Amsalem Y, Mardor Y, Feinberg MS, Landa N, Miller L, Daniels D, et al. Iron-oxide labeling and outcome of transplanted mesenchymal stem cells in the infarcted myocardium. Circulation. 2007. September 11;116(11 Suppl):I38–45. - PubMed
    1. Willenbrock S, Knippenberg S, Meier M, Hass R, Wefstaedt P, Nolte I, et al. In vivo MRI of intraspinally injected SPIO-labelled human CD34+ cells in a transgenic mouse model of ALS. In Vivo. 2012. Jan-Feb;26(1):31–8. - PubMed
    1. Zhu J, Zhou L, XingWu F. Tracking neural stem cells in patients with brain trauma. N Engl J Med. 2006. November 30;355(22):2376–8. - PubMed
    1. Toso C, Vallee JP, Morel P, Ris F, Demuylder-Mischler S, Lepetit-Coiffe M, et al. Clinical magnetic resonance imaging of pancreatic islet grafts after iron nanoparticle labeling. Am J Transplant. 2008. March;8(3):701–6. 10.1111/j.1600-6143.2007.02120.x - DOI - PubMed

Publication types