. 2016 May;63(5):1082-6.
doi: 10.1109/TBME.2015.2479590. Epub 2015 Sep 18.

The "Fingerprint" of Cancer Extends Beyond Solid Tumor Boundaries: Assessment With a Novel Ultrasound Imaging Approach

The "Fingerprint" of Cancer Extends Beyond Solid Tumor Boundaries: Assessment With a Novel Ultrasound Imaging Approach

Sneha R Rao et al. IEEE Trans Biomed Eng. 2016 May.

Abstract

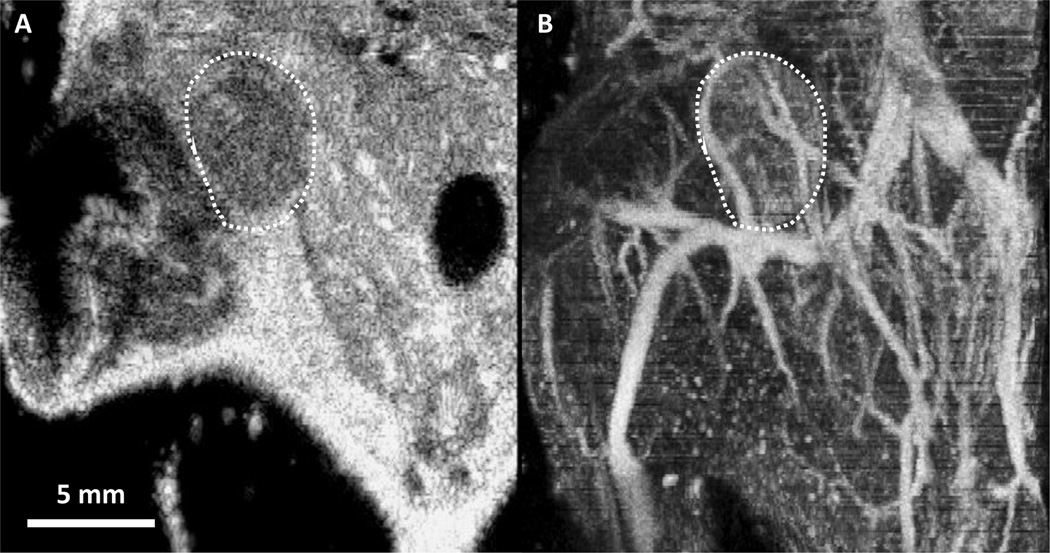
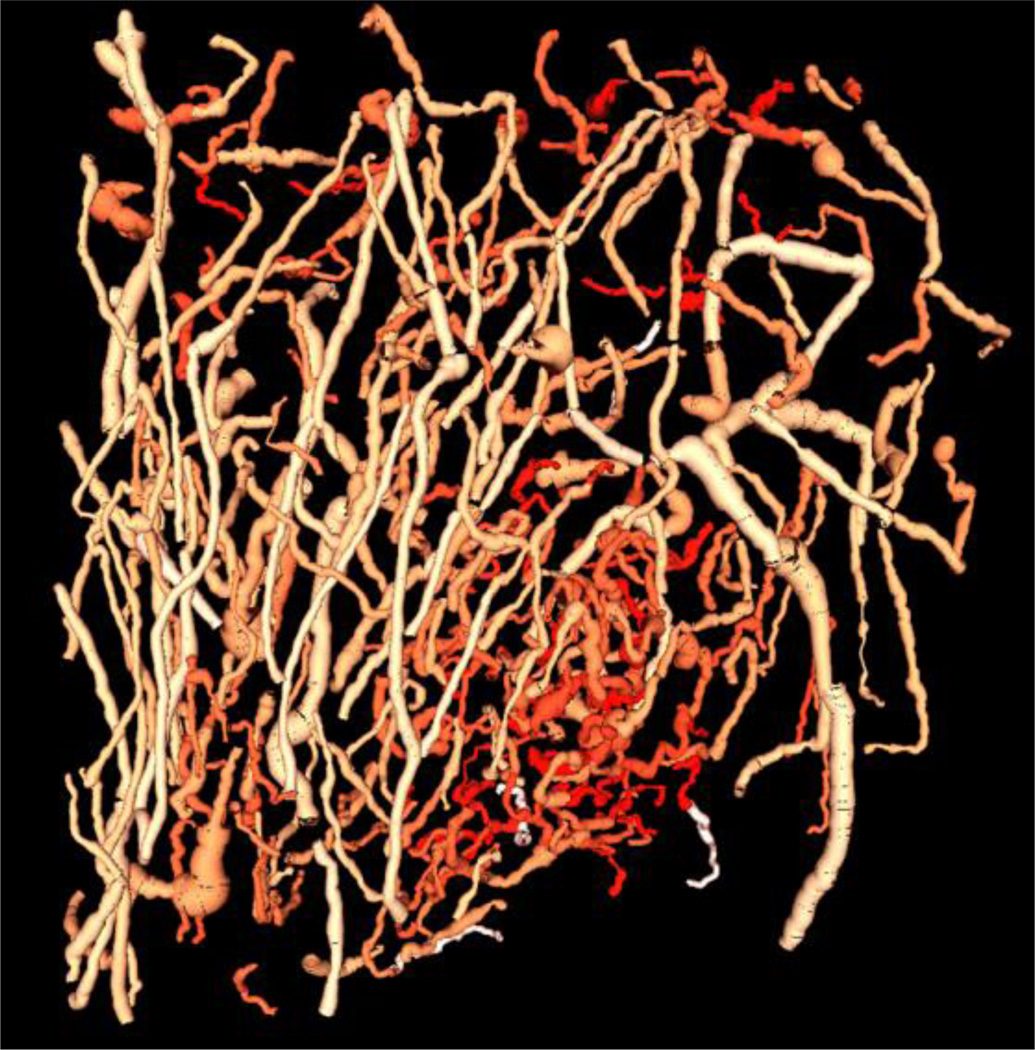
Goal: Abnormalities of microvascular morphology have been associated with tumor angiogenesis for more than a decade, and are believed to be intimately related to both tumor malignancy and response to treatment. However, the study of these vascular changes in-vivo has been challenged due to the lack of imaging approaches which can assess the microvasculature in 3-D volumes noninvasively. Here, we use contrast-enhanced "acoustic angiography" ultrasound imaging to observe and quantify heterogeneity in vascular morphology around solid tumors.

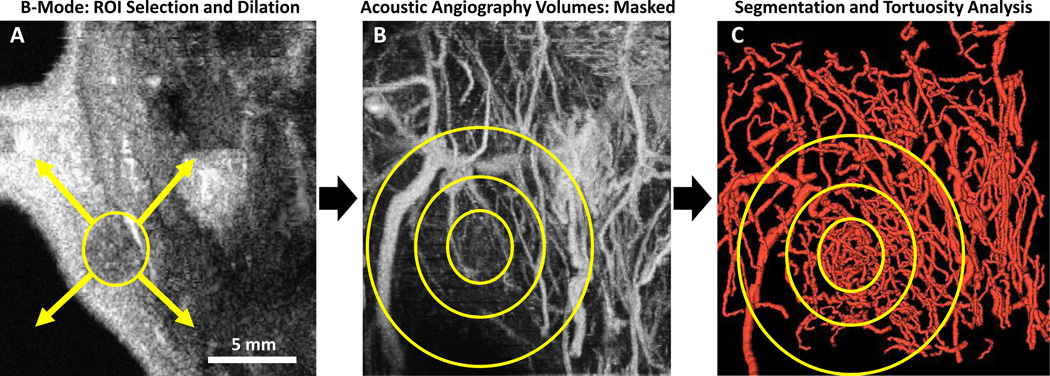
Methods: Acoustic angiography, a recent advance in contrast-enhanced ultrasound imaging, generates high-resolution microvascular images unlike anything possible with standard ultrasound imaging techniques. Acoustic angiography images of a genetically engineered mouse breast cancer model were acquired to develop an image acquisition and processing routine that isolated radially expanding regions of a 3-D image from the tumor boundary to the edge of the imaging field for assessment of vascular morphology of tumor and surrounding vessels.

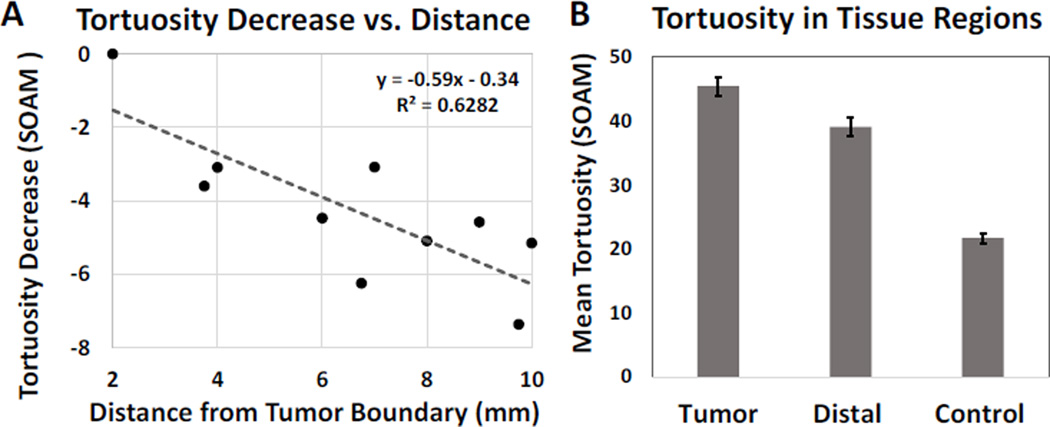
Results: Quantitative analysis of vessel tortuosity for the tissue surrounding tumors 3 to 7 mm in diameter revealed that tortuosity decreased in a region 6 to 10 mm from the tumor boundary, but was still significantly elevated when compared to control vasculature.

Conclusion: Our analysis of angiogenesis-induced changes in the vasculature outside the tumor margin reveals that the extent of abnormal tortuosity extends significantly beyond the primary tumor mass.

Significance: Visualization of abnormal vascular tortuosity may make acoustic angiography an invaluable tool for early tumor detection based on quantifying the vascular footprint of small tumors and a sensitive method for understanding changes in the vascular microenvironment during tumor progression.


Figures

Figure 1
Figure 1
(A) 2-D frame of a traditional ultrasound B-mode image in the coronal plane, through the center of a mouse mammary pad tumor delineated by the white dashed outline. (B) Maximum intensity projection of a 3-D acoustic angiography image volume containing the tumor and surrounding tissue corresponding to panel A. This comparison illustrates the unique capability of acoustic angiography to depict in-vivo microvasculature
Figure 2
Figure 2
(A) Standard B-mode image (2-D) in the coronal plane, reconstructed from 3-D image data. Illustration depicts an idealized section of a 3-D tumor ROI and dilation in all directions to larger ROIs for selection of the concentric tissue regions isolated for vessel segmentation. (B) Acoustic Angiography image (maximum intensity projection of a 3-D image volume) of the tumor and surrounding tissue, with simplified representations of growing ROIs used to mask the acoustic angiography image volume. (C) Rendering of vessels segmented from each ROI, with representative analysis regions overlaid for explanation. All image acquisition, ROI selection, and analysis was performed in 3-D. ROI outlines are for illustration purposes.
Figure 3
Figure 3
(A) Mean sum of angles metric (SOAM) for distances 2–10 mm from tumor margin and fitted linear regression model. Tortuosity values were normalized to the tumor region via subtraction of the mean, and averaged across regions defined by their radial distance from the tumor boundary. Vessel tortuosity decreases significantly with increasing distance from the tumor region, with R2>0.5 and p=0.002. (B) Mean and standard error of SOAM tortuosity values of the tumor, distal and control tissue regions. Each group is statistically different from the others based on ANOVA and Tukey HSD tests, with p<0.01 for all tests.
Figure 4
Figure 4
Color map rendering of the SOAM values for each blood vessel isolated from the acoustic angiography image volume. Intense reds indicate higher SOAM values which are concentrated in the tumor region, while less intense red colors indicate lower SOAM values. This image was generated in VesselView (www.tubetk.org) using custom code provided by Kitware Medical Imaging (Carrboro, NC).

Similar articles

Cited by

References

    1. Gessner R, Lukacs M, Lee M, Cherin E, Foster FS, Dayton PA. High-resolution, high-contrast ultrasound imaging using a prototype dual-frequency transducer: in vitro and in vivo studies. IEEE Trans Ultrason Ferroelectr Freq Control. 2010 Aug;57:1772–1781. - PMC - PubMed
    1. Gessner RC, Frederick CB, Foster FS, Dayton PA. Acoustic angiography: a new imaging modality for assessing microvasculature architecture. Int J Biomed Imaging. 2013;2013:936593. - PMC - PubMed
    1. Kruse DE, Ferrara KW. A new imaging strategy using wideband transient response of ultrasound contrast agents. IEEE Trans Ultrason Ferroelectr Freq Control. 2005 Aug;52:1320–1329. - PMC - PubMed
    1. Jain RK. Normalization of tumor vasculature: an emerging concept in antiangiogenic therapy. Science. 2005 Jan 7;307:58–62. - PubMed
    1. Gessner RC, Aylward SR, Dayton PA. Mapping microvasculature with acoustic angiography yields quantifiable differences between healthy and tumor-bearing tissue volumes in a rodent model. Radiology. 2012 Sep;264:733–740. - PMC - PubMed

Publication types

MeSH terms