Review
. 2015 Sep 23:13:313.
doi: 10.1186/s12967-015-0659-x.

Molecular magnetic resonance imaging in cancer

Affiliations
Review

Molecular magnetic resonance imaging in cancer

Mohammad Haris et al. J Transl Med. .

Abstract

The ability to identify key biomolecules and molecular changes associated with cancer malignancy and the capacity to monitor the therapeutic outcome against these targets is critically important for cancer treatment. Recent developments in molecular imaging based on magnetic resonance (MR) techniques have provided researchers and clinicians with new tools to improve most facets of cancer care. Molecular imaging is broadly described as imaging techniques used to detect molecular signature at the cellular and gene expression levels. This article reviews both established and emerging molecular MR techniques in oncology and discusses the potential of these techniques in improving the clinical cancer care. It also discusses how molecular MR, in conjunction with other structural and functional MR imaging techniques, paves the way for developing tailored treatment strategies to enhance cancer care.


Figures
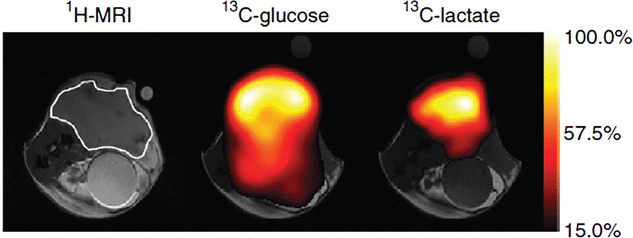
Fig. 1
Fig. 1
Anatomical image is showing a subcutaneous EL4 tumor in a mouse model. Chemical-shift imaging for 13C-glucose and 13C-lactate from the same animal was obtained 15 s after intravenous injection of 0.4 mL of 200 mM hyperpolarized glucose. 13C-lactate signal demonstrates generation of lactate through anaerobic glycosylation. This material was reproduced with permission from the Nature Publishing Group and Rodrigues et al. [77]
Fig. 2
Fig. 2
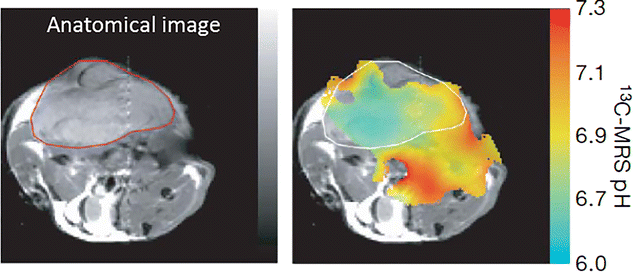
pH mapping of tumor tissue. Anatomical image is showing a subcutaneously implanted EL4 tumor. The pH map generated by calculating the ratio of the hyperpolarized H13CO3 and 13CO2 voxel intensities using handersal-hasselbatch equation. Reproduced with permission from the Nature Publishing Group and Gallagher et al. [78]
Fig. 3
Fig. 3
APT imaging of brain tumor (glioblastoma multiforme) in a human patient. Anatomical T2 weighted (a) and post contrast T1 weighted (b) images are showing diffuse tumor in parietal lobe. APT weighted image (c) shows high contrast in tumor than normal brain parenchyma. Immunohistochemical staining of Ki-67 (d) shows very high proliferative activity in tumor with high cellular density. Reproduced with permission from the Oxford University Press and Togao et al. [83]
Fig. 4
Fig. 4
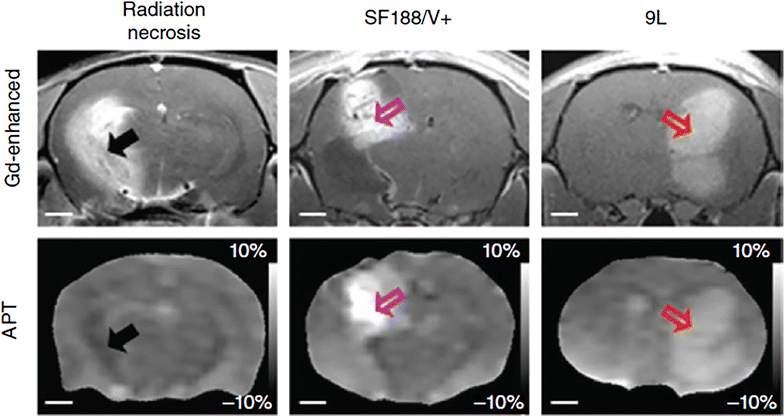
Differentiation of radiation necrosis and glioma using APT MRI. MRI of radiation treated animals is performed after 178 days of 40 GY radiation treatment. Radiation necrosis (black arrow) area as revealed by Gd enhancement shows hypointense to isointense on APT weighted image compared to contralateral brain tissue. While both SF188/V + (pink arrow) and 9L (red arrow) tumors show hyperintensity both on the Gd enhanced and APT-weighted images, which correspond to high cellularity. Reproduced with permission from the Nature Publishing Group and Zhou et al. [89]
Fig. 5
Fig. 5
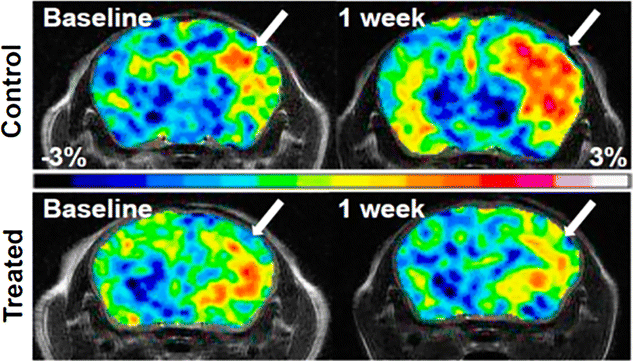
Monitoring TMZ treatment response in mouse model of human glioblastoma multiforme using APT contrast. APT weighted images are showing increased APT contrast in control animal than treated animal. Lower contrast in treated group corresponds to decreased tumor cells proliferation. Reproduced with permission from the National Academy of Sciences and Sagiyama et al. [90]
Fig. 6
Fig. 6
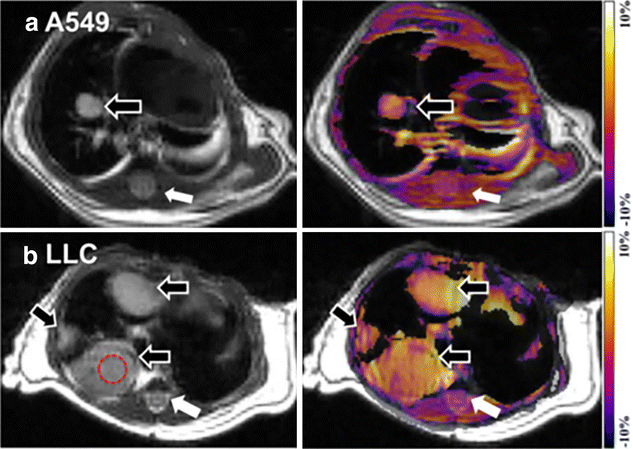
APT imaging of lung tumors. Anatomical proton weighted image and APT-weighted images of A549 (a) and LLC (b) tumors in mouse model. Both the tumors showed higher APT contrast than surrounding tissues including spinal cord (white arrows) and skeletal muscles. Higher CEST contrast is detectable on LLC tumor than A549 tumor (black arrow). Reproduced with permission from Public Library of Science and Togao et al. [84]
Fig. 7
Fig. 7
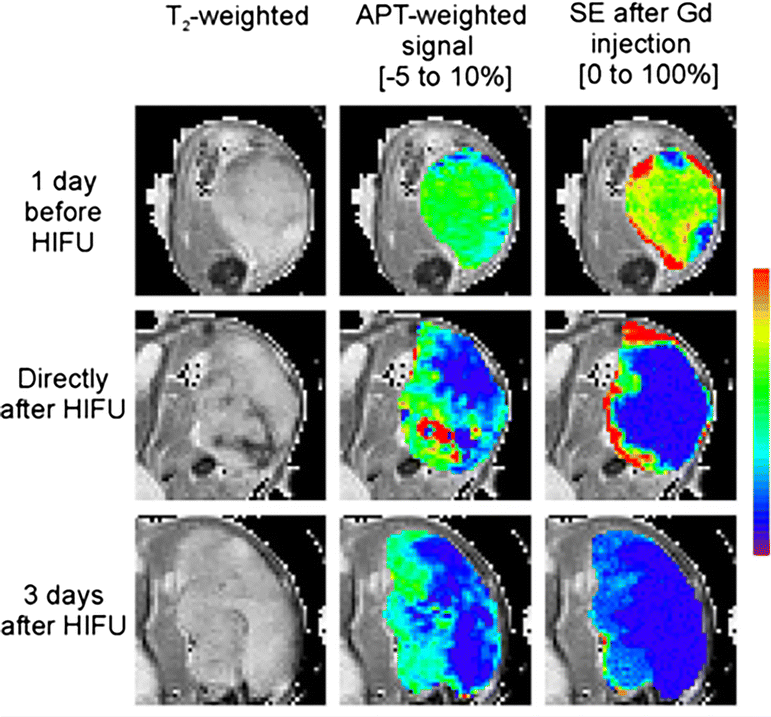
Monitoring HIFU treatment in cancer. Proton anatomical image, APT weighted image and GD contrast enhanced image show the changes in tumor following HIFU treatment. Decreased APT contrast following HIFU was observed which is comparable to the Gd based contrast enhancement study. Reproduced with permission from John Wiley and Sons and Hectors et al. [91]
Fig. 8
Fig. 8
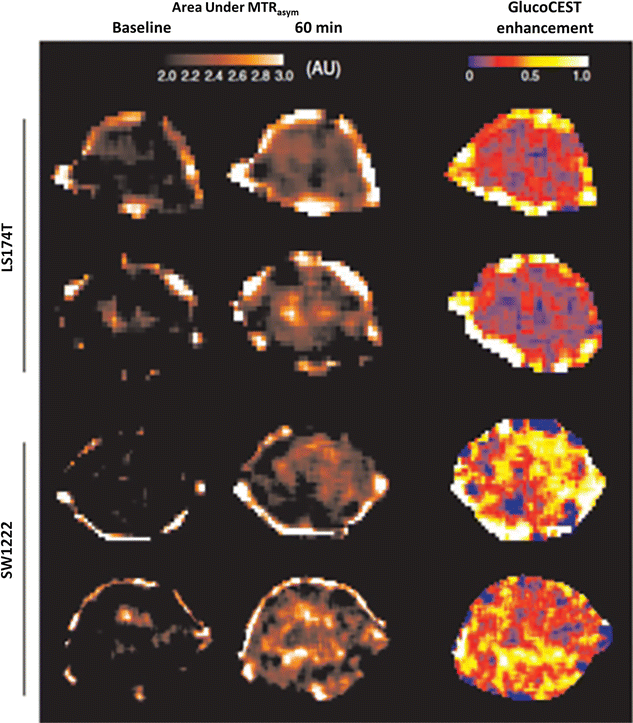
GluCEST imaging in mouse model of colorectal cancers (SW1222 than LS174T). SW1222 cancers show higher GluCEST contrast than LS174T cancers. Reproduced with permission from the Nature Publishing Group and Walker-Samuel et al. [95]
Fig. 9
Fig. 9
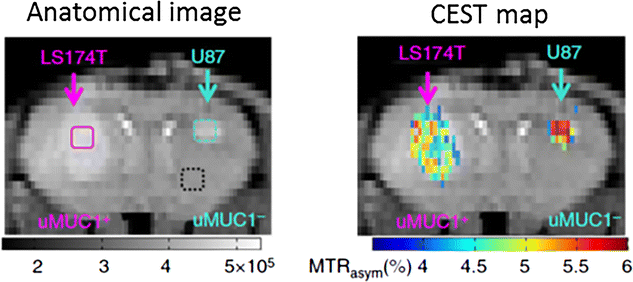
Mucin dependent CEST contrast imaging. Underglycosylatedmucin 1 (uMUC1+) overexpressed in LS174T which shows significantly low CEST contrast compared to the U87 tumor which is devoid of mucin expression. Reproduced with permission from the Nature Publishing Group and Song et al. [97]
Fig. 10
Fig. 10
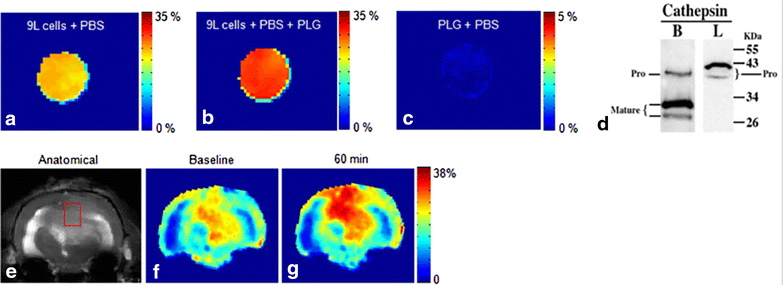
CEST imaging of protease enzyme expression in cancer. a GluCEST map of 9L cancer cells cultured without PLG. b GluCEST map of 9L cell line cultured in the presence of PLG showed ~17 % increased GluCEST contrast compared to (a), which is due to the cleavage of PLG by CtB present in the tumor cells. c PLG solution in PBS does not show any appreciable GluCEST contrast. d Western blot analysis shows expression of cathepsin B in both mature and pro form while cathepsin L only in the pro form. The cleavage of PLG in this tumor cell line is predominantly due to CtB. e, f Anatomical image and GluCEST map from a rat brain with a 9L tumor. g At 60 min post intra-venous injection of PLG increased GluCEST contrast was observed in the tumor region due to cleavage of PLG possibly by proteases. Reproduced with permission from the Nature Publishing Group and Haris et al. [100]
Fig. 11
Fig. 11
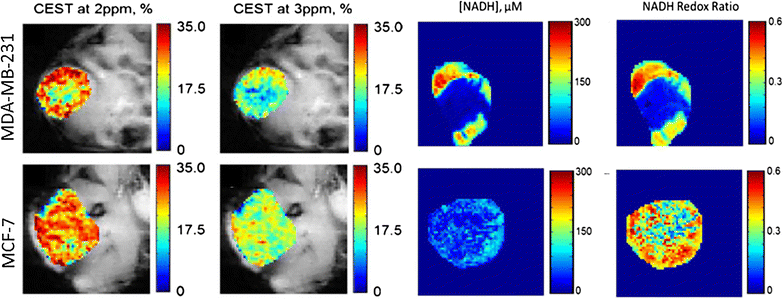
CEST imaging of breast cancer. CEST maps (at 2 and 3 ppm) of flank MDA-MB-231 and MCF-7 mice breast cancers models. NADH and NADH redox ratio show higher rim to core ratio of NADH concentration in MDA-MB-231 than MCF-7 tumor. Reproduced with permission from Springer and Cai et al. [104]
Fig. 12
Fig. 12
Reporter gene imaging. Reporter gene inserted in the downstream of a gene promoter. The promotor activation transcribes reporter gene to reporter mRNA, which produces reporter protein after translation. The reporter protein converts the substrate or probe into active form which can be imaged using MRI
Fig. 13
Fig. 13
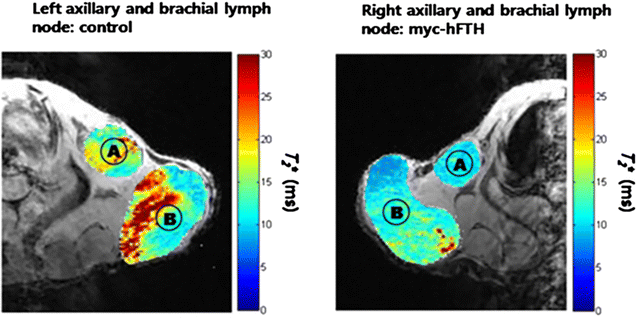
In vivo imaging of metastatic cells expressing myc-tagged human ferritin heavy chain (myc-hFTH) in lymph nodes (LNs). T2* map of metastasis from control and myc-hFTH cells in the left and right axillary (A) and brachial (B) LNs in nude mice. Reproduced with permission from John Wiley and Sons and Choi et al. [107]
Fig. 14
Fig. 14
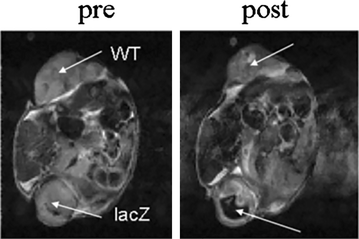
MRI detection of beta b-gal activity in MCF breast tumor transfected with lac Z. After intratumoral injection of S-Gal and ferric ammonium citrate, the tumor expressing lac Z shows strong hypointense contrast [111]. Reproduced with permission from John Wiley and Sons and Cui et al. [111]
Fig. 15
Fig. 15
Lysine rich protein (LRP) based MR reporter genes transfected with the 9L gliosarcoma cells before implantation in the rat brain. On anatomical imaging both the LRP and control xenografts show the similar signal intensity (a). The CEST map highlighted the LRP xenograft due to the expression of lysine rich protein, which can be easily detected through APT CEST (b). Reproduced with permission from the Nature Publishing Group and Gilad et al. [112]
Fig. 16
Fig. 16
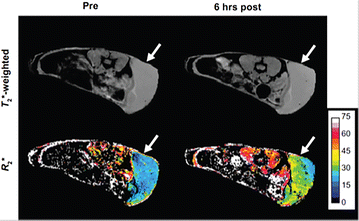
Tracking the NK cells in mouse model of Daudi Burkitt’s lymphoma. Axial T2*-weighted gradient echo images show the flank tumor (arrow). The corresponding R2* maps show increase in R2 signal 6 h post ferumoxytol-labeled NK cells injection. Reproduced with permission from Thomas Hill Publisher and Sta Maria et al. [116]

References

    1. Weissleder R. Molecular imaging in cancer. Science. 2006;312:1168–1171. doi: 10.1126/science.1125949. - DOI - PubMed
    1. Schillaci O. Single-photon emission computed tomography/computed tomography in lung cancer and malignant lymphoma. Semin Nucl Med. 2006;36:275–285. doi: 10.1053/j.semnuclmed.2006.05.003. - DOI - PubMed
    1. Vangestel C, Van de Wiele C, Mees G, Mertens K, Staelens S, Reutelingsperger C, Pauwels P, Van Damme N, Peeters M. Single-photon emission computed tomographic imaging of the early time course of therapy-induced cell death using technetium 99 m tricarbonyl His-annexin A5 in a colorectal cancer xenograft model. Mol Imaging. 2012;11:135–147. - PubMed
    1. Gambhir SS. Molecular imaging of cancer with positron emission tomography. Nat Rev Cancer. 2002;2:683–693. doi: 10.1038/nrc882. - DOI - PubMed
    1. Weber WA. Use of PET for monitoring cancer therapy and for predicting outcome. J Nucl Med. 2005;46:983–995. - PubMed