. 2016 Jun;25(2):123-44.
doi: 10.1002/mpr.1495. Epub 2015 Sep 22.

HowNutsAreTheDutch (HoeGekIsNL): A crowdsourcing study of mental symptoms and strengths

Affiliations

HowNutsAreTheDutch (HoeGekIsNL): A crowdsourcing study of mental symptoms and strengths

Lian Van Der Krieke et al. Int J Methods Psychiatr Res. 2016 Jun.

Abstract

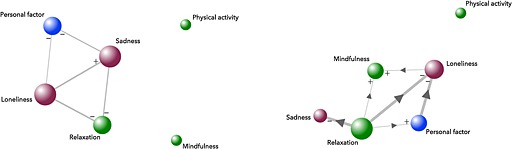
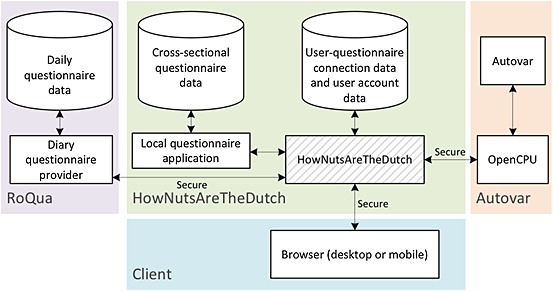
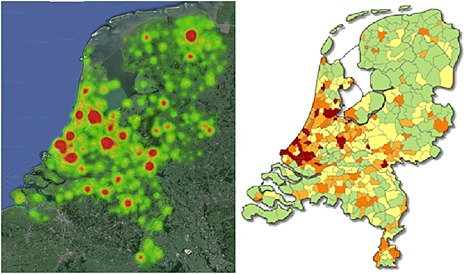
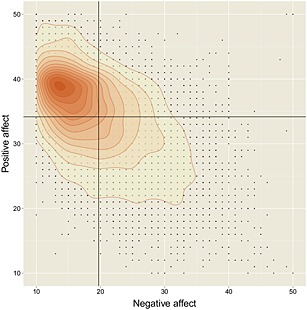
HowNutsAreTheDutch (Dutch: HoeGekIsNL) is a national crowdsourcing study designed to investigate multiple continuous mental health dimensions in a sample from the general population (n = 12,503). Its main objective is to create an empirically based representation of mental strengths and vulnerabilities, accounting for (i) dimensionality and heterogeneity, (ii) interactivity between symptoms and strengths, and (iii) intra-individual variability. To do so, HowNutsAreTheDutch (HND) makes use of an internet platform that allows participants to (a) compare themselves to other participants via cross-sectional questionnaires and (b) to monitor themselves three times a day for 30 days with an intensive longitudinal diary study via their smartphone. These data enable for personalized feedback to participants, a study of profiles of mental strengths and weaknesses, and zooming into the fine-grained level of dynamic relationships between variables over time. Measuring both psychiatric symptomatology and mental strengths and resources enables for an investigation of their interactions, which may underlie the wide variety of observed mental states in the population. The present paper describes the applied methods and technology, and presents the sample characteristics. Copyright © 2015 John Wiley & Sons, Ltd.

Keywords: crowdsourcing; ecological momentary assessment; longitudinal; mental strengths and resources; mental symptoms.


Figures

Figure 1
Figure 1
Example of a personal network model showing concurrent (left) and dynamic relationships (right) between diary items. Note: Red nodes represent variables that tend to be perceived as negative (e.g. loneliness, sadness). Green nodes represent variables that tend to be perceived as positive (e.g. relaxation, mindfulness, feeling cheerful). The blue node represents the personal variable that participants could choose to add to the diary assessment. This variable could either be “negative” or “positive” and could be different for each participant. The size of the node indicates its relative importance (i.e. the bigger a node, the more connections the variable has with other variables). The lines represent the connections between variables; the thickness indicates the strength of the relationship. A plus refers to a positive relationship; a minus refers to a negative relationship. The arrowheads (only in the dynamic networks) indicate the direction of the relationships.
Figure 2
Figure 2
Architectural overview of the HowNutsAreTheDutch (HND) web application. Note: The cylindrical shapes represent databases. The rectangular shapes depict (web) services. The hatched rectangle is the actual HND web application that serves the website.
Figure 3
Figure 3
Heat map of the cross‐sectional study participants' residence versus population density map. Note: The population density map on the right is derived from CBS statline and presents Dutch population densities per municipality in 2010 in terms of number of inhabitants per square kilometre: From low in green (21–250), via yellow (250–500) and orange (light: 500–1000, dark: 1000–2500) to red (2500–6000). The pictures show that the study coverage concurs very well with population density scores.
Figure 4
Figure 4
Positive and negative affect in the cross‐sectional sample. A scatterplot with scores of the Positive and Negative Affect Schedule (PANAS). The black lines in the figure indicate the mean values for positive affect (34.3) and negative affect (19.7). The darker the orange the higher the number of people with that specific score. The black dots represent actual observations.
Figure 5
Figure 5
The prevalence of the nine DSM depression symptoms. The prevalence for each number of depression symptoms in the HowNutsAreTheDuch (HND) sample and the Lifelines sample. The vertical axis shows the percentage of participants with this particular number of symptoms.

References

    1. Abdel‐Khalek A. (2006) Measuring happiness with a single‐item scale. Social Behavior & Personality: An International Journal, 34(2), 139–149.
    1. Arrindell W.A., Ettema J.H.M. (1986) SCL‐90. Handleiding bij een multidimensionale psyhopathologie indicator, Lisse: Swets & Zeitlinger.
    1. Baer R., Smith G., Hopkins J., Krietemeyer J., Toney L. (2006) Using self‐report assessment methods to explore facets of mindfulness. Assessment, 13(1), 27–45. DOI:10.1177/1073191105283504. - DOI - PubMed
    1. Baer R.A., Smith G.T., Lykins E., Button D., Krietemeyer J., Sauer S., Walsh E., Duggan D., Williams J.M.G. (2008) Construct validity of the five facet mindfulness questionnaire in meditating and nonmeditating samples. Assessment, 15(3), 329–342, DOI: 10.1177/1073191107313003 - DOI - PubMed
    1. Barge‐Schaapveld D.Q.C.M., Nicolson N.A., Berkhof J., deVries M.W. (1999) Quality of life in depression: daily life determinants and variability. Psychiatry Research, 88(3), 173–189. - PubMed