. 2015 Oct 15;142(20):3592-600.
doi: 10.1242/dev.123018. Epub 2015 Sep 22.

Large-scale live imaging of adult neural stem cells in their endogenous niche

Affiliations

Large-scale live imaging of adult neural stem cells in their endogenous niche

Nicolas Dray et al. Development. .

Abstract

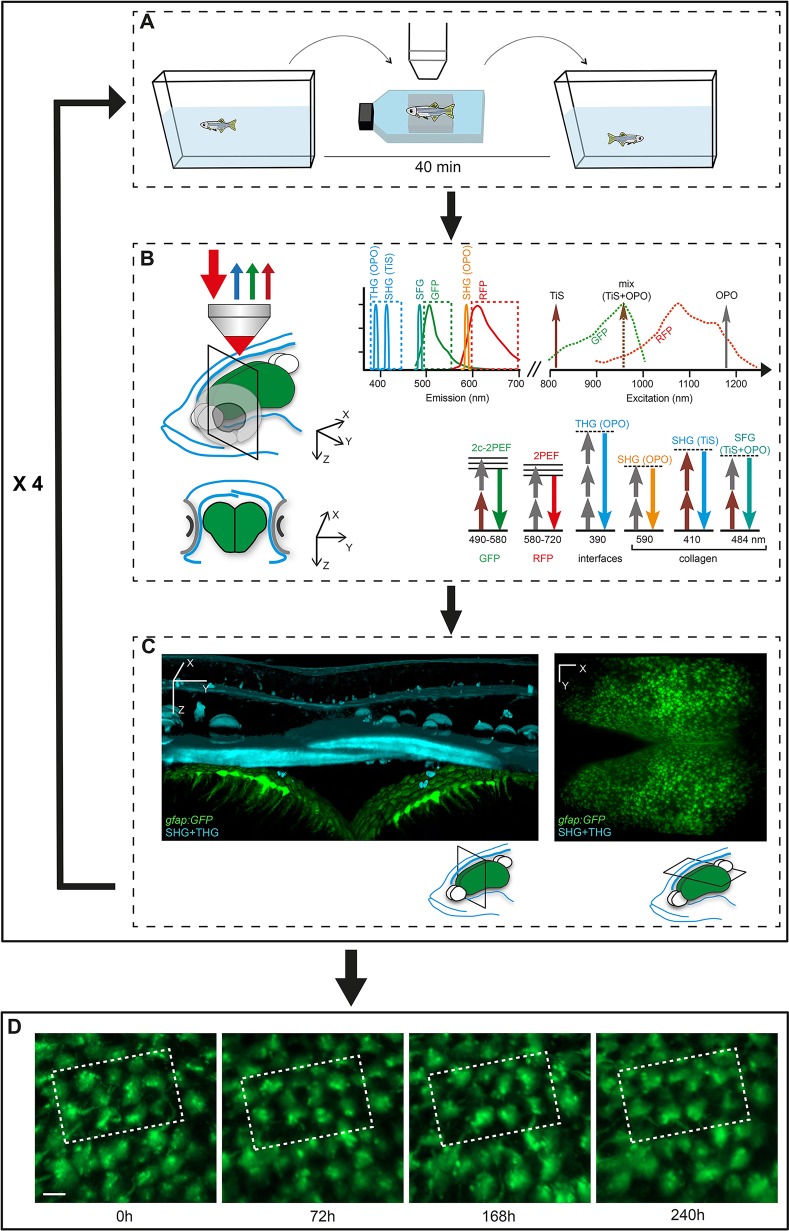
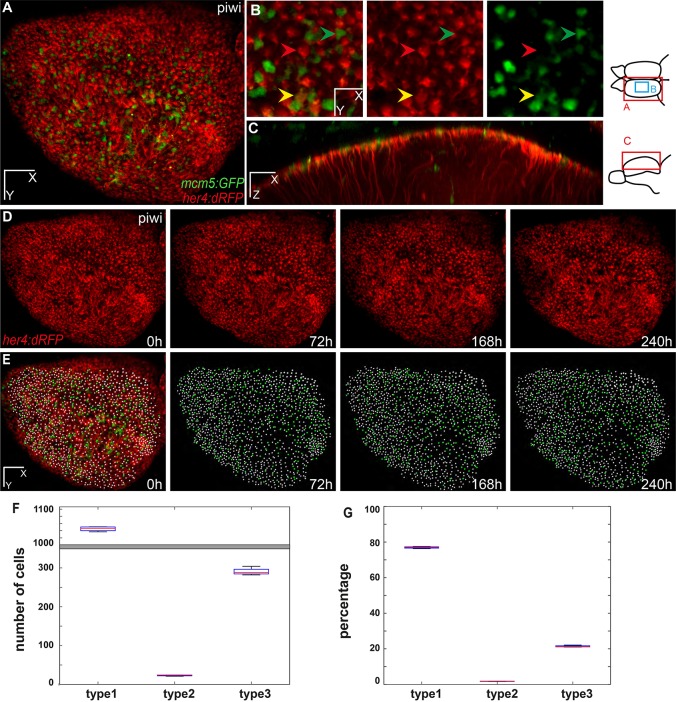
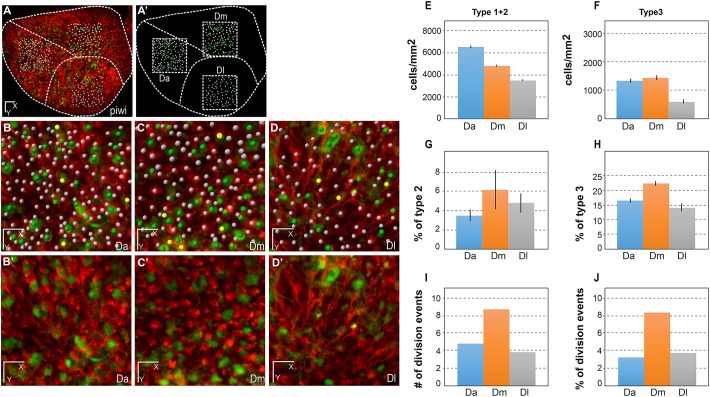
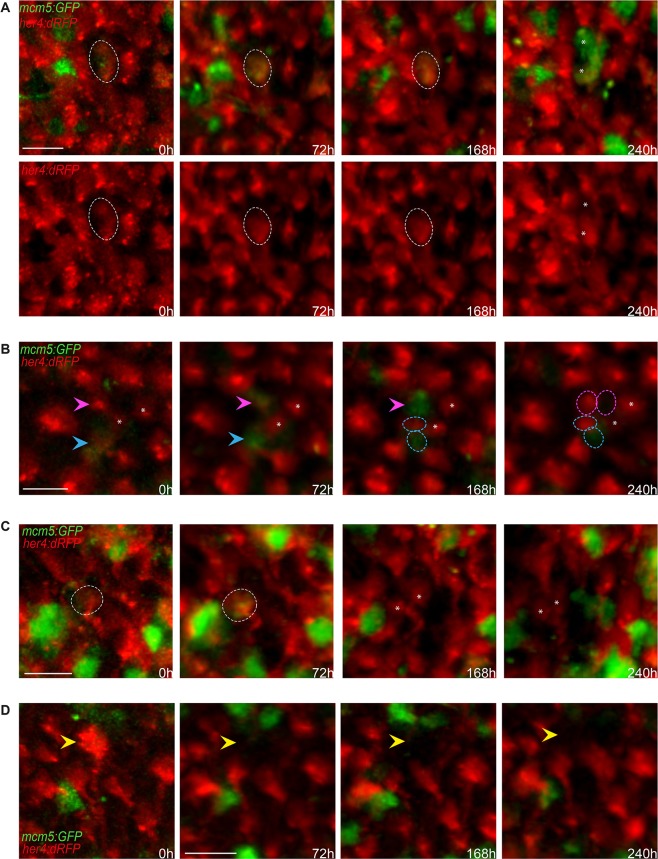
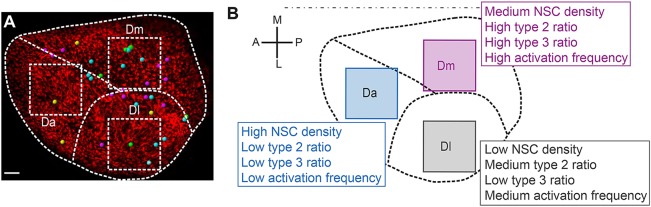
Live imaging of adult neural stem cells (aNSCs) in vivo is a technical challenge in the vertebrate brain. Here, we achieve long-term imaging of the adult zebrafish telencephalic neurogenic niche and track a population of >1000 aNSCs over weeks, by taking advantage of fish transparency at near-infrared wavelengths and of intrinsic multiphoton landmarks. This methodology enables us to describe the frequency, distribution and modes of aNSCs divisions across the entire germinal zone of the adult pallium, and to highlight regional differences in these parameters.

Keywords: Live imaging; Multiphoton microscopy; Neural stem cell; Pallium; SHG/THG; Zebrafish.


Conflict of interest statement

Competing interests

The authors declare no competing or financial interests.

Figures

Fig. 1.
Fig. 1.
Workflow for the tracking of zebrafish pallial aNSCs in their endogenous niche over weeks. (A) The transparent double mutant fish line casper, crossed into fluorescent GFP and/or RFP backgrounds highlighting aNSCs and/or cell division events, is subjected to reiterated imaging at intervals of a few days over a period of weeks (see Fig. S2). The whole procedure (anesthesia, positioning and imaging) takes around 40 min. (B) Combined multicolor fluorescence/harmonics multiphoton microscopy performed in vivo through the skin and skull (blue on the schematized fish head, left panel) down to the pallium (green) (top: lateral 3D view, bottom: cross section at the indicated plane) permits the concomitant recording of aNSCs (GFP, green arrows; RFP, red arrows) and skin/skull structures (SHG/THG harmonics, blue arrows). The combination of TiS and OPO laser excitation is schematized in the panel on the right, as well as the recorded signals (GFP, RFP, SHG, THG) and, when appropriate, the detected structure (e.g. collagen). (C) Harmonic signals revealing skin and skull morphology (blue on the 3D rendering of a thick optical cross section from an entire whole-mount imaging stack, left panel) are used to position the fish in an identical manner over the different imaging sessions. The aNSC layer (green, with processes extending into the brain parenchyma) is visible as a fluorescent signal underneath (left panel), or can be shown as a single whole-mount dorsal fluorescent recording (right panel). (D) The images recorded over consecutive sessions (repetitions of the sequence shown in A-C, e.g. here four times at a few days interval) are aligned using SHG/THG signals, followed by manual corrections using Imaris, to track individual cells over time. Dashed boxes outline the same group of cells recognizable over the consecutive time points. Scale bars: 50 μm (C), 15 μm (D).
Fig. 2.
Fig. 2.
Live imaging and tracking over 10 days of all adult neural stem cells across the entire pallial germinal zone. (A-C) One hemisphere of a her4:dRFP;mcm5:eGFP;casper transgenic fish (individual fish named piwi) imaged through the skin and skull. Anterior to the left. (A) Dorsal view of an entire hemisphere. (B) High magnification of a central area of the medial pallium, observed live, highlighting examples of quiescent RG (type 1), proliferating RG (type 2) and proliferating non-glial progenitors (type 3 cells) (red, yellow and green arrowheads, respectively). (C) Optical sagittal section showing the processes of the glial cells through the parenchyma. Diagrams to the right show the regions imaged for A,B and C. (D,E) Dorsal views of the pallial germinal zone in the same animal after alignment over 10 days of imaging. (D) Red channel highlighting all RG cells. (E) RG cells (white dots; 1122 cells on average, s.d.=13) and proliferating cells (green dots; 290 cells on average, s.d.=9) plotted over time across the entire germinal zone (superimposed to the fluorescence image on the left panel). (F,G) Box plot of the total number (F) and percentage (G) of progenitor cells of each type, averaged over the different time points of imaging. The mean number of type 1 cells counted is 1042 (s.d.=7.6), of type 2 cells is 91 (s.d.=6.6) and of type 3 cells is 391 (s.d.=9.5). The percentages of type 1, 2 and 3 cells over all cells (type 1+2+3) are 73.5%, 5.7% and 20.6%, respectively. Scale bars: 80 μm (A,D,E), 30 μm (B), 50 μm (C).
Fig. 3.
Fig. 3.
Quantitative analysis of dynamic NSC parameters in distinct domains of the pallial germinal zone (Da, Dm and Dl) in the fish named piwi. (A,A′) Live image of the pallial germinal zone showing her4:drfp-positive NSCs (red) and mcm5:egfp dividing cells (green) (A) and positioning of the three sampled subdomains (dashed squares representing a top view of the sampled cubes) (A′). Dashed lines separate the corresponding neuroanatomical domains. Anterior to the left, midline to the top. Da, anterior pallium; Dm, medial pallium; Dl, lateral pallium. Adapted from Wullimann et al. (1996). (B-D′) High magnification views of the three domains, as indicated, with (B-D) and without (B′-D′) individual cell plotting. White dots, quiescent NSCs; yellow dots, activated NSCs; green dots, dividing her4-drfp-negative progenitors. (E-H) Quantification of NSC parameters over 10 days (t1-t4). All statistics are paired t-tests, with standard deviations indicated as vertical bars. The average numbers of NSCs counted for each domain per time point are 151 (Da), 109 (Dm) and 83 (Dl). (E) NSC density in each domain, measured as the total number of type 1+type 2 cells per mm2 of germinal zone surface (see Materials and Methods for the calculation of this surface taking into account the germinal zone curvature). Da versus Dm: P<0.001; Da versus Dl: P<0.0001; Dm versus Dl: P<0.0001. (F) Density of type 3 cells (non-glial proliferating progenitors), measured as the total number of type 3 cells per mm2. Da versus Dm: P<0.1; Da versus Dl: P<0.0001; Dm versus Dl: P<0.0001. (G) Proportion of activated NSCs (type 2 cells) in each domain among the total NSC population (type 1+type 2 cells). Da versus Dm: P<0.1; Da versus Dl: P<0.05; Dm versus Dl: not significant. (H) Proportion of type 3 cells among the total progenitor population (type 1+type 2+type 3 cells). Da versus Dm: P<0.001; Da versus Dl: P<0.05; Dm versus Dl: P<0.01. (I,J) Quantification of de novo NSC activation events over 7 days (t2-t4) in absolute numbers (I) and in proportion of the number of RG quiescent at time t4 (J). Da versus Dm: P=0.1 (not quite significant); Da versus Dl: P=0.7, not significant; Dm versus Dl: P=0.5 (not significant); Fisher's two-tailed test. Scale bars: 50 μm (A,A′), 30 μm (B-D′).
Fig. 4.
Fig. 4.
Qualitative evaluation of NSC fate over 10 days across the entire pallial germinal zone. (A-D) Detailed views (dorsal) of groups of cells in a her4:dRFP;mcm5:eGFP;casper transgenic fish (individual fish named piwi) observed in vivo through the skin and skull over four time points (t1-t4) spanning 10 days. (A) Example of a gliogenic (self-renewing) division with asymmetrical outcome at time t4. The circle outlines an RG cell expressing RFP and GFP on the first and following days, which divided at t4 to give rise to two daughter cells (asterisks) that maintained GFP expression but only one of which (bottom cell) expresses RFP (and harbors a process, not shown). Top panel: merged channels; bottom panels: red channel only. (B) Examples of two other gliogenic (self-renewing) divisions with asymmetrical outcome at time t4. The magenta arrowhead indicates an RG cell expressing RFP on the first day, switching on GFP at t2 and dividing at t4 to give rise to two daughter cells (circles), both non-proliferating, one expressing RFP (and harboring a process, not shown). The cyan arrowhead indicates an RG cell expressing RFP and GFP on the first and following days and dividing at t4 to give rise to two daughter cells (circles), one expressing GFP and the other RFP (and harboring a process, not shown). Asterisks indicate two quiescent cells that serve as references. (C) Example of a symmetric gliogenic division. The circle indicates an RG cell expressing RFP on the first day, then switching on GFP and dividing to give rise to two identical RFP-positive, GFP-negative (quiescent) daughter cells (asterisks). (D) Example of an RFP-positive RG cell (yellow arrowhead) losing RFP expression over the time course of analysis; this is interpreted as the cell switching fate and delaminating into the parenchyme. Scale bars: 20 μm (A-D).
Fig. 5.
Fig. 5.
Schematic summary of the distinct NSC parameters observed across the pallial germinal zone. (A) Spatial distribution of the different types of division events completed over the imaging period (Table S2, cases 6 to 9) among 1138 tracked cells (from Fig. 4, Fig. S12). Yellow dots, symmetric gliogenic symmetric divisions; cyan dots, asymmetric gliogenic generating a RG and a ‘lost’ cell at t4; magenta dots, asymmetric gliogenic generating a RG and a proliferating progenitor at t4; green dots, symmetric with an undetermined fate of both daughters. These correspond respectively to cases 6 to 9 in Table S2. (B) Cell density and activation frequency parameters mapped in Da, Dm and Dl (from Figs 2 and 3 and Fig. S11). In both panels, one hemisphere is shown, anterior to the left. Scale bar: 50 μm.

References

    1. Adolf B., Chapouton P., Lam C. S., Topp S., Tannhäuser B., Strähle U., Götz M. and Bally-Cuif L. (2006). Conserved and acquired features of adult neurogenesis in the zebrafish telencephalon. Dev. Biol. 295, 278-293. 10.1016/j.ydbio.2006.03.023 - DOI - PubMed
    1. Barbosa J. S., Sanchez-Gonzalez R., Di Giaimo R., Baumgart E. V., Theis F. J., Götz M. and Ninkovic J. (2015). Live imaging of adult neural stem cell behavior in the intact and injured zebrafish brain. Science 348, 789-793. 10.1126/science.aaa2729 - DOI - PubMed
    1. Bernardos R. L. and Raymond P. A. (2006). GFAP transgenic zebrafish. Gene Expr. Patterns 6, 1007-1013. 10.1016/j.modgep.2006.04.006 - DOI - PubMed
    1. Bouldin C. M. and Kimelman D. (2014). Dual fucci: a new transgenic line for studying the cell cycle from embryos to adults. Zebrafish 11, 182-183. 10.1089/zeb.2014.0986 - DOI - PMC - PubMed
    1. Chapouton P., Skupien P., Hesl B., Coolen M., Moore J. C., Madelaine R., Kremmer E., Faus-Kessler T., Blader P., Lawson N. D. et al. (2010). Notch activity levels control the balance between quiescence and recruitment of adult neural stem cells. J. Neurosci. 30, 7961-7974. 10.1523/JNEUROSCI.6170-09.2010 - DOI - PMC - PubMed

Publication types

Substances