. 2015 Oct 15;142(20):3519-28.
doi: 10.1242/dev.126581. Epub 2015 Sep 22.

Revising the embryonic origin of thyroid C cells in mice and humans

Affiliations

Revising the embryonic origin of thyroid C cells in mice and humans

Ellen Johansson et al. Development. .

Abstract

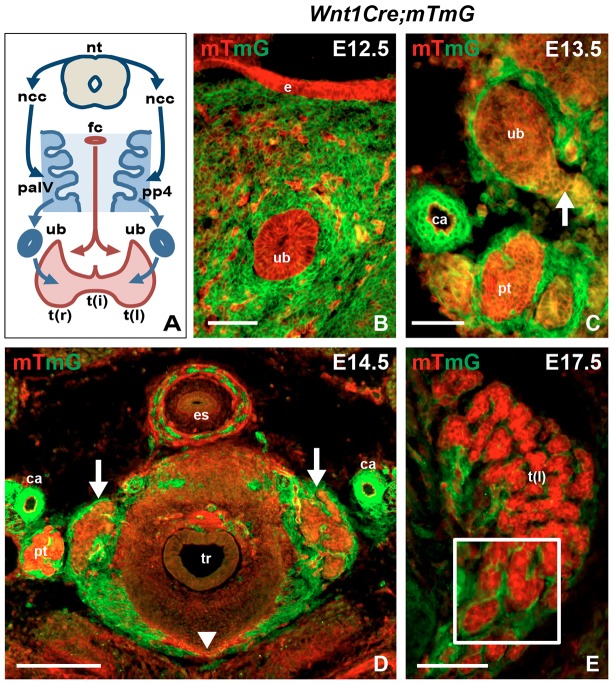
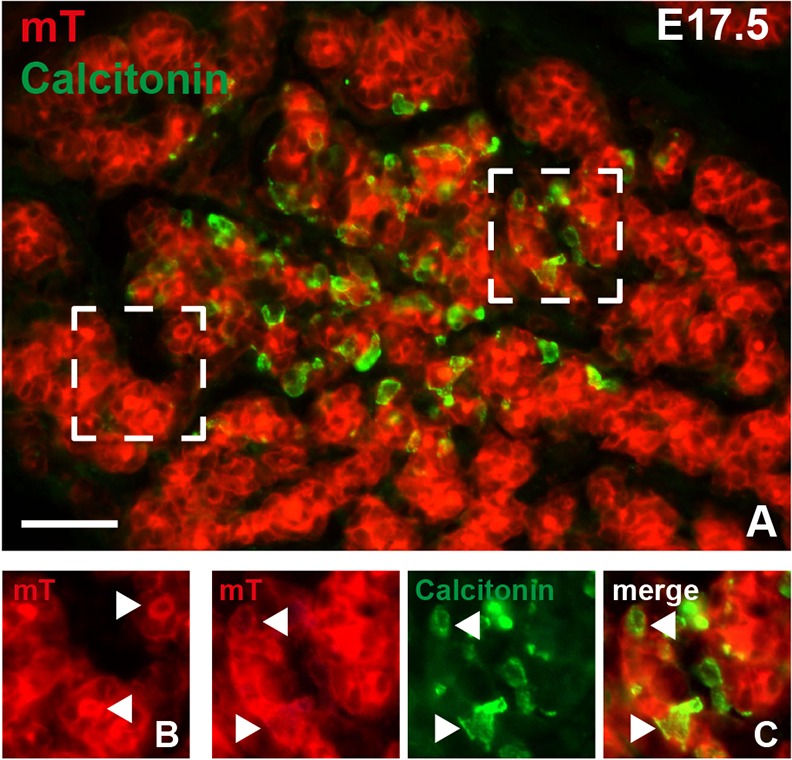
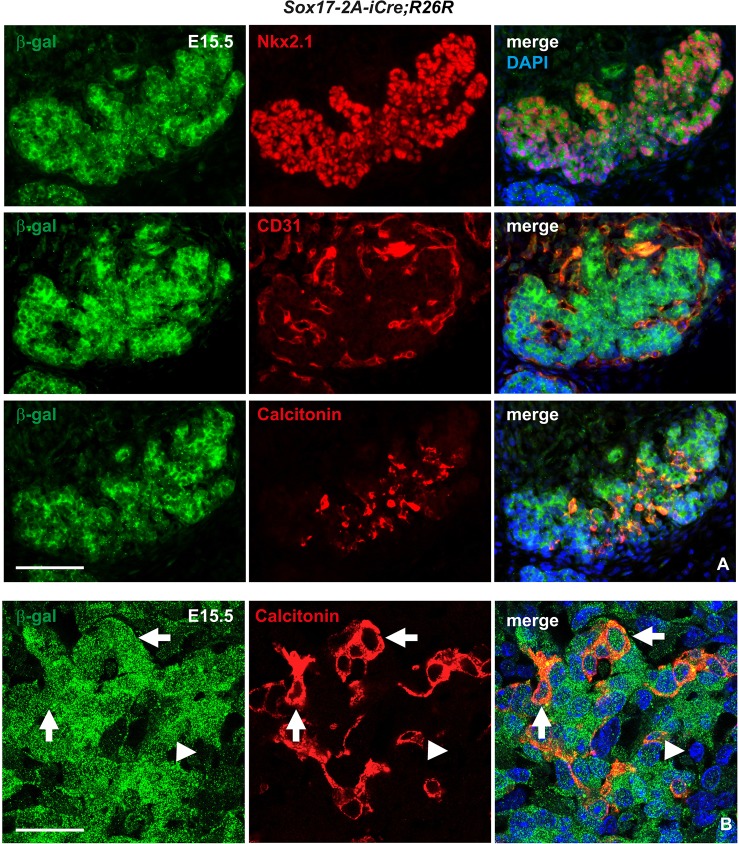
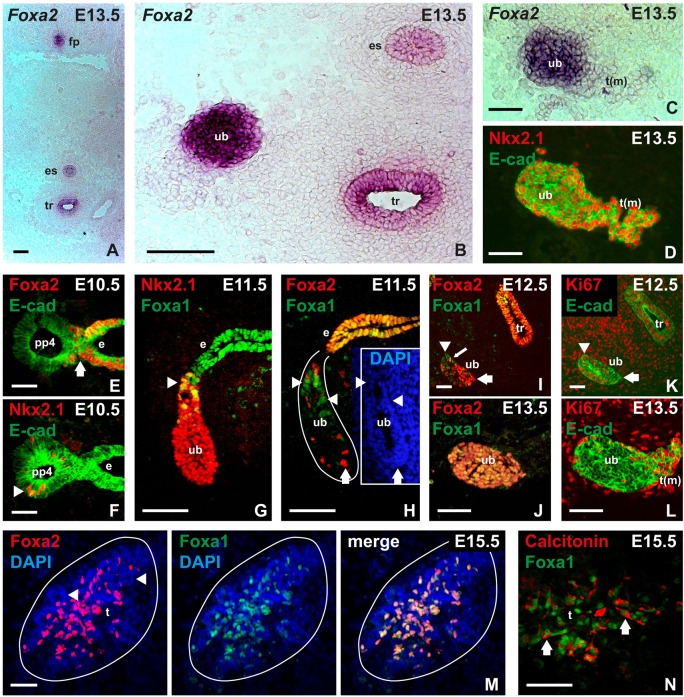
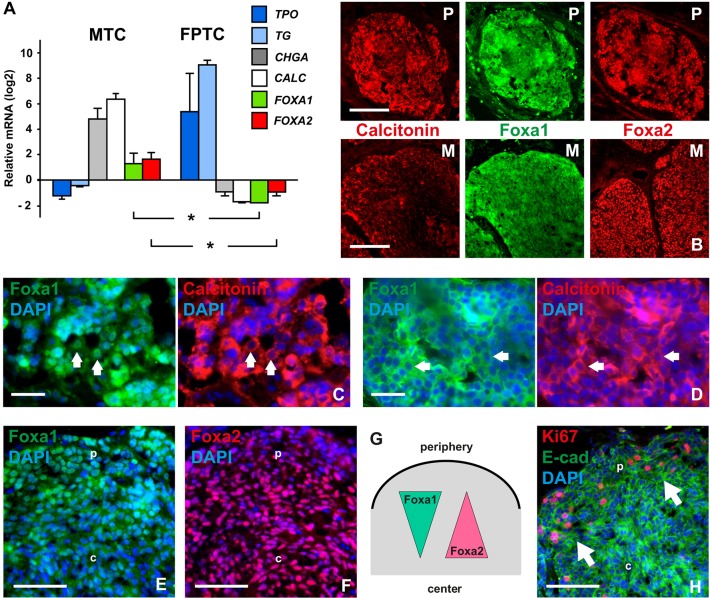
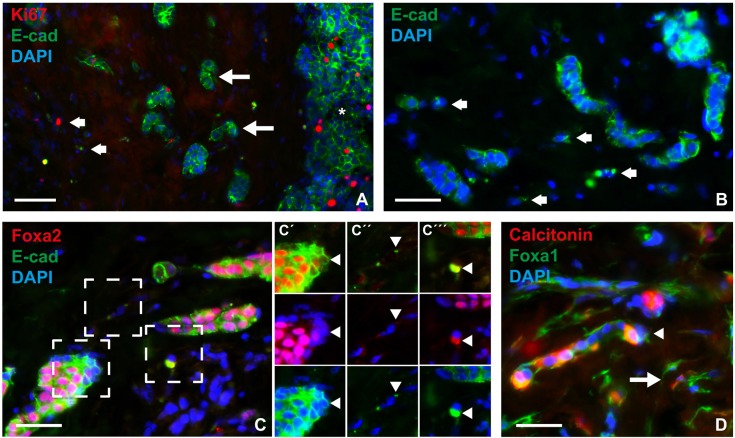
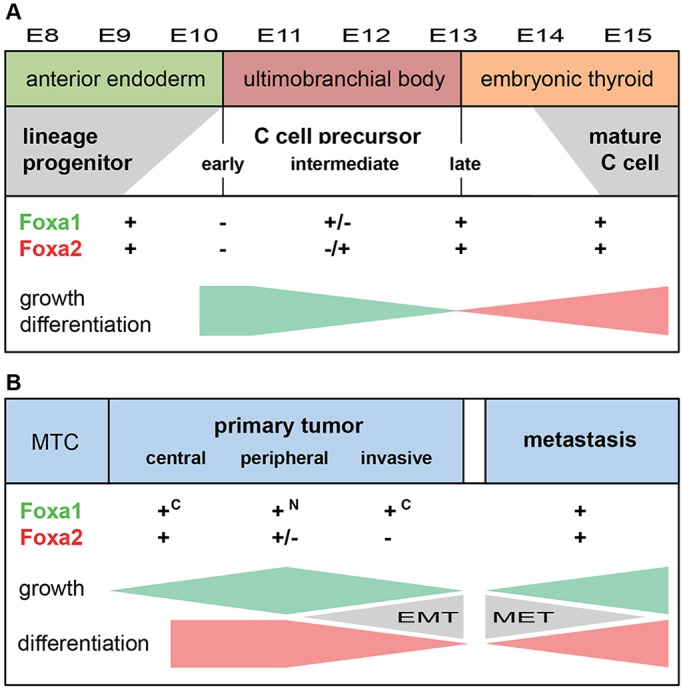
Current understanding infers a neural crest origin of thyroid C cells, the major source of calcitonin in mammals and ancestors to neuroendocrine thyroid tumors. The concept is primarily based on investigations in quail-chick chimeras involving fate mapping of neural crest cells to the ultimobranchial glands that regulate Ca(2+) homeostasis in birds, reptiles, amphibians and fishes, but whether mammalian C cell development involves a homologous ontogenetic trajectory has not been experimentally verified. With lineage tracing, we now provide direct evidence that Sox17+ anterior endoderm is the only source of differentiated C cells and their progenitors in mice. Like many gut endoderm derivatives, embryonic C cells were found to coexpress pioneer factors forkhead box (Fox) a1 and Foxa2 before neuroendocrine differentiation takes place. In the ultimobranchial body epithelium emerging from pharyngeal pouch endoderm in early organogenesis, differential Foxa1/Foxa2 expression distinguished two spatially separated pools of C cell precursors with different growth properties. A similar expression pattern was recapitulated in medullary thyroid carcinoma cells in vivo, consistent with a growth-promoting role of Foxa1. In contrast to embryonic precursor cells, C cell-derived tumor cells invading the stromal compartment downregulated Foxa2, foregoing epithelial-to-mesenchymal transition designated by loss of E-cadherin; both Foxa2 and E-cadherin were re-expressed at metastatic sites. These findings revise mammalian C cell ontogeny, expand the neuroendocrine repertoire of endoderm and redefine the boundaries of neural crest diversification. The data further underpin distinct functions of Foxa1 and Foxa2 in both embryonic and tumor development.

Keywords: Endoderm; Foxa1; Foxa2; Medullary thyroid cancer; Neural crest; Neuroendocrine.


Conflict of interest statement

Competing interests

The authors declare no competing or financial interests.

Figures

Fig. 1.
Fig. 1.
Thyroid development and contribution of the neural crest to the pharyngeal apparatus. (A) Overview of mammalian thyroid development from a median (red) and two lateral (blue) anlagen and the contribution of neural crest to ectomesenchyme of the pharyngeal apparatus. Arch and pouch numbers refer to mouse embryos. (B-E) Tracing Wnt1+ progeny during thyroid development. Wnt1-Cre mice were crossed to mT/mG reporter mice. Conversion from red (mT) to green (mG) fluorescence indicates activation of Cre recombinase (Muzumdar et al., 2007). Images are from transverse sections. (B) mT+ ultimobranchial body surrounded by mG+ cells. Scattered mT+ cells are endothelial. (C) mT+ ultimobranchial body merging with the median thyroid primordium (lateral part of the latter indicated with arrow). (D) Orthotopic thyroid after fusion of primordia (arrows indicate the two lobes, arrowhead indicates limited part of the isthmus). (E) Thyroid lobe undergoing follicular organization. Note distribution of Wnt1+ cells limited to the interstitial space in between trabecular parenchyma (inset, magnified part of motif). ca, carotid artery; e, pharyngeal endoderm; es, esophagus; fc, foramen caecum; ncc, neural crest cells; nt, neural tube; pa, pharyngeal arch; pp, pharyngeal pouch; pt, parathyroid; t(i), thyroid isthmus; t(l), left thyroid lobe; t(r), right thyroid lobe; tr, trachea; ub, ultimobranchial body. Scale bars: 200 µm (D); 100 µm (E); 50 µm (B,C).
Fig. 2.
Fig. 2.
Localization of embryonic thyroid C cells in Wnt1-Cre;mT/mG mouse embryos. Calcitonin immunoreactivity was detected with streptavidin–fluorescein isothiocyanate. (A) Overview of central part of thyroid lobe. Two areas (dashed boxes) are shown in detail in B (left area) and C (right area). (B) Membranous mT fluorescence in thyroid follicular cells. Note enhanced mT labeling of the apical surface facing the follicle lumen (arrowheads). (C) Thyroid C cells are confined to the Tomato red-positive parenchymal compartment. Note colocalization of mT and calcitonin (arrowheads). Scale bar: 50 µm.
Fig. 3.
Fig. 3.
Tracing Sox17+ progeny in embryonic thyroid in Sox17-2A-iCre;R26R mice. Immunofluorescence images of single and merged channels of the indicated markers from serial sections of the same specimen; merged images additionally show 4′,6-diamidino-2-phenylindole (DAPI) nuclear stain. (A) Coexpression of β-galactosidase (β-gal) and Nkx2-1 in follicular cells (upper panel), β-gal and CD31 in endothelial cells (middle panel), and β-gal and calcitonin in C cells (lower panel). (B) Colocalization of β-gal and calcitonin as revealed by confocal laser scan microscopy. Arrows indicate β-gal+ C cells. Arrowheads indicate β-gal– stromal cells. Scale bars: 100 µm (A); 25 µm (B).
Fig. 4.
Fig. 4.
Expression of forkhead box transcription factors Foxa1 and Foxa2 in mouse ultimobranchial bodies, C cell precursors and embryonic C cells. Analysis of wild-type embryos with in situ hybridization (A-C) and immunofluorescence (D-N), respectively. Endoderm and derivatives thereof were identified with E-cadherin (E-cad) as indicated. (A) Overview of Foxa2 expression in midline structures. (B) Foxa2 expression in the ultimobranchial body (image from a more posterior section to that shown in A). (C,D) Foxa2 at fusion of ultimobranchial body with midline thyroid as identified by Nkx2-1 expression (data from serial sections of the same specimen). (E) Loss of Foxa2 expression in the prospective ultimobranchial body; arrow indicates transition between fourth pharyngeal pouch and endoderm proper. (F) Nkx2-1+ cells (arrowhead) exclusively present in the fourth pouch of lateral pharyngeal endoderm. (G) Differential expression of Foxa1 (arrowhead) in the emerging Nkx2-1+ ultimobranchial body. (H-J) Distribution of Foxa1+ (arrowheads) and Foxa2+ (arrows) cells in the developing ultimobranchial body from the time of delamination (H) to fusion with midline thyroid (J). Inset (in H) outlines the ultimobranchial body epithelium co-stained with DAPI. Small arrow (in I) indicates a single Foxa1+/Foxa2+ cell. (K,L) Distribution of Ki67+ ultimobranchial body cells before (K) and at fusion with midline thyroid (L). Arrow and arrowhead in K correspond to the same labels in I for comparison with Foxa1/Foxa2 expression pattern. (M) Coexpression of Foxa1 and Foxa2 in C cell precursors dispersed in the thyroid lobe after fusion of primordia. Arrowheads indicate follicular parenchyma with DAPI staining only. (N) Coexpression of Foxa1 and calcitonin in embryonic thyroid C cells. Note separate staining of markers (arrows) confined to nucleus and cytoplasm, respectively. e, pharyngeal endoderm; es, esophagus; fp, floor plate; pp, pharyngeal pouch; t, embryonic thyroid; t(m), midline thyroid primordium; tr, trachea; ub, ultimobranchial body. Scale bars: 100 µm (C,D,G,H); 50 µm (A,B,E,F,I-L); 25 µm (M,N).
Fig. 5.
Fig. 5.
Expression of Foxa1 and Foxa2 in neuroendocrine thyroid cancer. (A) Comparison of microarray data sets from human medullary thyroid carcinoma (MTC; n=9) and follicular variant of papillary thyroid cancer (FPTC; n=7). FOXA1/FOXA2 expression levels relative to mRNAs of biomarkers for the respective tumor type (CALC, calcitonin; CHGA, chromogranin A; TG, thyroglobulin; TPO, thyroid peroxidase) are shown as the difference from the mean of all genes in each data set. Asterisks indicate P<0.001. Error bars represent s.d. (B-F) Immunofluorescence staining of Foxa1 and Foxa2 in tumor tissues from an MTC patient. Sections were co-stained for calcitonin to distinguish tumor from stromal cells. (B) Nodules from primary tumor (P) and lymph node metastasis (M) at low magnification. (C,D) Detailed views of tumor tissues with different cell densities. Arrows indicate accumulation of Foxa1 predominantly in nuclei (in C) or cytoplasm (in D) associated with low and high cellularity, respectively. (E) Nuclear accumulation of Foxa1 differs between peripheral (p) and central parts (c) of tumor nodule. (F) Expression levels of Foxa2 in peripheral (p) versus central parts (c) of tumor nodule. (G) Distinct expression pattern of Foxa1 and Foxa2 in MTC related to tumor tissue organization (depicted from data shown in E,F). Increase/decrease refers to nuclear accumulation. (H) Distribution of proliferating cells in tumor nodule. Arrows indicate clusters of Ki67+ cells in the peripheral zone (p) facing the tumor stroma. Ki67+ cells are not present in the nodule center (c). Scale bars: 100 µm (B); 25 µm (C,D); 50 µm (E,F,H).
Fig. 6.
Fig. 6.
Altered Foxa2 expression in invasive MTC tumor cells. Sections were co-stained for E-cadherin (E-cad) to evaluate concurrent epithelial-to-mesenchymal transition. (A) Overview of tumor invasive zone. Large arrows indicate clusters of infiltrating tumor cells close to a large tumor nodule (asterisk); small arrows indicate distanced single tumor cells. Note that Ki67+ cells are not enriched in the tumor stroma compared with solid tumor nodule. (B) Redistribution of E-cadherin from the surface of single tumor cells (arrows). (C) Coordinated loss of Foxa2 in invasive tumor cells. Three areas (dashed boxes) of motif are shown in C′-C‴ with alternating channels for improved resolution: Foxa2 and E-cad (upper panel); Foxa2 and DAPI (middle panel); and E-cad and DAPI (lower panel). Arrowheads indicate different cell phenotypes further commented on in the Results. (D) Preserved expression of Foxa1 confined to the cytoplasm in infiltrating tumor cells. Note variable expression of calcitonin in both single tumor cells (arrow) and small aggregates (arrowhead). Scale bars: 50 µm (A); 25 µm (B-D).
Fig. 7.
Fig. 7.
Lineage development of mouse thyroid C cells and mechanisms of tumor progression in human medullary thyroid cancer proposed from findings in the present study. Altered expression of Foxa1 and Foxa2 is correlated with growth (represented by green gradients) and differentiation (represented by pink gradients) in a spatiotemporally distinct pattern that shows both similarities and differences between embryonic C cell precursors (A) and neoplastic C cells (B). See Discussion for further comments. c, cytoplasmic localization; EMT, epithelial-to-mesenchymal transition; MET, mesenchymal epithelial transition; MTC, medullary thyroid carcinoma; N, nuclear localization.

References

    1. Adams M. S. and Bronner-Fraser M. (2009). Review: the role of neural crest cells in the endocrine system. Endocr. Pathol. 20, 92-100. 10.1007/s12022-009-9070-6 - DOI - PubMed
    1. Blanpain C. and Simons B. D. (2013). Unravelling stem cell dynamics by lineage tracing. Nat. Rev. Mol. Cell Biol. 14, 489-502. 10.1038/nrm3625 - DOI - PubMed
    1. Bochkis I. M., Schug J., Ye D. Z., Kurinna S., Stratton S. A., Barton M. C. and Kaestner K. H. (2012). Genome-wide location analysis reveals distinct transcriptional circuitry by paralogous regulators Foxa1 and Foxa2. PLoS Genet. 8, e1002770 10.1371/journal.pgen.1002770 - DOI - PMC - PubMed
    1. Buckingham M. E. and Meilhac S. M. (2011). Tracing cells for tracking cell lineage and clonal behavior. Dev. Cell 21, 394-409. 10.1016/j.devcel.2011.07.019 - DOI - PubMed
    1. Burtscher I. and Lickert H. (2009). Foxa2 regulates polarity and epithelialization in the endoderm germ layer of the mouse embryo. Development 136, 1029-1038. 10.1242/dev.028415 - DOI - PubMed

Publication types

MeSH terms