Review
. 2016 Feb;48(2):82-92.
doi: 10.1152/physiolgenomics.00077.2015. Epub 2015 Sep 22.

Rodent models for resolving extremes of exercise and health

Affiliations
Review

Rodent models for resolving extremes of exercise and health

Fleur C Garton et al. Physiol Genomics. 2016 Feb.

Abstract

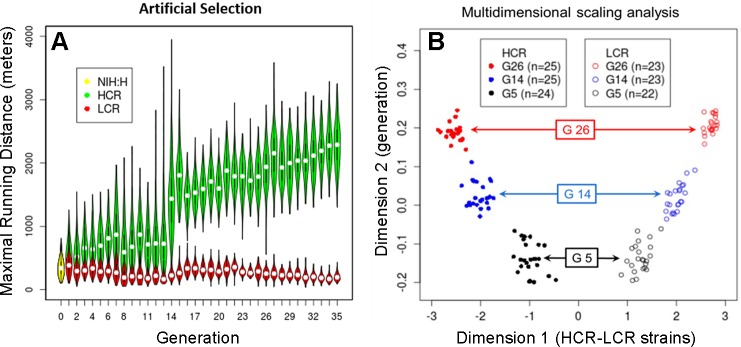
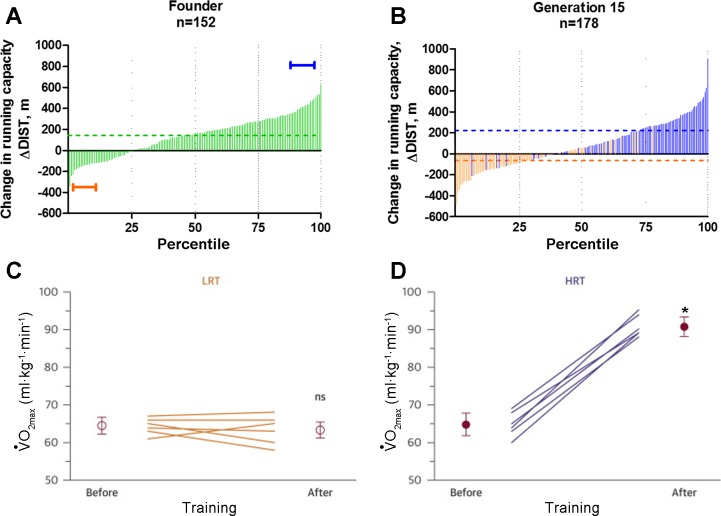
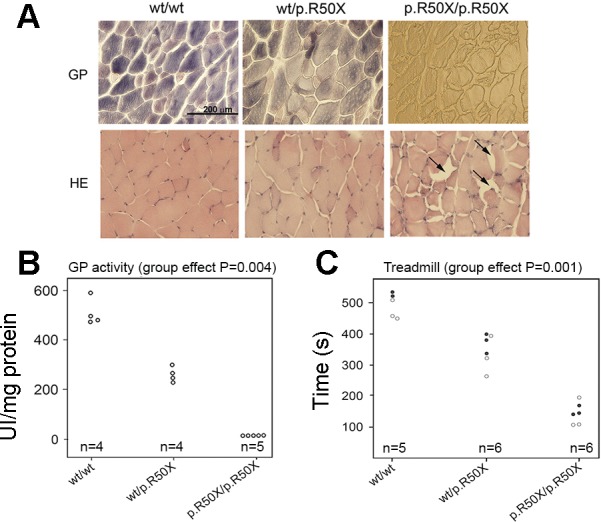
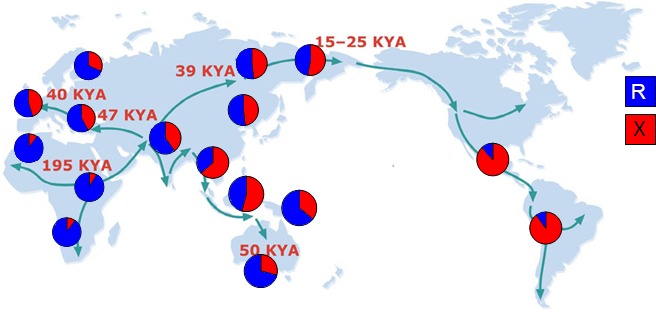
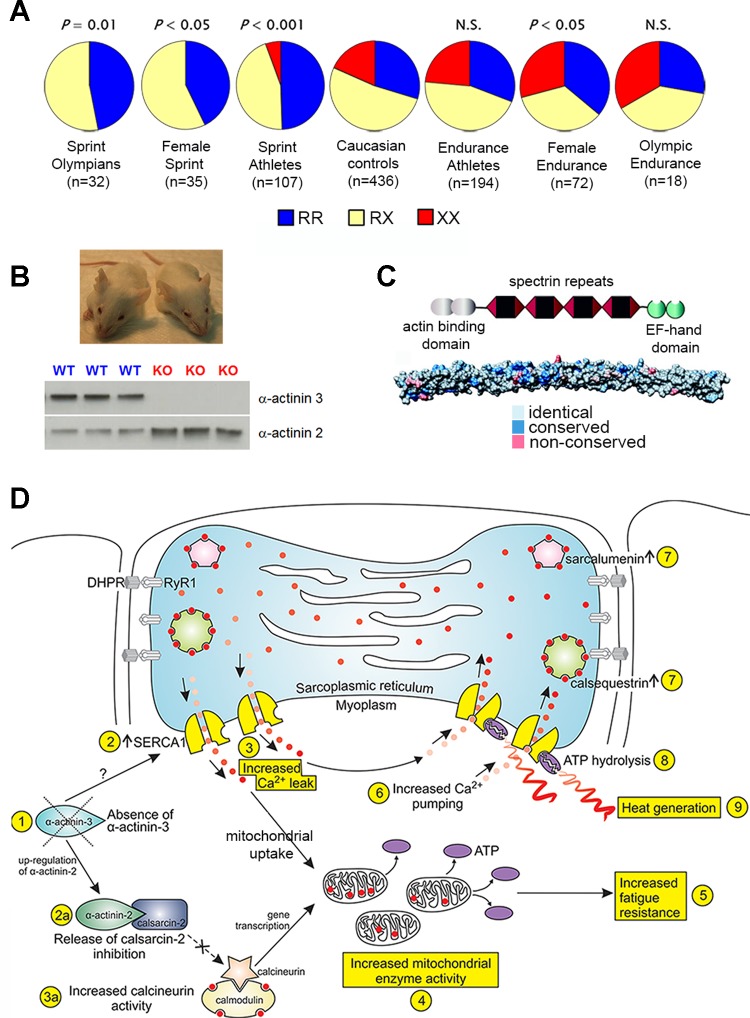
The extremes of exercise capacity and health are considered a complex interplay between genes and the environment. In general, the study of animal models has proven critical for deep mechanistic exploration that provides guidance for focused and hypothesis-driven discovery in humans. Hypotheses underlying molecular mechanisms of disease and gene/tissue function can be tested in rodents to generate sufficient evidence to resolve and progress our understanding of human biology. Here we provide examples of three alternative uses of rodent models that have been applied successfully to advance knowledge that bridges our understanding of the connection between exercise capacity and health status. First we review the strong association between exercise capacity and all-cause morbidity and mortality in humans through artificial selection on low and high exercise performance in the rat and the consequent generation of the "energy transfer hypothesis." Second we review specific transgenic and knockout mouse models that replicate the human disease condition and performance. This includes human glycogen storage diseases (McArdle and Pompe) and α-actinin-3 deficiency. Together these rodent models provide an overview of the advancements of molecular knowledge required for clinical translation. Continued study of these models in conjunction with human association studies will be critical to resolving the complex gene-environment interplay linking exercise capacity, health, and disease.

Keywords: disease; exercise; genetic loci; humans; mice; performance; rats.


Figures

Fig. 1.
Fig. 1.
A: selection for intrinsic running capacity. A violin plot for individual generations for females and males combined. The yellow oval to the left denotes the founder population (NIH:H, n = 153 phenotyped), while green and red ovals are for highest-capacity runners (HCR) and lowest-capacity runners (LCR) over 35 generations of selection. Each of the 71 “violins” conveys the density (via width) of the distribution for maximal distance run for each generation. The white dots indicate the median values, and the black vertical lines extending from the dots represent the range of the data that is within 1.5 times the interquartile range. A violin plot is essentially a box plot to which a rotated kernel density plot is added to each side of the box. B: progressive genetic differentiation revealed by 10K single nucleotide polymorphism genotyping data. A multidimensional scaling (MDS) plot (dimension 1 vs. 2) for 142 genotyped animals in 2 lines (LCR and HCR) and 3 generations, as indicated by different symbols. While the MDS plot is generated in an unsupervised fashion from the 142-by-142 pairwise distance matrix, dimension 1 reflects the HCR/LCR difference, and dimension 2 reflects the difference between generations. These patterns show that the 2 lines formed separate clusters at generation 5 (G5), and diverged further in G14 and G26. [B from Ren et al. (77) as permitted by PLoS One].
Fig. 2.
Fig. 2.
Selection for response to exercise training in genetically heterogeneous rat populations as part of a large-scale selective breeding program for low (LRT) and high response to training (HRT). A: frequency distribution for the ΔDIST for 152 nonselected N/NIH rats after 8 wk treadmill training shown in ascending order. The brackets indicate the lowest and highest 10th percentile animals that were used as founders to start the LRT and HRT selected lines. Dotted line indicates the mean change in running capacity for the population. B: percentile rank score for the ΔDIST for 178 rats from generation 15 of selection arranged from lowest to highest. Light bars indicate LRT animals, and dark bars indicate HRT animals. Dotted lines indicate the mean change in running capacity for the LRT (light) and HRT (dark) selected lines. With equal training V̇o2 max measures pre and post show no significant changes in LRT group (C) but significant increases in HRT group (D). [A and B from Koch et al. (44) with permission from of American Physiological Society; C and D from Wisløff et al. (93) with permission from the American College of Cardiology.]
Fig. 3.
Fig. 3.
McArdle mouse phenotype. A: representative images of the gastrocnemius muscle indicate gross differences in glycogen. GP, glycogen phosphorylase activity staining; H&E, hematoxylin and eosin staining; wt, wild type. Arrows indicate glycogen accumulation in the homozygote (scale bar 200 μm, all images). B: glycogen phosphorylase activity is reduced with each copy of the p.R50X allele. C: treadmill performance is reduced in a similar dose-dependent manner with the p.R50X allele. [Figure adapted from Nogales-Gadea et al. 2012 (64) used with permission from Oxford University Press.]
Fig. 4.
Fig. 4.
Global frequencies of R577X ACTN3 alleles in native populations. Pie charts indicate the percentage of the ACTN3 577R (blue) and the null 577X (red) alleles in native populations from 16 different regions. Arrows depict human migration out of Africa ∼50 thousand years ago (KYA) [data from MacArthur et al. 2007 (52)].
Fig. 5.
Fig. 5.
A: the frequency of R577X ACTN3 genotypes (%RR, RX, and XX) differs in sprint populations (lower frequency of the XX genotype) compared with controls and endurance populations (higher frequency of the XX genotype in females) [data adapted from MacArthur et al. 2008 (51)]. B: WT and Actn3 knockout (KO) mice (pictured respectively) have been indispensable in modelling the human phenotype. Actn3 KO mice do not express α-actinin-3 on Western blot and have an upregulation of α-actinin-2 in skeletal muscle [MacArthur et al. 2008 (51)]. C: the highly conserved domain structures of α-actinin, with an in silico surface representation of the rod domain. The colors represent identical, conservative, and nonconservative residue substitutions when α-actinin-2 and -3 vertebrate sequences are aligned [figure from Lek et al. 2010 (46) used with permission from Elsevier]. D: in vitro and in vivo evidence demonstrates that the loss of α-actinin-3 alters calcineurin signaling, mitochondrial enzyme activity, and calcium handling (increased pump and release rates) to explain their improved fatigue resistance and also may result in enhanced heat production [figure from Head et al. 2015 (33)].

References

    1. Ahmetov II, Gavrilov DN, Astratenkova IV, Druzhevskaya AM, Malinin AV, Romanova EE, Rogozkin VA. The association of ACE, ACTN3 and PPARA gene variants with strength phenotypes in middle school-age children. J Physiol Sci 63: 79–85, 2013. - PMC - PubMed
    1. Akar FG, Aon MA, Tomaselli GF, O'Rourke B. The mitochondrial origin of postischemic arrhythmias. J Clin Invest 115: 3527–3535, 2005. - PMC - PubMed
    1. Alfred T, Ben-Shlomo Y, Cooper R, Hardy R, Cooper C, Deary IJ, Gunnell D, Harris SE, Kumari M, Martin RM, Moran CN, Pitsiladis YP, Ring SM, Sayer AA, Smith GD, Starr JM, Kuh D, Day IN. ACTN3 genotype, athletic status, and life course physical capability: meta-analysis of the published literature and findings from nine studies. Hum Mutat 32: 1008–1018, 2011. - PMC - PubMed
    1. Almasy L, Blangero J. Multipoint quantitative-trait linkage analysis in general pedigrees. Am J Hum Genet 62: 1198–1211, 1998. - PMC - PubMed
    1. Andersen ST, Duno M, Schwartz M, Vissing J. Do carriers of PYGM mutations have symptoms of McArdle disease? Neurology 67: 716–718, 2006. - PubMed

Publication types