. 2015 Oct 6;6(30):28588-606.
doi: 10.18632/oncotarget.5665.

CD8+ T cells undergo activation and programmed death-1 repression in the liver of aged Ae2a,b-/- mice favoring autoimmune cholangitis

Affiliations

CD8+ T cells undergo activation and programmed death-1 repression in the liver of aged Ae2a,b-/- mice favoring autoimmune cholangitis

Axel R Concepcion et al. Oncotarget. .

Abstract

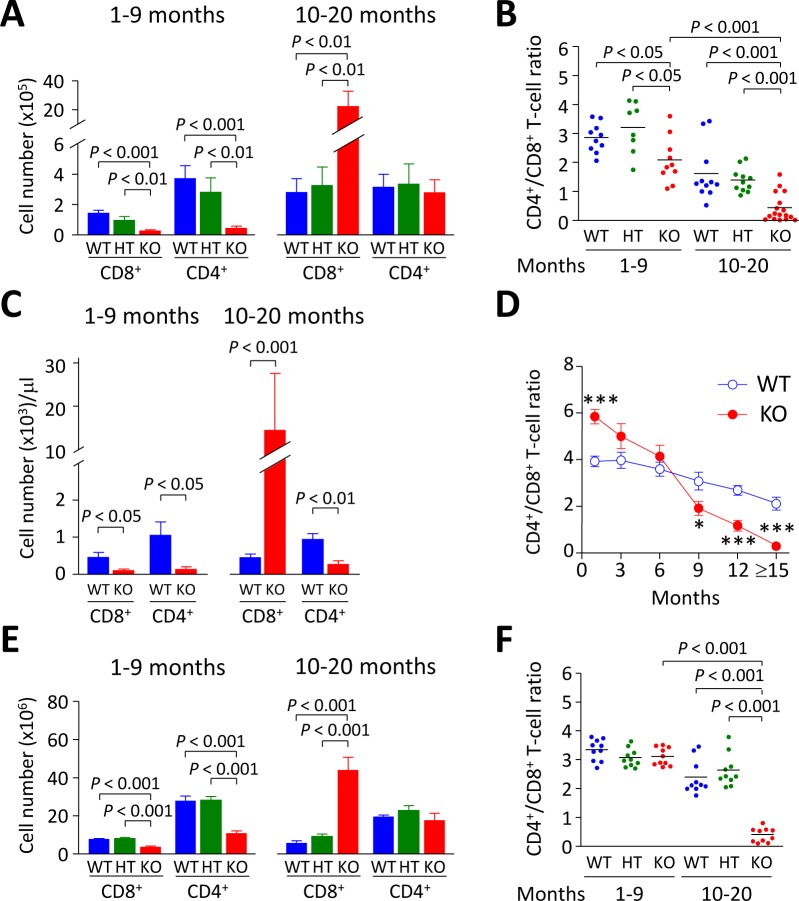
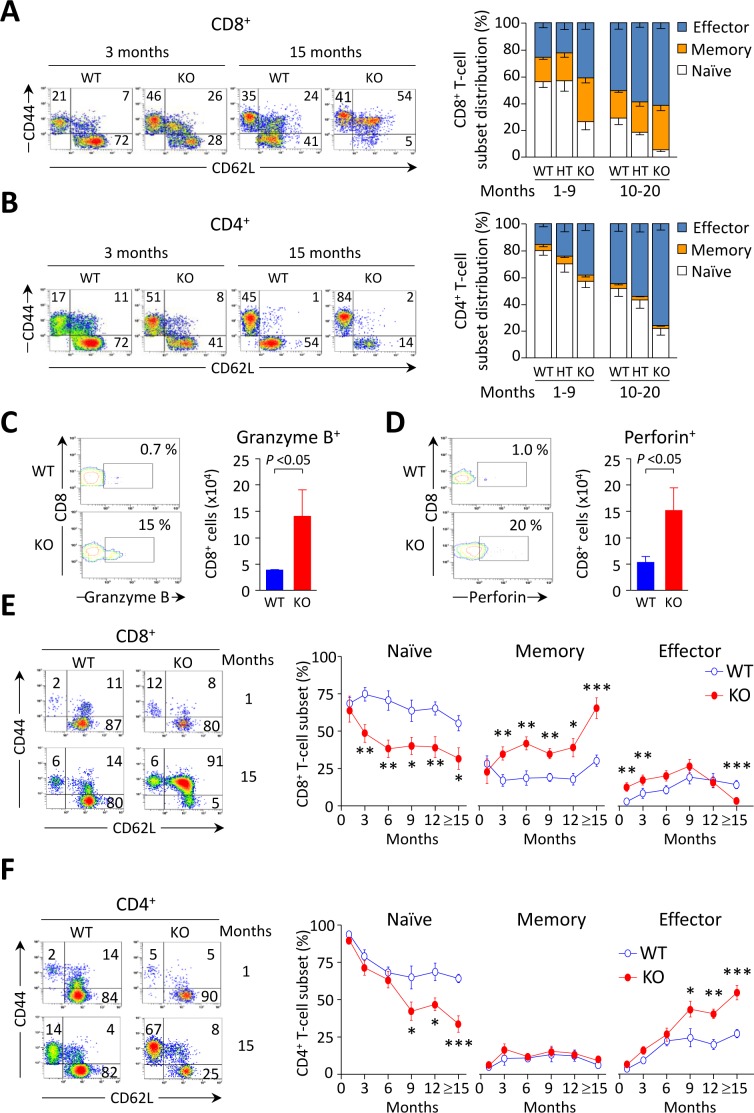
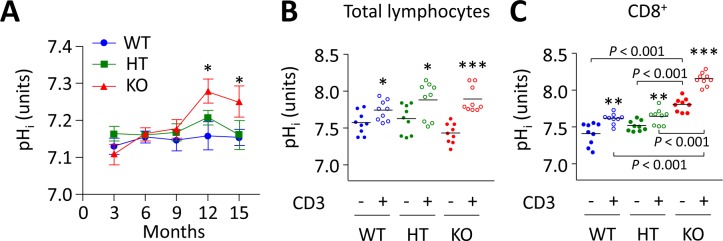
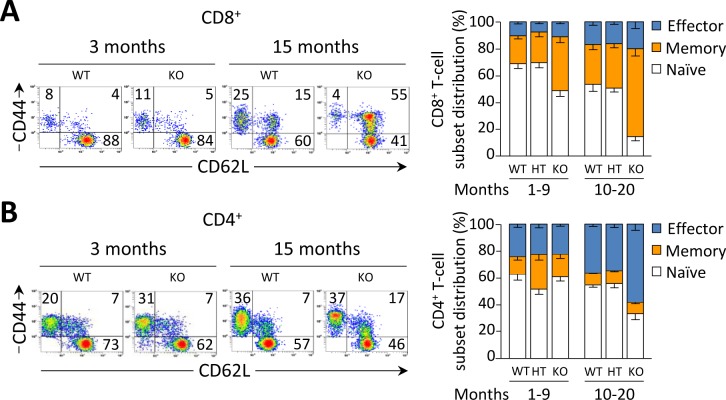
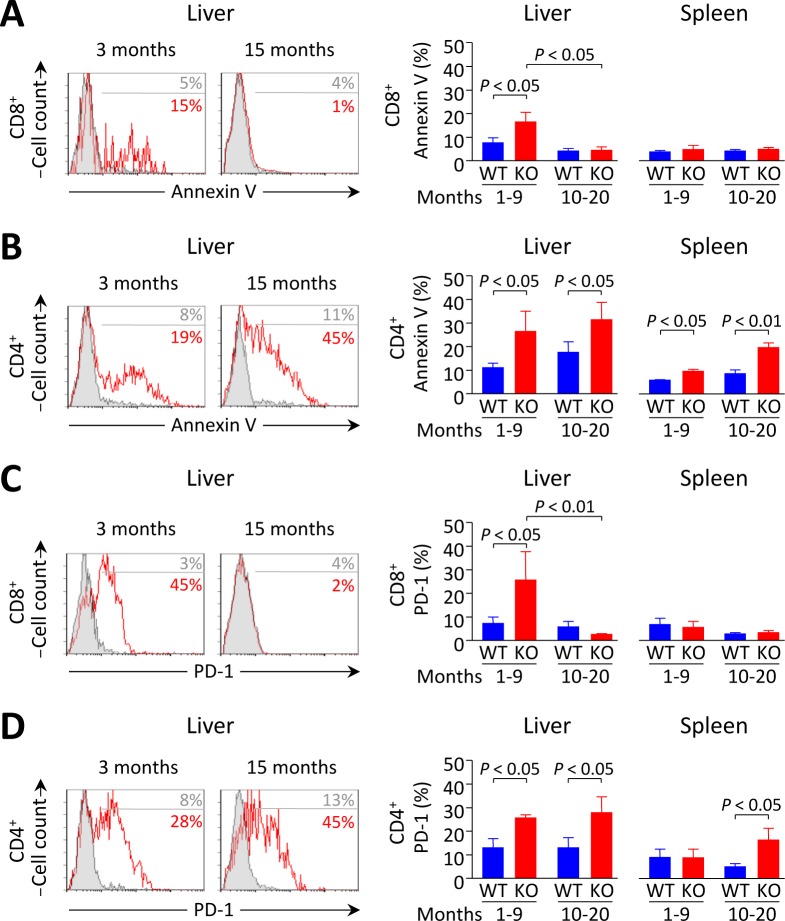
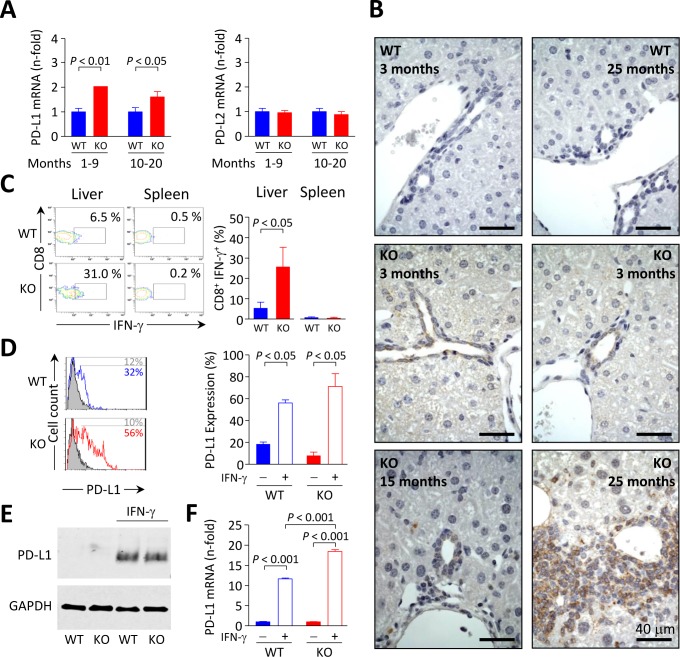
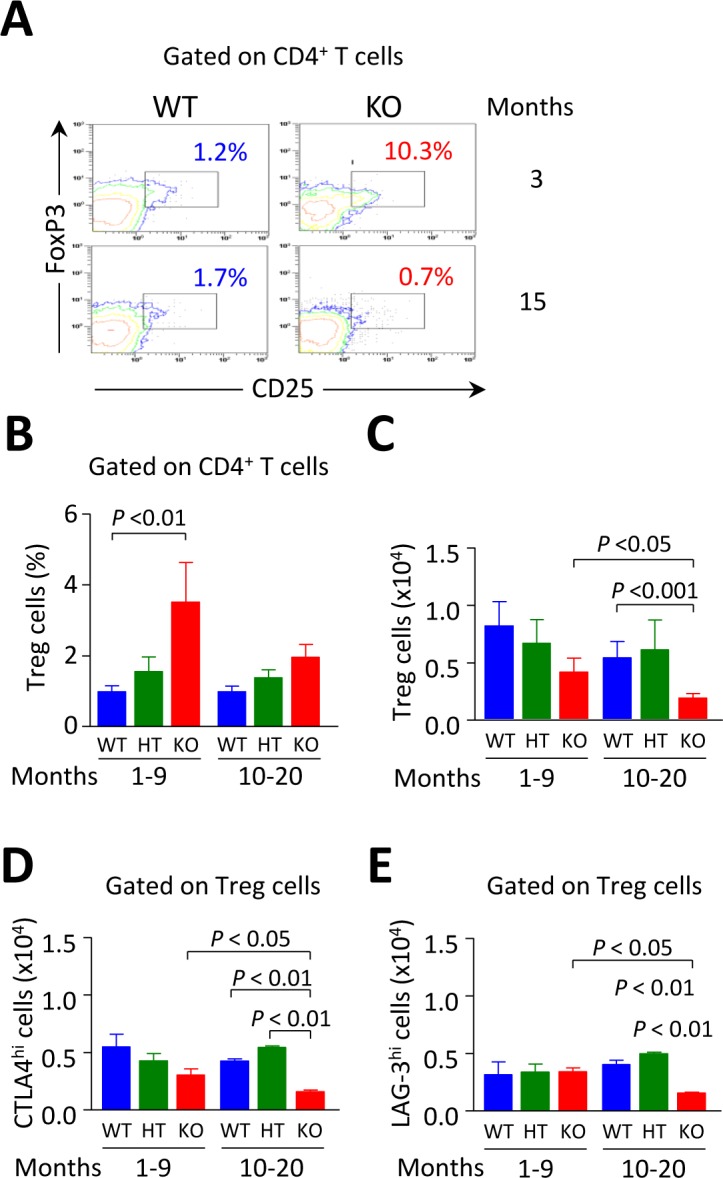
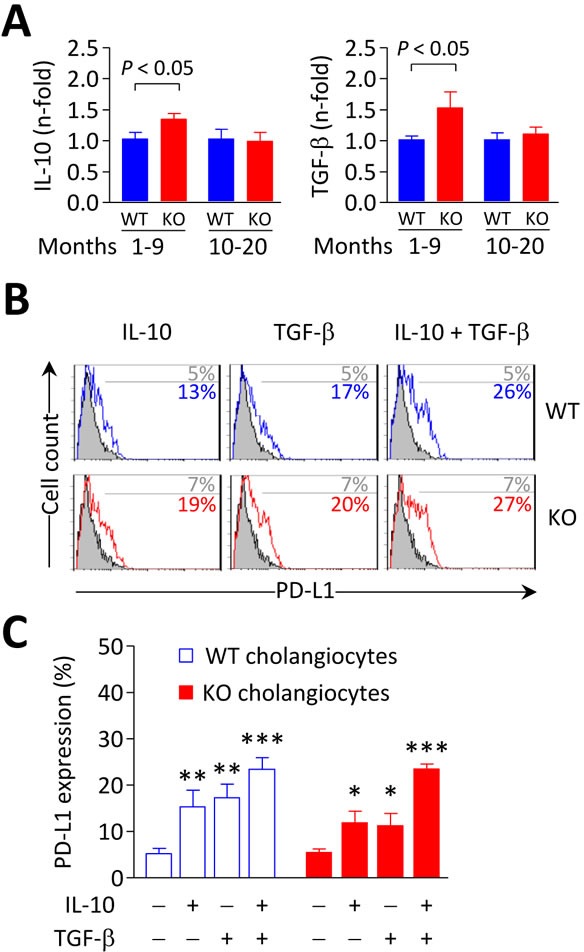
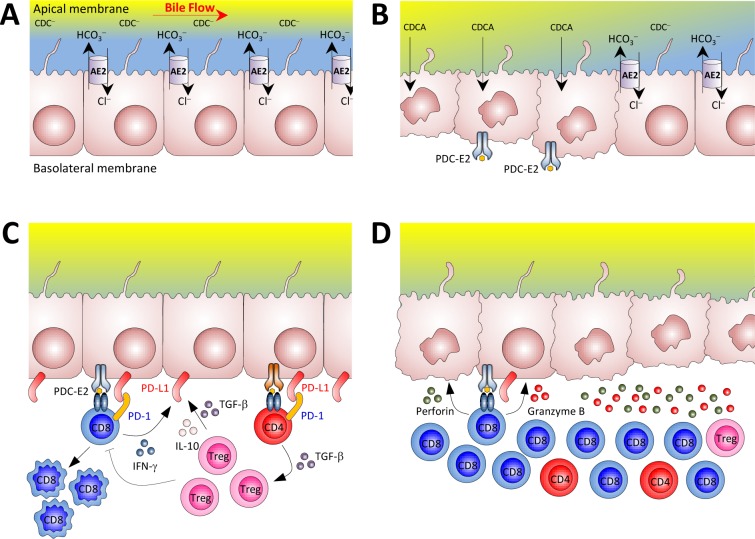
Primary biliary cirrhosis (PBC) is a chronic cholestatic disease of unknown etiopathogenesis showing progressive autoimmune-mediated cholangitis. In PBC patients, the liver and lymphocytes exhibit diminished expression of AE2/SLC4A2, a Cl-/HCO3- anion exchanger involved in biliary bicarbonate secretion and intracellular pH regulation. Decreased AE2 expression may be pathogenic as Ae2a,b(-/-) mice reproduce hepatobiliary and immunological features resembling PBC. To understand the role of AE2 deficiency for autoimmunity predisposition we focused on the phenotypic changes of T cells that occur over the life-span of Ae2a,b(-/-) mice. At early ages (1-9 months), knockout mice had reduced numbers of intrahepatic T cells, which exhibited increased activation, programmed-cell-death (PD)-1 expression, and apoptosis. Moreover, young knockouts had upregulated PD-1 ligand (PD-L1) on bile-duct cells, and administration of neutralizing anti-PD-L1 antibodies prevented their intrahepatic T-cell deletion. Older (≥ 10 months) knockouts, however, showed intrahepatic accumulation of cytotoxic CD8(+) T cells with downregulated PD-1 and diminished apoptosis. In-vitro DNA demethylation with 5-aza-2'-deoxycytidine partially reverted PD-1 downregulation of intrahepatic CD8(+) T cells from aged knockouts.

Conclusion: Early in life, AE2 deficiency results in intrahepatic T-cell activation and PD-1/PD-L1 mediated deletion. With aging, intrahepatic CD8+ T cells epigenetically suppress PD-1, and their consequential expansion and further activation favor autoimmune cholangitis.

Keywords: Immune response; Immunity; Immunology and Microbiology Section; Na+-independent Cl−/HCO3− anion exchanger AE2; age-related changes; intracellular pH homeostasis; mouse model of autoimmune cholangitis; self-tolerance breakdown.


Conflict of interest statement

CONFLICTS OF INTEREST

The authors have declared no financial conflict of interest.

Figures

Figure 1
Figure 1. CD8+ T cells accumulate steadily with aging in Ae2a,b−/− mice
A. Cell number of liver-infiltrating CD8+ and CD4+ T lymphocytes of young (1-9 month old) and aged (10-20 month old) WT, Ae2a,b+/− (HT), and Ae2a,b−/− (KO) mice. B. Intrahepatic CD4+/CD8+ T-cell ratio in mice as in (A). C. Number of CD8+ and CD4+ T cells in peripheral blood of both young and aged Ae2a,b−/− and WT mice. D. Follow-up of the CD4+/CD8+ T-cell ratio in blood of Ae2a,b−/− and WT mice at different ages. E. Number of CD8+ and CD4+ T cells and F. CD4+/CD8+ T-cell ratio in the spleen of mice as in A. Data are shown as mean ± SEM of n = 8 mice in A, 5 in C and 10 in E, per genotype and group. In B and F, dots indicate individual values and bars are mean values. *P < 0.05, and ***P < 0.001.
Figure 2
Figure 2. Flow cytometry analyses of thymocyte subsets in Ae2a,b−/− mice up to 10 months show no differences compared to littermate controls
A. Representative density plots showing the CD3 and CD3+ thymocyte subsets of WT, Ae2a,b+/− (HT), and Ae2a,b−/− (KO) mice. B. and C. Percentage of double-positive CD4+CD8+ and single positive CD4+ and CD8+ into CD3 (in B) and CD3+ populations (in C). Each dot represents the value for an individual mouse, and horizontal bars represent mean values.
Figure 3
Figure 3. CD8+ T cells are activated at early ages in the liver of Ae2a,b−/− mice
A. and B. Representative density plots (left) and distribution of T-cell subsets (right), i.e. naïve (CD44loCD62Lhi), memory (CD44hiCD62Lhi) and effector (CD44hiCD62Llo) T cells, illustrating the activation status of intrahepatic CD8+ (in A) and CD4+ (in B) T cells in young and old mice of the three genotypes. C. and D. Representative contour plot (left) and total number (right) of intrahepatic CD8+ T cells stained for intracellular granzyme B (in C) and perforin (in D) in aged mice. E. and F. Representative density plots of the activation status of CD8+ (in E) and CD4+ T cells (in F) in peripheral blood of WT and Ae2a,b−/− mice at the indicated ages (left), and follow-up of the respective subsets (right) in blood of WT and Ae2a,b−/− mice along the time. Results are shown as mean ± SEM of n = 7-9 mice per genotype and age (but n = 5 in C and D). *P < 0.05, **P < 0.01, and ***P < 0.001.
Figure 4
Figure 4. Intracellular alkalinization of PBLs in Ae2a,b−/− mice progresses over time and runs parallel with both expansion and activation of CD8+ T cells
A. Follow up of pHi in total lymphocytes isolated from peripheral blood of WT, HT, and Ae2a,b−/− mice at different ages. Results are shown as mean ± SEM of at least 10 mice per genotype and age. *P < 0.05 versus WT littermates. B. and C. pHi values of total lymphocytes (in B) and purified CD8+ T cells (in C) isolated from the spleen of young WT, HT, and Ae2a,b−/− mice and cultured in complete RPMI medium for 1 day in the presence or absence of anti-CD3 (1 μg/mL). Each dot represents the value for an individual mouse, and horizontal bars represent mean values. *P < 0.05, **P < 0.01, and ***P < 0.001 versus unstimulated conditions.
Figure 5
Figure 5. Activation status of T cells in the spleen of WT, HT, and Ae2a,b−/− mice analyzed by flow cytometry
A. and B. Representative density plots (left) and T-cell subset distributions (right), i.e. naïve (CD44loCD62Lhi), memory (CD44hiCD62Lhi) and effector (CD44hiCD62Llo) T cells, illustrating the activation status of CD8+ (in A) and CD4+ T splenocytes (in B) in both young and old mice. Data are shown as mean ± SEM of n = 8 mice per genotype and group.
Figure 6
Figure 6. Increased apoptosis and PD-1 expression in liver-infiltrating CD8+ T cells from Ae2a,b−/− mice recede with aging
A. and B. Apoptotic rate measured by annexin-V staining in CD8+ (in A) and CD4+ T cells (in B) in young and aged mice: representative flow-cytometry histograms (left) and percentages (right) of annexin-V+ intrahepatic T cells (and also intrasplenic T cells for the percentages). C. and D. Flow-cytometry analysis of PD-1 on CD8+ (in C) and CD4+ T cells (in D) in the same samples as in A and B, respectively. Results are shown as mean ± SEM of n = 4 young mice per genotype and n = 5 aged mice per genotype.
Figure 7
Figure 7. PD-L1 expression in mouse biliary epithelial cells is influenced by IFN-γ
A. Relative PD-L1 (left) and PD-L2 (right) mRNA levels measured by qPCR in liver samples from Ae2a,b−/− and WT mice. Results are shown as mean ± SEM of n = 5 mice per genotype and group. B. Immunohistochemical staining of PD-L1 on liver sections of Ae2a,b−/− and WT mice at the indicated ages. C. Representative contour plot (left) and percentages (right) of IFN-γ+ cells gated on intrahepatic and intrasplenic CD8+ T cells from young Ae2a,b−/− mice and WT littermates. Results are shown as mean ± SEM of n = 4 young mice per genotype. D. Representative flow-cytometry histograms (left) and percentages (right) of PD-L1 expression on isolated cholangiocytes from Ae2a,b−/− and WT mice cultured for 2 days with (open histograms) or without (full histograms) 100 ng/mL IFN-γ. E. Representative Western blot showing the expression of PD-L1 in cultured Ae2a,b−/− and WT mouse cholangiocytes treated as in D. F. Levels of PD-L1 mRNA (measured by qPCR, with GAPDH as the normalizing control) in cultured Ae2a,b−/− and WT mouse cholangiocytes treated as in D. Results are pooled from 4 independent experiments.
Figure 8
Figure 8. Breakdown of PD1/PD-L1 interaction contributes to accumulation of intrahepatic CD8+T cells in Ae2a,b−/− mice
A. and B. Cell number (in A) and PD-1 expression (in B) on liver-infiltrating CD8+ and CD4+ T lymphocytes from Ae2a,b−/− and WT mice intraperitoneally injected with anti-PD-L1 mAb (120 μg, five times every three days) and sacrificed at day 14. Isotype: rat IgG-isotype control. Data (in both A and B) are shown as mean ± SEM of n = 3 mice per genotype and group. C. Representative contour plots showing apoptotic rates (measured by annexin-V staining) of liver-infiltrating CD8+ (left) and CD4+ T cells (right). D. Representative contour plots (left) and percentages of PD-1 expression (right) on intrahepatic CD8+ and CD4+ T cells from aged Ae2a,b−/− mice upon stimulation with anti-CD3/CD28 Abs for three days in the presence or absence 1 μM 5-aza-2′-deoxycytidine. Data (mean ± SEM) are pooled from 2 independent experiments done in triplicates. *P < 0.05, and ***P < 0.001 versus unstimulated condition.
Figure 9
Figure 9. Intrahepatic Tregs are diminished in aged but not in young Ae2a,b−/− mice
A. Representative contour plots showing the percentage of CD25+FoxP3+ Tregs gated on liver-infiltrating CD4+ T cells from young and aged Ae2a,b−/− and WT mice. B. Percentages of CD4+CD25+ Tregs gated on liver-infiltrating CD4+ T cells from young and aged mice of the three genotypes. C. Total number of intrahepatic CD4+CD25+ Tregs in young and aged mice of the three genotypes. D. and E. Total number of CTLA-4hi (in D) and LAG-3hi cells (in E) gated on Tregs from perfused livers of the same mice as in B and C. Shown results: mean ± SEM of n = 5 for young WT and HT mice, and n = 3 for Ae2a,b−/− littermates, and n = 4 for aged WT and HT mice, and n = 6 for Ae2a,b−/− littermates.
Figure 10
Figure 10. IL-10 and TGF-β induce PD-L1 expression on biliary epithelial cells
A. IL-10 (left) and TGF-β (right) mRNA levels measured by qPCR in liver samples from Ae2a,b−/− and WT mice. Shown results: mean ± SEM of n = 5 mice per genotype and group. B. and C. Representative flow-cytometry histograms (in B) and percentages of PD-L1 expression on isolated cholangiocytes (in C) from Ae2a,b−/− and WT mice cultured for 2 days with 20 ng/mL IL-10 and/or 3 ng/mL TGF-β (open histograms) or with just vehicle (full histograms). Results are pooled from 4 independent experiments made by triplicates. *P < 0.05, **P < 0.01, and ***P < 0.001 versus basal values.
Figure 11
Figure 11. Potential mechanisms for the loss of tolerance against biliary epithelial cells in our mouse model of autoimmune cholangitis
A. Biliary epithelial cells use AE2 for biliary HCO3 secretion in order to develop a protective HCO3 umbrella [42]. Biliary HCO3 umbrella represents an alkaline environment around the luminal membrane of cholangiocytes, which prevents the protonation of hydrophobic bile salt monomers (e.g. chenodeoxycholic acid) -mainly conjugated with glycine in humans and with taurine in rodents- and renders them unable to permeate the cell membrane in an uncontrolled fashion, thus avoiding their toxic effects on cholangiocytes. B. In situations of AE2 deficiency (left side), apolar hydrophobic bile salts monomers may permeate the cell membrane of cholangiocytes and induce apoptosis. During the apoptosis process, the PDC-E2 epitope can remain intact because of the strong reduction capability of the cholangiocyte cytosol which limits adequate glutathionylation of the lipoyl moiety [43]. In a context of a “hyper-responsive” immune system, non-glutathionylated PDC-E2 peptides may promote the development of PDC-E2 specific AMA as a side-phenomenon of cholangiocyte injury. PDC-E2 epitope from the apoptotic cholangiocytes can then be recognized by circulating AMA and/or be presented by the innate immune system, further activating the adaptive immune response [44, 45]. C. Cholangiocytes can express different molecules linked to antigen presenting cell function [17, 46], and in PBC these cells are the direct target of the immune system. In our animal model of autoimmune cholangitis, T cells were found to be activated and deleted in the liver at early ages. Cytokines like IFN-γ, TGF-β, and IL-10 may upregulate PD-L1 expression on biliary epithelial cells which in the context of an adequate number of functional Treg cells can control self-reactive T cells. D. In the elderly, however, the reduced number of Tregs in the liver and PD-1 silencing in CD8+ T cells can make cholangiocytes more susceptible to immune attack by cytotoxic CD8+ T cells. Abbreviations: AE2, anion exchanger 2; CDC; polar chenodeoxycholate; CDCA, apolar chenodeoxycholic acid; PD-1, programmed death-1; PDC-E2, E2 component of the pyruvate dehydrogenase complex.

Similar articles

Cited by

References

    1. Hohenester S, Oude Elferink RPJ, Beuers U. Primary biliary cirrhosis. Semin Immunopathol. 2009;31:283–307. - PMC - PubMed
    1. Kaplan MM, Gershwin ME. Primary biliary cirrhosis. N Engl J Med. 2005;353:1261–1273. - PubMed
    1. Poupon R. Primary biliary cirrhosis: a 2010 update. J Hepatol. 2010;52:745–758. - PubMed
    1. Tsuda M, Ambrosini YM, Zhang W, Yang GX, Ando Y, Rong G, Tsuneyama K, Sumida K, Shimoda S, Bowlus CL, Leung PS, He XS, Coppel RL, et al. Fine phenotypic and functional characterization of effector cluster of differentiation 8 positive T cells in human patients with primary biliary cirrhosis. Hepatology. 2011;54:1293–1302. - PMC - PubMed
    1. He XS, Ansari AA, Ridgway WM, Coppel RL, Gershwin ME. New insights to the immunopathology and autoimmune responses in primary biliary cirrhosis. Cell Immunol. 2006;239:1–13. - PubMed

Publication types

MeSH terms