. 2015 Oct 6;112(40):12293-8.
doi: 10.1073/pnas.1509224112. Epub 2015 Sep 22.

Active mixing of complex fluids at the microscale

Affiliations

Active mixing of complex fluids at the microscale

Thomas J Ober et al. Proc Natl Acad Sci U S A. .

Abstract

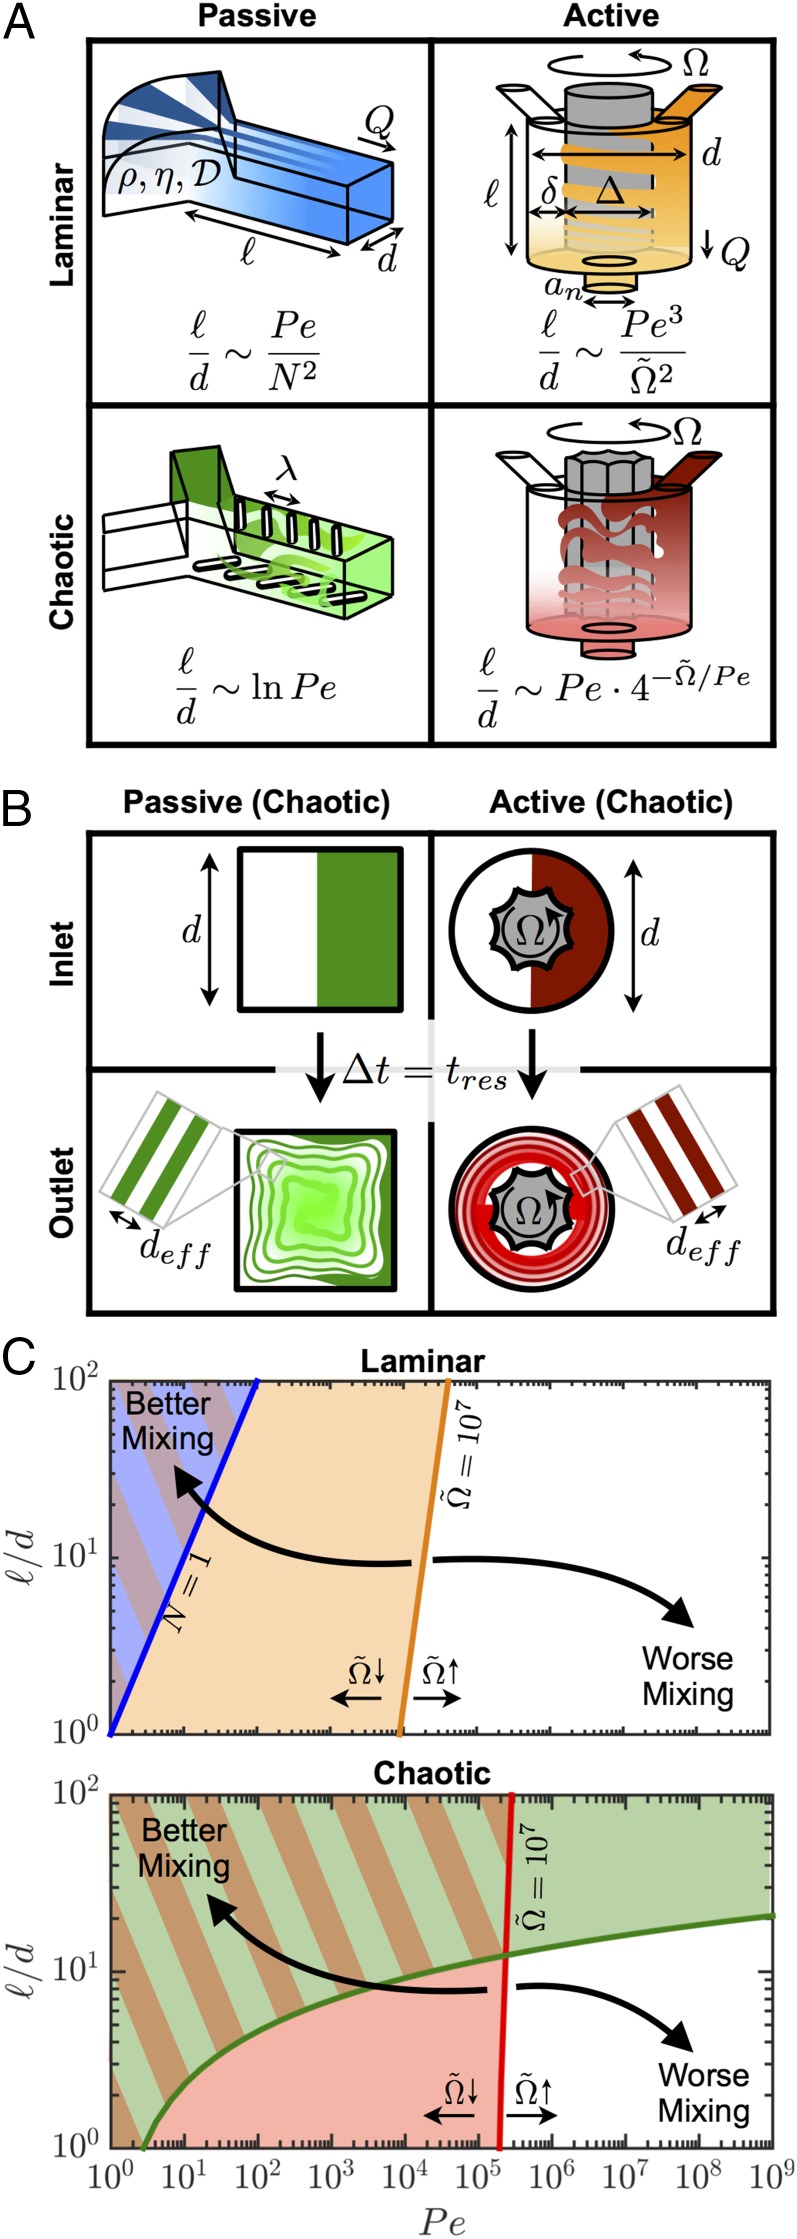
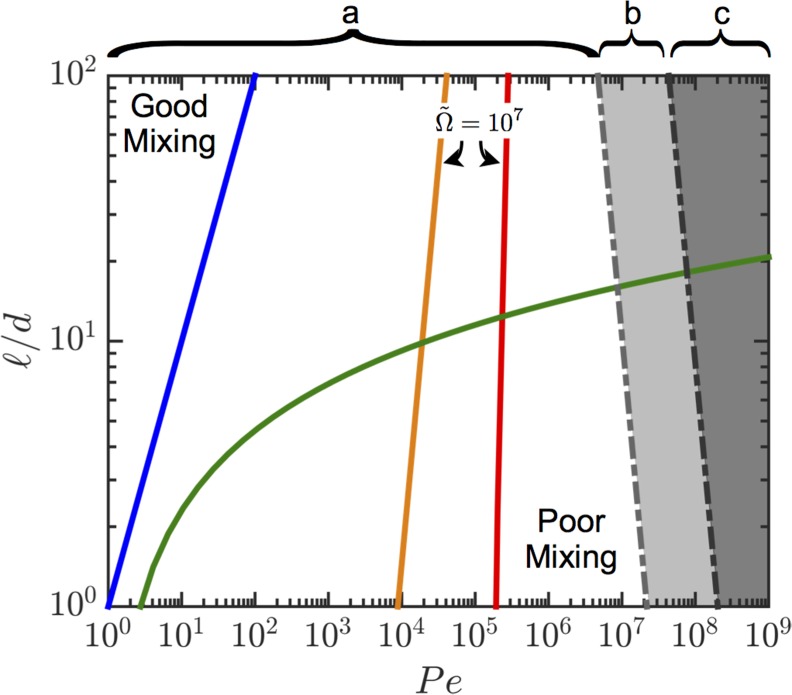
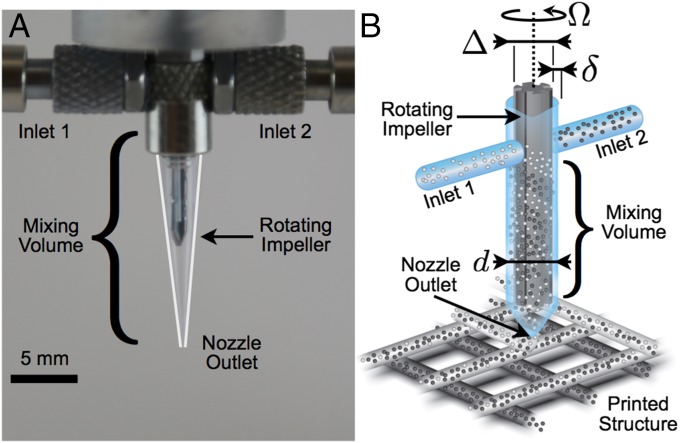
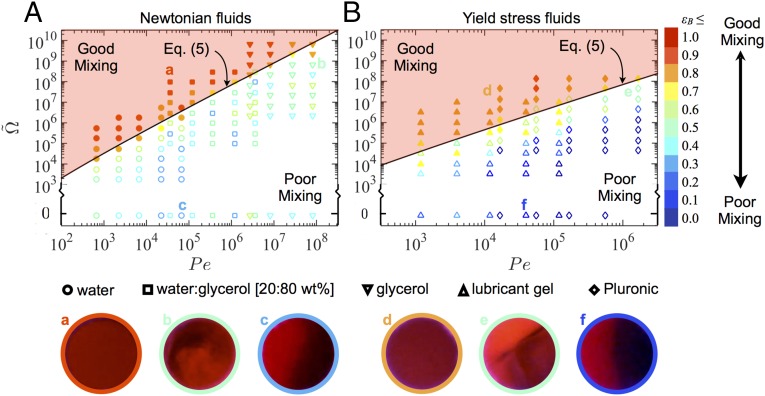
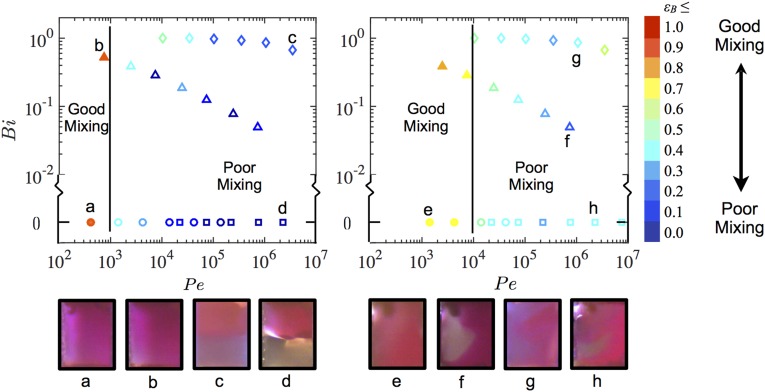
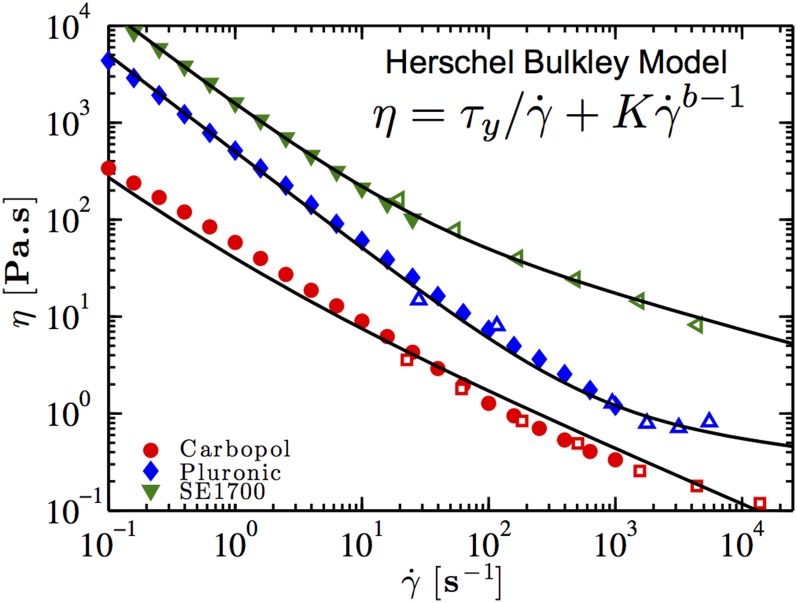
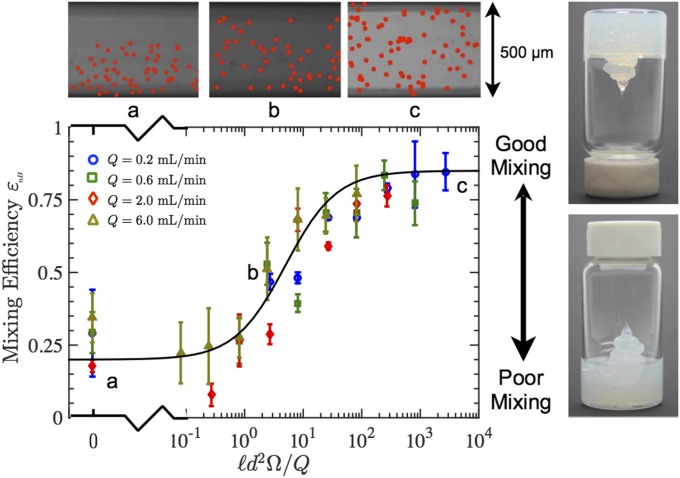
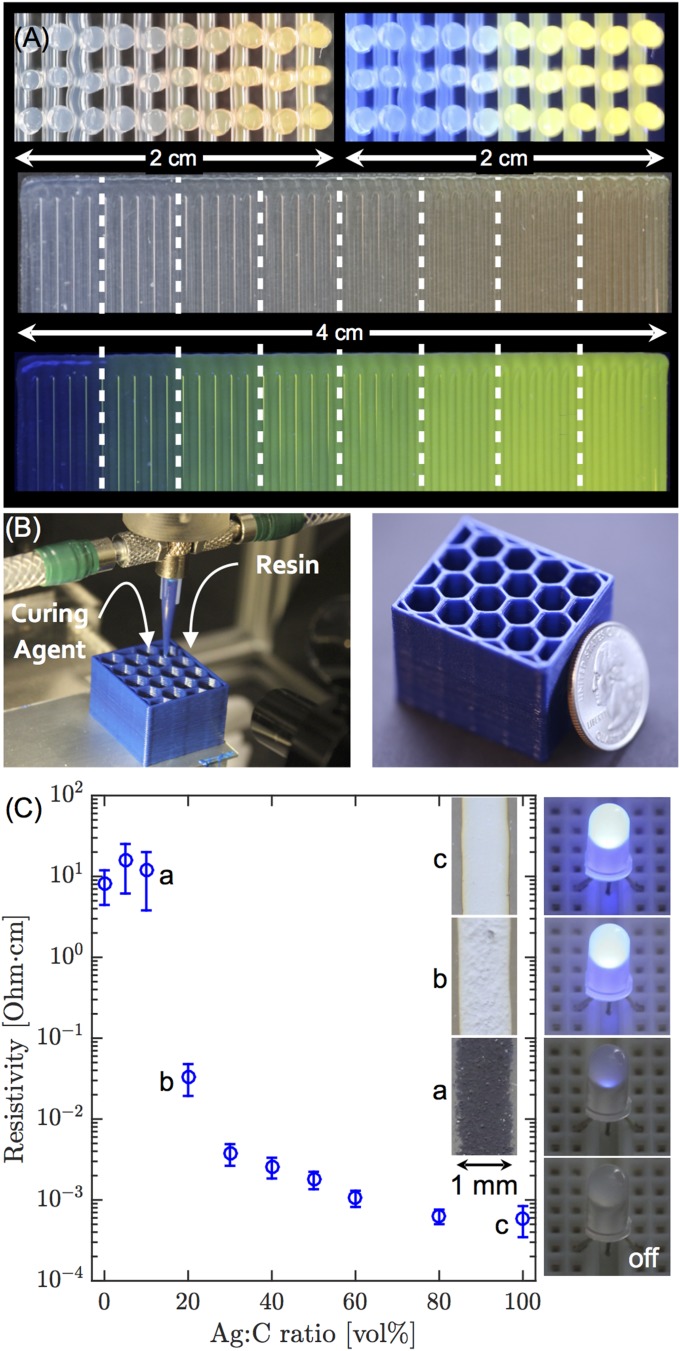
Mixing of complex fluids at low Reynolds number is fundamental for a broad range of applications, including materials assembly, microfluidics, and biomedical devices. Of these materials, yield stress fluids (and gels) pose the most significant challenges, especially when they must be mixed in low volumes over short timescales. New scaling relationships between mixer dimensions and operating conditions are derived and experimentally verified to create a framework for designing active microfluidic mixers that can efficiently homogenize a wide range of complex fluids. Active mixing printheads are then designed and implemented for multimaterial 3D printing of viscoelastic inks with programmable control of local composition.

Keywords: 3D printing; graded materials; microfluidic mixing; yield stress fluids.


Conflict of interest statement

The authors declare no conflict of interest.

Figures

Fig. 1.
Fig. 1.
(A) Schematic illustrations of the mixing nozzle designs for passive and active mixers using laminar and chaotic flow. (B) Interdigitation of the dyed and undyed mixing streams at the outlet of each mixer. (C) Operating map for mixing nozzles. The boundaries between regimes of good (shaded) and poor (unshaded) mixing are given by the curves whose color corresponds to the mixer type in A. The position of the boundary for the active mixer corresponds to Ω˜=107 and can be moved by changing impeller speed. The curves for the active mixer have been calculated with α=0.19.
Fig. S1.
Fig. S1.
Operating map for mixing nozzles accounting for the accessible range of flow rates for a given maximum pressure drop (based on properties for glycerol in Table S1 and assuming ΔPmax=105 Pa, set Q=1 mL/min and Δ/d=0.9). (A) Accessible regime, (B) accessible only for the passive mixers, (C) inaccessible regime. The boundaries between regimes of good and poor mixing are given by the dashed curves for the passive mixers and solid curves corresponding to constant dimensionless impeller speeds with the active mixer. The curves for the active mixer have been calculated with α=0.19 and β=0.0013.
Fig. 2.
Fig. 2.
(A) Optical image of the impeller-based active mixer. White lines have been added to accentuate the edges of the transparent nozzle tip. (B) Schematic illustration of the mixing nozzle in operation for 3D printing of two inks with particles of different color. Each fluid enters the mixing chamber of diameter d through a separate inlet and is homogenized in a narrow gap of width δ by an impeller of diameter Δ rotating at a constant rate Ω.
Fig. 3.
Fig. 3.
Active mixing of Brownian species in the microfluidic mixer. Plot of mixing efficiency εB in the Ω˜Pe phase space for (A) Newtonian liquids and (B) yield stress fluids as determined from the red channel intensity of images of the nozzle cross-sections. The solid black curves follow the relation Ω˜=Pe(lnPeln(α/d))/α, which separates the regions of good and poor mixing indicated by solid and hollow symbols respectively, corresponding to images in which a sharp interface between dyed and undyed streams could be visually observed. Representative images of the nozzle cross-section (400-µm diameter) are shown below each plot with bright and dark regions indicating dyed and undyed streams: A, a, water:glycerol [20:80 wt %]; A, b, glycerol; A, c, water; B, d and f, lubricant gel; B, e, Pluronic.
Fig. S2.
Fig. S2.
Mixing in the passive mixer. Plot of mixing efficiency εB in the BiPe phase space for the (A) SWPMs and (B) GWPMs as determined from the color saturation images of the nozzle cross-sections for water (circle), water:glycerol [20:80 wt %] (square), lubricant gel (upright triangle), and Pluronic (diamond). Solid and hollow symbols indicate regimes of good and poor mixing, respectively, corresponding to images in which a sharp interface between dyed and undyed streams could be visually observed. Representative grayscale images of the color saturation are shown below each plot with bright and dark regions indicating dyed and undyed streams. The color of the border indicates the test fluid: (A, a and e, water; A, b and f, lubricant gel; B, c and g, Pluronic; B, d and h, water:glycerol [20:80 wt %].
Fig. S3.
Fig. S3.
Rheological flow curves of the three non-Newtonian ink formulations used in calibration tests in this work at 22 °C. Data taken with the rotational rheometer (filled symbols) and the capillary rheometer (hollow symbols) are shown. The black solid lines are the respective fits of the HB model given by the fitting parameters listed in Table S1.
Fig. 4.
Fig. 4.
Semilog plot of mixing efficiency εnB of large filler particles in a polydimethylsiloxane ink as a function of mixing ratio d2Ω/Q for four different flow rates. The solid black curve is added only to guide the eye. Three example particle distributions in the printed filament corresponding to different mixing ratios are shown. The red dots have been added to indicate the position of each tracer particle in the filament. The failure of εnB to attain precisely its expected asymptotic values of zero (perfectly unmixed) and one (perfectly mixed) at, respectively, low and high dimensionless rotation speeds may arise from the low particle density in the filament, which may prevent statistical convergence. The yield stress behavior of this ink is clearly illustrated by its shape retention when inverted in a vial.
Fig. 5.
Fig. 5.
(A, Top) Images of the cross-section of a 3D rectangular lattice structure of SE 1700 showing continuous change in fluorescent pigment concentration under bright light (Left) and UV radiation (Right). (A, Bottom) Images of a 2D carpet structure showing a discretely varying fluorescent gradient at eight different mixing ratios under bright light (Top) and UV radiation (Bottom). Dashed white lines have been added to mark the regions of different mixing ratios. (B) Three-dimensional printing of a two-part epoxy honeycomb structure. A coin is shown to indicate scale. (C) Plot of resistivity of colloidal nanoparticle silver and carbon inks at varying volume ratios mixed in the active mixer. (Inset) Images showing the illumination intensity of a blue LED connected in series to selected ink traces with a constant applied voltage (2.55 V). Sections of the corresponding traces are shown at the side of each LED.
Fig. S4.
Fig. S4.
Evolution of the storage G' and loss G'' moduli with time after mixing at 22 °C, as measured using a 25-mm plate–plate geometry on an AR2000ex (TA Instruments) at frequency ω=10 rad/s and strain amplitude γ0=0.2%. The measured pot-life of the epoxy is 45 min, which is the point at which the loss modulus is double its initial value as indicated by the arrow.
Fig. S5.
Fig. S5.
Measurements of the diffusion coefficient of the IFWB-C7 dye (rhodamine-WT, Risk Reactor) at 23 °C. (A) Top view of the capillary with the injected dyed and undyed streams. (B) Spatiotemporal plot of experimentally measured dye concentration [g/L] in water (viscosity μ=0.001 Pa·s). (C) Evolution of the concentration at x=180 µm (red) and x=180 µm (blue). The black curves are the fit of C(x,t) from Eq. 9 with x=±180 µm, w=900 µm, C0=0.13 g/L, and D=500 µm2/s. The Stokes–Einstein equation is used to estimate the molecular diameter of the tracer dye a=kBT/3πμD=0.87 nm.
Fig. S6.
Fig. S6.
Optical images of the mixers. (A) The passive mixer consists of a Y-type junction and a long duct of hydraulic diameter d=500 µm and length =15 mm. The channel surfaces of the passive mixers are shown in the magnified image. (B) The active mixer consists of two inlet channels connecting to the central mixing volume of length =30 mm, diameter d=3 mm, and outlet diameter an=500 µm with the impeller of diameter Δ=2.7 mm. The two types of impellers are shown in the magnified image. An alternative design with metal fixtures is implemented for mixing with highly viscous epoxy systems.

References

    1. Nguyen N-T, Wu Z. Micromixers—a review. J Micromech Microeng. 2005;15(2):R1–R16.
    1. Hessel V, Löwe H, Schönfeld F. Micromixers—a review on passive and active mixing principles. Chem Eng Sci. 2005;60(8):2479–2501.
    1. El-Ali J, Sorger PK, Jensen KF. Cells on chips. Nature. 2006;442(7101):403–411. - PubMed
    1. Stott SL, et al. Isolation of circulating tumor cells using a microvortex-generating herringbone-chip. Proc Natl Acad Sci USA. 2010;107(43):18392–18397. - PMC - PubMed
    1. Haswell SJ, Watts P. Green chemistry: Synthesis in micro reactors. Green Chem. 2003;5:240–249. - PubMed

Publication types