. 2015 Sep 22;8(395):ra95.
doi: 10.1126/scisignal.aaa6179.

Dichotomous roles for externalized cardiolipin in extracellular signaling: Promotion of phagocytosis and attenuation of innate immunity

Affiliations

Dichotomous roles for externalized cardiolipin in extracellular signaling: Promotion of phagocytosis and attenuation of innate immunity

Krishnakumar Balasubramanian et al. Sci Signal. .

Abstract

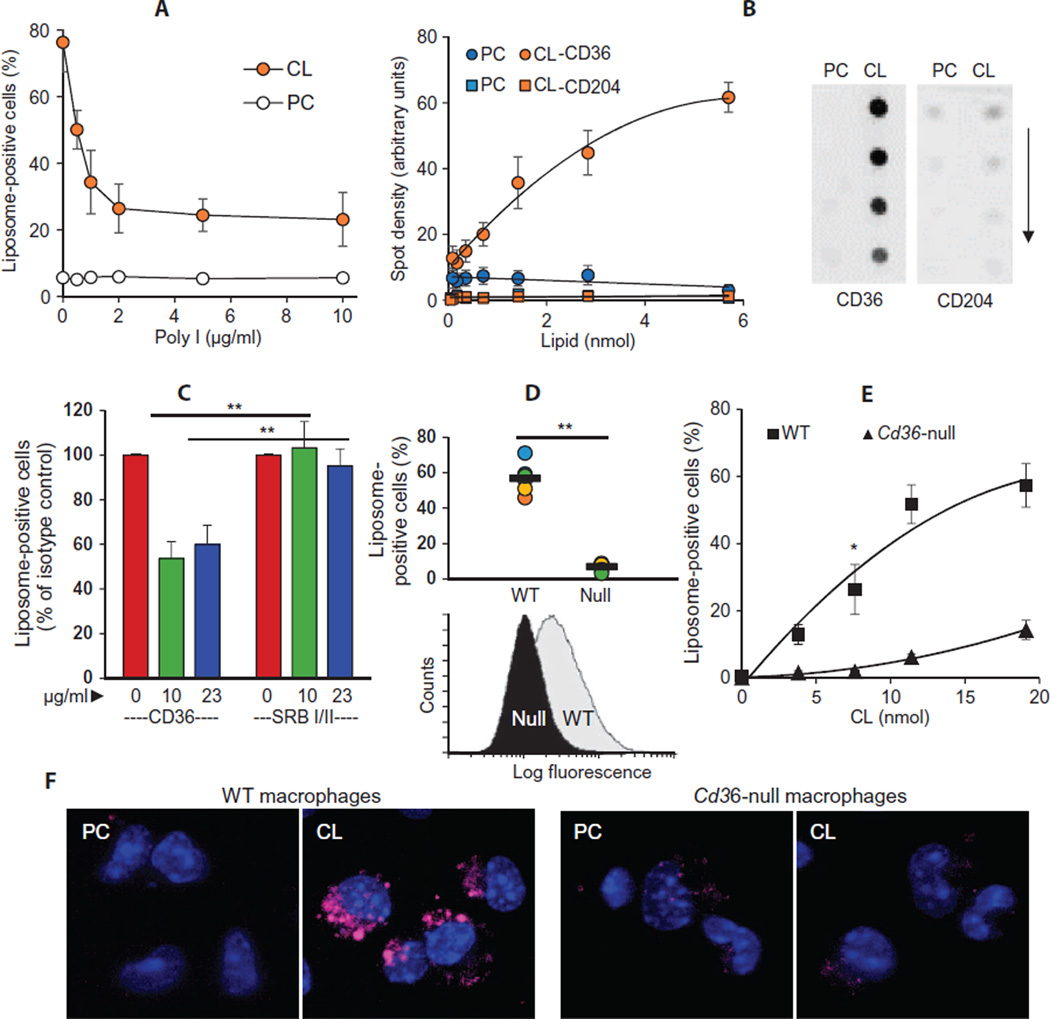
Among the distinct molecular signatures present in the mitochondrion is the tetra-acylated anionic phospholipid cardiolipin, a lipid also present in primordial, single-cell bacterial ancestors of mitochondria and multiple bacterial species today. Cardiolipin is normally localized to the inner mitochondrial membrane; however, when cardiolipin becomes externalized to the surface of dysregulated mitochondria, it promotes inflammasome activation and stimulates the elimination of damaged or nonfunctional mitochondria by mitophagy. Given the immunogenicity of mitochondrial and bacterial membranes that are released during sterile and pathogen-induced trauma, we hypothesized that cardiolipins might function as "eat me" signals for professional phagocytes. In experiments with macrophage cell lines and primary macrophages, we found that membranes with mitochondrial or bacterial cardiolipins on their surface were engulfed through phagocytosis, which depended on the scavenger receptor CD36. Distinct from this process, the copresentation of cardiolipin with the Toll-like receptor 4 (TLR4) agonist lipopolysaccharide dampened TLR4-stimulated production of cytokines. These data suggest that externalized, extracellular cardiolipins play a dual role in host-host and host-pathogen interactions by promoting phagocytosis and attenuating inflammatory immune responses.


Figures

Fig. 1
Fig. 1. Macrophages phagocytose CL-containing liposomes
(A to D) The indicated macrophages and macrophage-like cell lines were incubated for 60 min with fluorescent liposomes composed of increasing amounts of TLCL in PC. The cells were then washed, trypsinized, and assessed for their phagocytosis of the liposomes by flow cytometry. Data are means ± SD of three to five experiments and are expressed as the percentage of macrophages that phagocytosed the liposomes. Insets: The indicated cells were incubated for 60 min with liposomes (5 nmol of TLCL) in the absence or presence of 20 µM CytD before being assessed for phagocytosis. Data are means ± SD of three to five experiments. *P < 0.05 by t test. (E and F) RAW 264.7 cells incubated for 20 min with fluorescent liposomes composed of NBD (7-nitro-2-1,3-benzoxadiazol-4-yl)–CL (green) (E) or NBD-PC (green) (F) were loaded with LysoTracker Deep Red (red) and ER-Tracker Blue-White (blue). Images were captured and analyzed as described in Materials and Methods. The lysosomal and NBD signals were segmented, and the degree of colocalization was calculated. Top left: Maximal intensity projection of the cells after incubation with NBD-CL (E) or NBD-PC (F). Top right: The segmented NBD signals are shown as bright green spots. Bottom left: The segmented lysosomes are shown as bright red spots. Bottom right: Colocalized lysosomes and NBD signals appear as yellow spots. The degree of colocalization in (E) was 85%, whereas there was no statistically significant degree of colocalization in (F). Images in (E) and (F) are representative of three experiments.
Fig. 2
Fig. 2. Mitochondria that present CL on their surface are engulfed by macrophages
(A) Semiquantitative analysis of the amounts of externalized TLCL on the surface of mitochondria (MITO) after incubation with the indicated concentrations of TLCL was performed by flow cytometric analysis with FITC-conjugated an-nexin V in the presence of 200 µM Ca2+. Data are presented as the percentages of mitochondria that were annexin V–positive and are means ± SD of three experiments. *P < 0.05 by t test. (B) Quantification of the amount of TLCL presented on the mitochondrial surface was performed by incubating mitochondria with PLA2 under nonpermeable conditions and then subjecting the extracted lipids to LC-MS analysis to detect mono-lyso-CL. Numbers on the x axis represent the amount of TLCL integrated into the mitochondria (as determined by LC-MS analysis; fig. S3, A to C). Data are means ± SD of the amounts of TLCL on the mito-chondrial surface from three experiments. (C) RAW 264.7 cells were left untreated or were pretreated with 20 µM CytD before being incubated with MitoTracker Red–labeled, TLCL-presenting mitochondria. The cells were washed and trypsinized, and the extent of their phagocytosis of the mitochondria was assessed by flow cytometric analysis. Data are means ± SD of three to five experiments. *P < 0.05 by t test. (D to F) MitoTracker Red–labeled mitochondria (P2 fraction) isolated from control and ActD-treated (Damaged) MEFs were assessed for CL externalization by flow cytometric analysis with annexin V–FITC (D) and PLA2 treatment (E). (F) RAW 264.7 cells were incubated with the mitochondria described in (D), and the extent to which they phagocytosed the mitochondria was determined as described for (C). Data in (D) to (F) are means ± SD of three experiments. *P < 0.05 by t test.
Fig. 3
Fig. 3. Acyl chain composition does not affect the phagocytosis of CL-containing liposomes
(A to D) RAW 264.7 cells were incubated for 60 min with liposomes composed of 0 to 12 nmol of TLCL, peroxidized TLCL (TLCLox), or TOCL (A and B) or 0 to 16 nmol of E. coli CL (C and D) as shown by the trace line. The cells were then washed, trypsinized, and analyzed by flow cytometry to assess their ability to phagocytose the liposomes. Data are presented as the percentage of liposome-positive cells (A and C) and the relative mean fluorescence intensity (MFI) of FITC (B and D). Data are means ± SD of three to five experiments.
Fig. 4
Fig. 4. CL-dependent phagocytosis requires the SR CD36
(A) RAW 264.7 cells were incubated with TLCL-liposomes (12 nmol, CL) in the absence or presence of Poly I. The macrophages were then washed, trypsinized, and assessed for phagocytosis by flow cytometry. PC-liposomes were used as a control. Data are means ± SD of four experiments. (B) Left: Serial dilutions of PC or TLCL (CL) immobilized on polyvinylidene difluoride (PVDF) membranes were incubated with His-tagged recombinant proteins corresponding to the extracellular domains of CD36 (circles) or CD204 (squares). Binding was visualized with horseradish peroxidase (HRP)–conjugated anti-His tag antibodies. Data are means ± SD of three experiments. Right: Representative lipid blots incubated with the recombinant CD36 or CD204 proteins. The direction of the serial dilutions of phospholipid is denoted by the arrow. Blots are representative of three experiments. (C) RAW 264.7 cells were incubated with TLCL-liposomes (12 nmol, CL) in the absence or presence of the indicated concentrations of anti-CD36 or anti–SRB I/II blocking antibodies or their respective isotype controls. The cells were then analyzed by flow cytometry to assess phagocytosis. Data are presented as the percentage of antibody-treated cells that were positive for liposomes relative to the percentage of isotype control–treated cells that were positive for liposomes. Data are means ± SD of three experiments. **P< 0.01 by ttest. (D to F) MPMs isolated from thioglycollate-treated wild-type (WT) mice and Cd36−/− (Null) mice were assessed for their ability to phagocytose fluorescent N-NBD-phosphatidylethanolamine (N-NBD-PE)–labeled liposomes (38 nmol of total lipid) composed of PC alone or TLCL (11.4 nmol, CL) in PC. (D) Top: Each circle represents data from MPMs isolated from a single mouse. The black horizontal bars show the mean values. Data are means ± SD of six experiments. **P< 0.01 by t test. Bottom: Representative flow cytometry histogram. (E) Flow cytometric analysis of the phagocytosis of liposomes containing the indicated amounts of TLCL (CL) by WT and Cd36−/− MPMs. Data are means ± SD of three experiments. *P < 0.05 by t test. (F) RAW 264.7 cells were incubated for 20 min with fluorescent 1,1′-dioctadecyl-3,3,3′,3′-tetramethylindocarbocyanine per-chlorate (DiI)–labeled liposomes (red, 38 nmol of total lipid) composed of PC alone or TLCL (11.4 nmol, CL) in PC. The cells were then washed, fixed, stained with 4′,6-diamidino-2-phenylindole (DAPI) (blue), and imaged. Data are representative confocal projection snapshots from three experiments.
Fig. 5
Fig. 5. CL inhibits the LPS-dependent production of inflammatory cytokines
(A to C) RAW 264.7 cells were incubated for 16 hours with LPS alone, with LPS in the presence of liposomes (38 nmol of total lipid) composed of the indicated amounts of TLCL (A), or with LPS in the presence of liposomes (38 nmol of total lipid) composed of PC alone, TLCL, or E. coli CL or PS (11.4 nmol of lipid) in PC (B and C). Culture media or cell lysates (for pro–IL-1α and pro–IL-1β) were analyzed for the indicated cytokines by Luminex assay. Data are means ± SD of three experiments. *P < 0.05 by t test. (D) MPMs were incubated with LPS alone or in the presence of liposomes (38 nmol of total lipid) containing the indicated amounts of TLCL in PC. The amounts of the indicated cytokines secreted in the cell culture medium were determined by Luminex assay. Each circle represents data from MPMs isolated from a single mouse. The black horizontal bars denote means. Data are means ± SD of four experiments. *P < 0.05, **P < 0.01 by t test. (E) HMDMs from healthy donors were incubated for 16 hours with LPS alone or with LPS in the presence of PC-liposomes or TLCL-liposomes (11.4 nmol of CL). Cell culture media were then analyzed by Luminex assay to determine the amounts of the indicated cytokines. Data are presented as a percentage of the amount of the indicated cytokines secreted by cells treated with LPS alone. Data are means ± SD of three experiments. *P < 0.05 by t test. MIP-1α, macrophage inflammatory protein-1α (also known as CCL3); TNF-α, tumor necrosis factor–α.
Fig. 6
Fig. 6. CL inhibits the expression of genes encoding inflammatory and anti-inflammatory factors and block LPS signaling through a CD36-independent mechanism
(A) MPMs from C57BL/6J mice (eight mice) were plated in six-well plates and were left untreated or were incubated for 16 hours with LPS alone or with LPS in the presence of PC-liposomes or TLCL-liposomes (11.4 nmol of TLCL). Cell culture media were analyzed by ELISA to determine the amounts of TGF-β secreted by the cells. Each circle represents data from MPMs isolated from a single mouse. Black horizontal bars denote median values. Data were analyzed with a nonparametric Friedman’s test, which indicated that LPS and both liposome treatments had differential effects [χ2(3,n=8) = 13.4, P < 0.01] on TGF-β secretion. Follow-up pairwise comparisons with Bonferonni corrected level of observed significance showed that TLCL-liposomes significantly inhibited the LPS-dependent production of TGF-β (median, 683.3 versus 7893.3; P < 0.01). Although a difference in the median TGF-β production was also observed between cells treated with LPS alone and those co-incubated with LPS and PC-liposomes (median, 1886.9), it did not reach the same level of statistical significance (P = 0.072). (B and C) MPMs were incubated as described for (A), after which their RNA was extracted as described in Materials and Methods. The RNA samples were analyzed by qPCR to determine the relative abundances of NOS2 mRNA (B) and ARG1 mRNA (C) normalized to that of 18S rRNA. Data were analyzed with a nonparametric Friedman’s test. Black horizontal bars denote medians. **P < 0.001 based on a nonparametric Friedman’s test with Bonferroni correction. Each circle represents data from MPMs isolated from a single mouse. (D and E) MPMs from Cd36−/− mice (D and E) and WT mice (E) were incubated for 16 hours with LPS alone or in the presence of liposomes composed of the indicated amounts of TLCL (D) or in the presence of PC-liposomes, TLCL-liposomes (11.4 nmol), or PS-liposomes (11.4 nmol) (E). Cell culture media were then analyzed by Luminex assay to determine the concentrations of the indicated cytokines. Each circle in (D) represents data from MPMs isolated from a single mouse. Black horizontal bars denote means. Data are means ± SD of four experiments. Data in (E) are means ± SD of four mice. *P < 0.05 by t test. (F) RAW 264.7 cells were treated for 8 hours with LPS alone, for 8 hours with LPS together with the indicated liposomes, or for 4 hours with LPS followed by 4 hours of incubation with CL-liposomes. Cell culture media or lysates (for pro–IL-1 measurement) were then analyzed by Luminex assay to determine the concentrations of the indicated cytokines. Data are means ± SD of three experiments. *P < 0.05 by t test.
Fig. 7
Fig. 7. CL competes with LPS for binding to the TLR4 co-receptor MD2
(A) Structures of lipid A and TLCL were generated by Avogadro software with structural data obtained from the LIPID MAPS Lipidomics Gateway. (B) ELISA plates containing immobilized recombinant MD2 protein (50 ng) were blocked with ovalbumin and then incubated for 90 min with biotinylated LPS (50 ng) in the absence or presence of PC-liposomes, TLCL-liposomes, or PS-liposomes. The plates were washed and then incubated for 60 min with HRP-conjugated streptavidin to visualize bound biotinylated LPS by TMB (3,3′,5,5′-tetramethylbenzidine)–ELISA. Numbers on the x axis refer to the total amounts of phospholipids, whereas the numbers in parentheses refer specifically to the amounts of TLCL or PS. Data are means ± SD of three experiments. *P < 0.05 by t test. (C) Lipid A, TLCL, and E. coli CL (17:1/15:0/16:0/18:1-CL is shown) were docked to the crystal structure of MD2 with AutoDock Vina software (http://vina.scripps.edu). The binding poses of the top-ranked models are shown. MD2, cartoon representation with spectral colors. Blue represents the N terminus, and red represents the C terminus. For lipids: cyan, acyl chains; blue, nitrogen; red, oxygen; orange, phosphorus. (D) The amino acid residues of MD2 that were identified to interact with lipid A, TLCL, and E. coli CL from the molecular docking models presented in (C) are shown in red. Gray boxes denote those interacting amino acid residues that are common to lipid A and the CLs.

References

    1. Diekmann Y, Pereira-Leal JB. Evolution of intracellular compartmentalization. Biochem. J. 2013;449:319–331. - PubMed
    1. Brestoff JR, Artis D. Commensal bacteria at the interface of host metabolism and the immune system. Nat. Immunol. 2013;14:676–684. - PMC - PubMed
    1. Senovilla L, Galluzzi L, Zitvogel L, Kroemer G. Immunosurveillance as a regulator of tissue homeostasis. Trends Immunol. 2013;34:471–481. - PubMed
    1. Thaiss CA, Levy M, Suez J, Elinav E. The interplay between the innate immune system and the microbiota. Curr. Opin. Immunol. 2014;26:41–48. - PubMed
    1. Michlewska S, McColl A, Rossi AG, Megson IL, Dransfield I. Clearance of dying cells and autoimmunity. Autoimmunity. 2007;40:267–273. - PubMed

Publication types