. 2015 Sep 23;10(9):e0137388.
doi: 10.1371/journal.pone.0137388. eCollection 2015.

Manganese [III] Tetrakis [5,10,15,20]-Benzoic Acid Porphyrin Reduces Adiposity and Improves Insulin Action in Mice with Pre-Existing Obesity

Affiliations

Manganese [III] Tetrakis [5,10,15,20]-Benzoic Acid Porphyrin Reduces Adiposity and Improves Insulin Action in Mice with Pre-Existing Obesity

Jonathan R Brestoff et al. PLoS One. .

Abstract

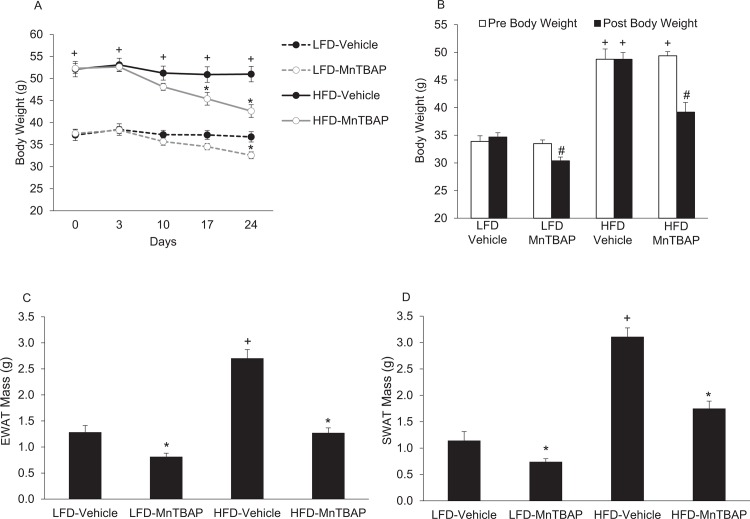
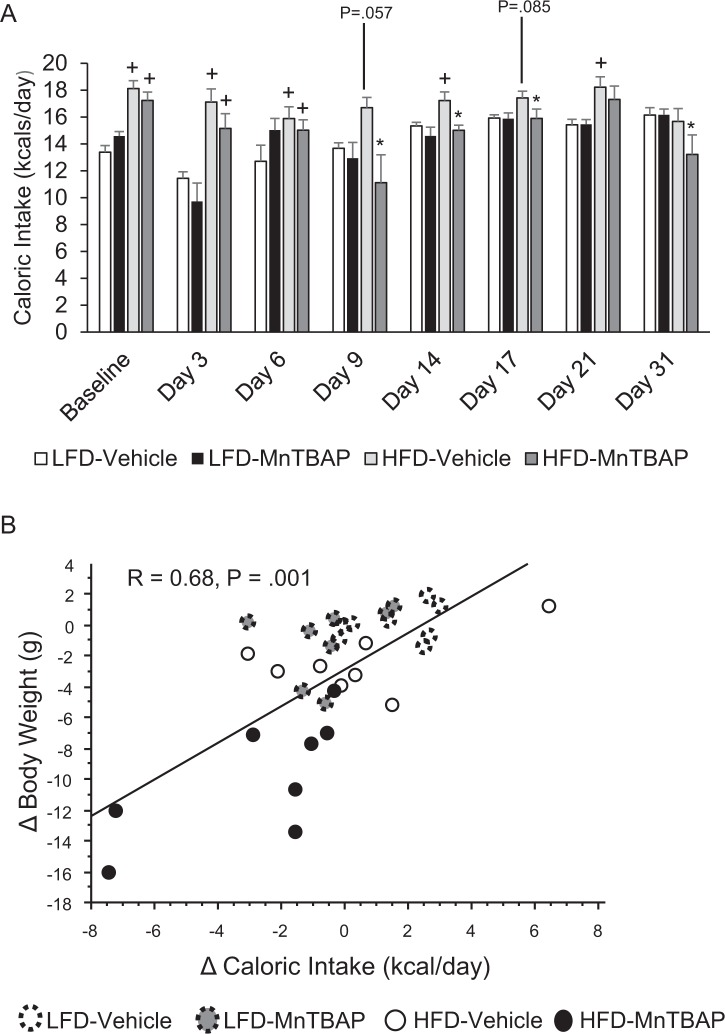
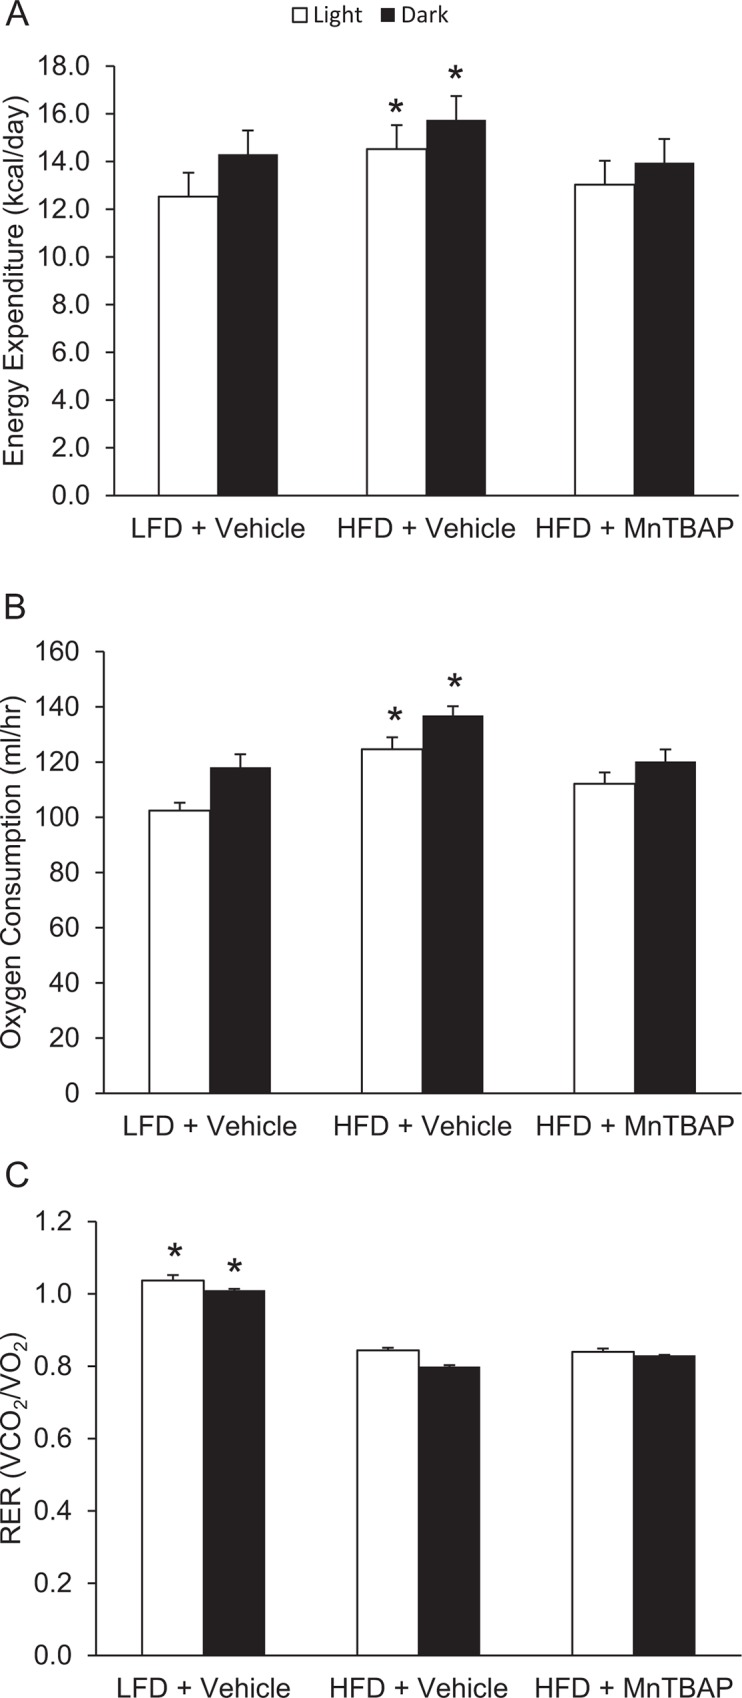
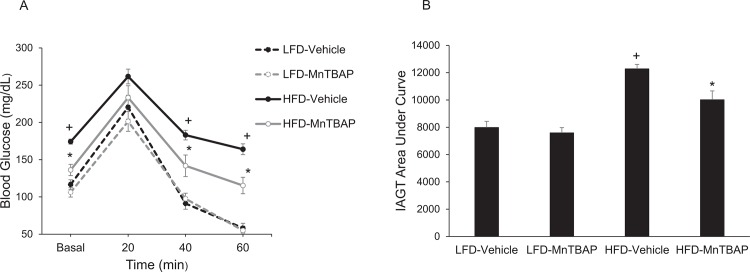
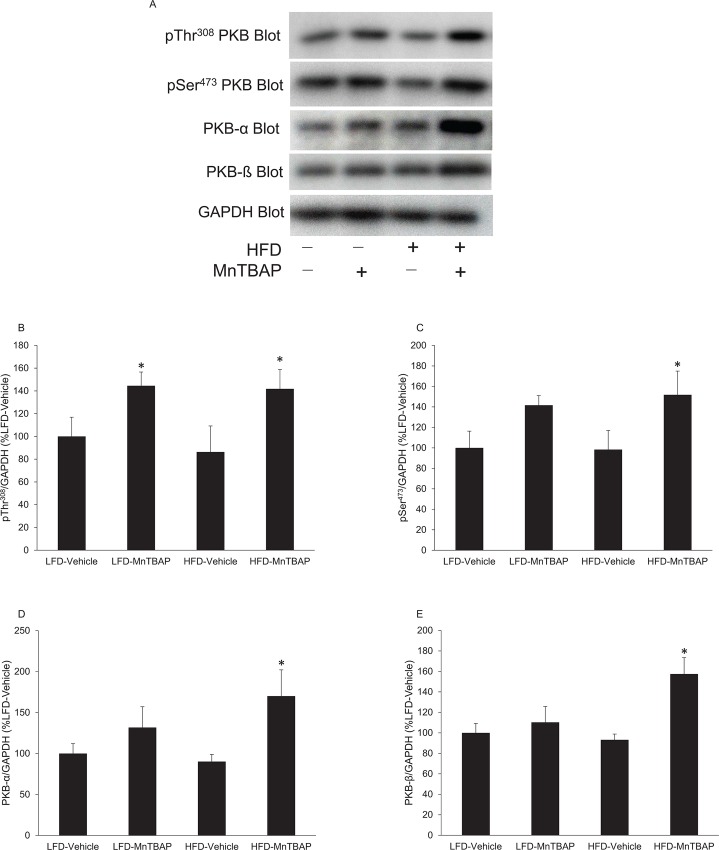
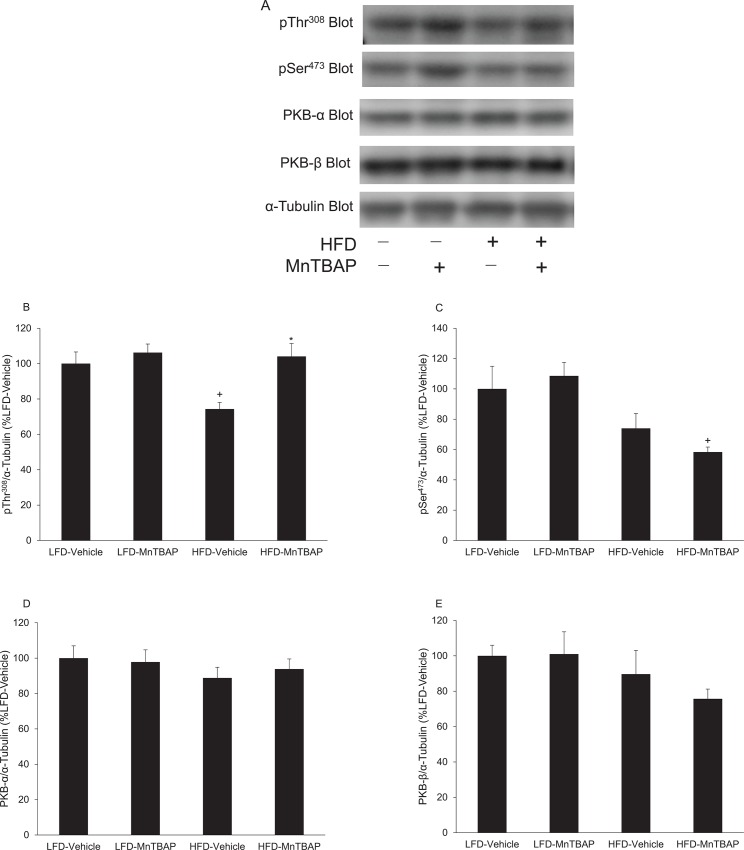
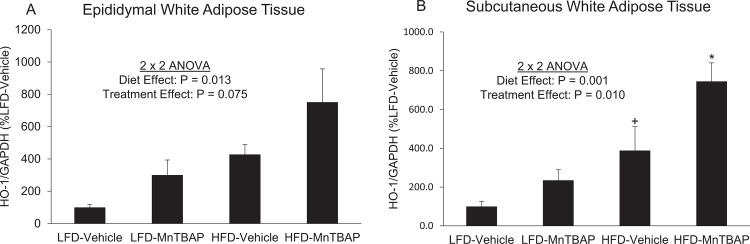
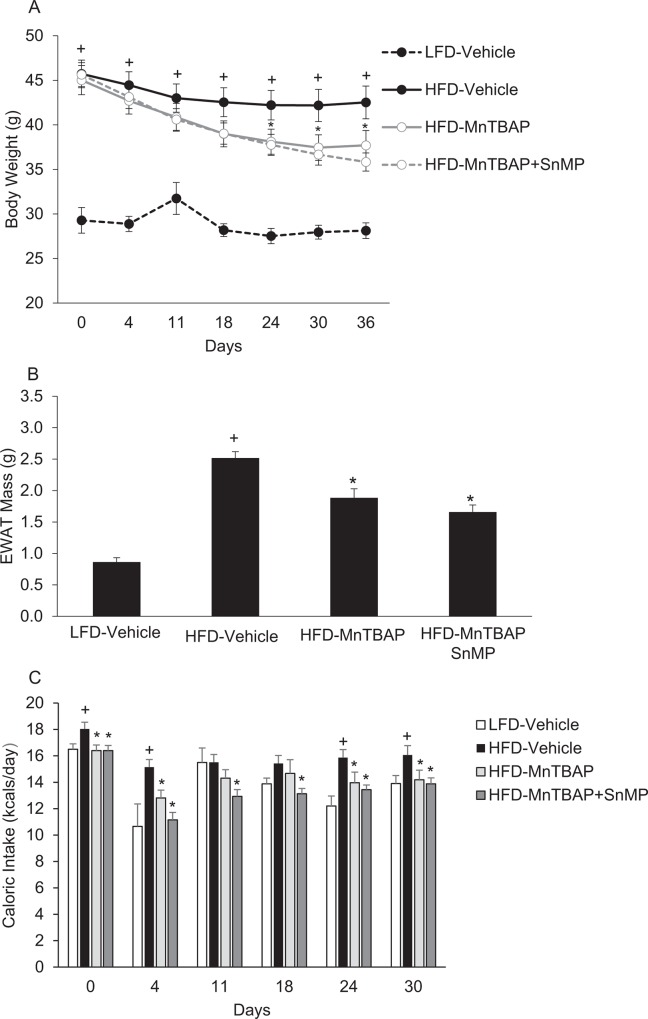
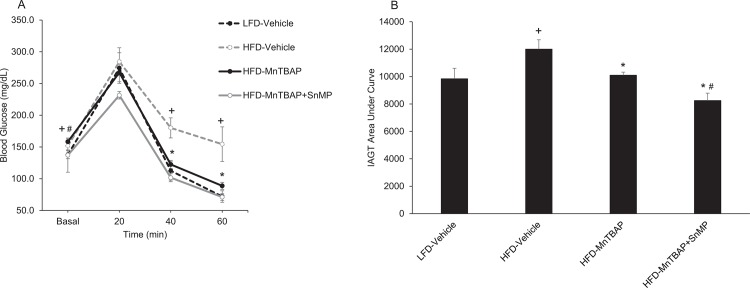
The superoxide dismutase mimetic manganese [III] tetrakis [5,10,15,20]-benzoic acid porphyrin (MnTBAP) is a potent antioxidant compound that has been shown to limit weight gain during short-term high fat feeding without preventing insulin resistance. However, whether MnTBAP has therapeutic potential to treat pre-existing obesity and insulin resistance remains unknown. To investigate this, mice were treated with MnTBAP or vehicle during the last five weeks of a 24-week high fat diet (HFD) regimen. MnTBAP treatment significantly decreased body weight and reduced white adipose tissue (WAT) mass in mice fed a HFD and a low fat diet (LFD). The reduction in adiposity was associated with decreased caloric intake without significantly altering energy expenditure, indicating that MnTBAP decreases adiposity in part by modulating energy balance. MnTBAP treatment also improved insulin action in HFD-fed mice, a physiologic response that was associated with increased protein kinase B (PKB) phosphorylation and expression in muscle and WAT. Since MnTBAP is a metalloporphyrin molecule, we hypothesized that its ability to promote weight loss and improve insulin sensitivity was regulated by heme oxygenase-1 (HO-1), in a similar fashion as cobalt protoporphyrins. Despite MnTBAP treatment increasing HO-1 expression, administration of the potent HO-1 inhibitor tin mesoporphyrin (SnMP) did not block the ability of MnTBAP to alter caloric intake, adiposity, or insulin action, suggesting that MnTBAP influences these metabolic processes independent of HO-1. These data demonstrate that MnTBAP can ameliorate pre-existing obesity and improve insulin action by reducing caloric intake and increasing PKB phosphorylation and expression.


Conflict of interest statement

Competing Interests: Although authors JRB and THR are co-founders of and own stock in Symmetry Therapeutics, Inc., and hold patents related to the work in this article, we confirm that this does not alter our adherence to PLOS ONE policies on sharing data and materials. We also confirm that our patents (Composition and method to affect obesity: US8,598,150, US8,809,312 and US8,987,245) do not alter our adherence to PLOS ONE policies on sharing data and materials.

Figures

Fig 1
Fig 1. MnTBAP treatment reduces body weight and adipose tissue mass in mice fed a LFD or HFD.
Mice were fed a LFD or HFD for 5 months and then treated with or without MnTBAP (10 mg/kg) daily for 5 weeks. (A) Fed-state body weights at different treatment durations. (B) Fasted body weights before and after MnTBAP or vehicle treatments. (C) Epididymal white adipose tissue (EWAT) mass. *, Denotes statistically significant difference from respective vehicle-treated mice. +, Denotes statistically significant difference from respective LFD mice. N = 5–6 mice per group.
Fig 2
Fig 2. MnTBAP treatment reduces caloric intake in mice fed a HFD.
(A) Caloric intake was assessed at various time points of MnTBAP treatment in mice previously fed a LFD or HFD for 5 months. (B) Correlation between the change in body weight and the change in caloric intake from pre-treatment to post-treatment. *, Denotes statistically significant difference from HFD-Vehicle. +, Denotes statistically significant difference from respective LFD mice. P-value for post-hoc analysis for LFD-Vehicle vs. HFD-Vehicle mice: Day 9, P = 0.057; Day 17, P = 0.085. N = 6–8 mice per group.
Fig 3
Fig 3. The effects of a HFD and MnTBAP treatment on energy expenditure, oxygen consumption, and RER in mice.
Indirect calorimetry using open circuit spirometry was conducted for 24 hours 3 weeks into the MnTBAP treatment course for the assessment of energy expenditure (A), oxygen consumption (B), and RER values (C). *, Denotes statistically significant difference from the all other groups respective of light/dark cycle. N = 6 mice per group.
Fig 4
Fig 4. MnTBAP treatment improves insulin-assisted glucose tolerance (IAGT) in mice fed a HFD.
Mice were simultaneously injected with 2.0 U/Kg insulin and 2.0 g/Kg glucose and blood glucose values were assessed at baseline and 20, 40, and 60 min following the injection (Panels A) and the area under the IAGT curve was calculated (Panels B). *, Denotes statistically significant difference from HFD-Vehicle. +, Denotes statistically significant difference from LFD-Vehicle mice. N = 7–14 mice per group.
Fig 5
Fig 5. MnTBAP treatment increase insulin-stimulated PKB phosphorylation and content in muscles from mice fed a HFD.
Mice were fed a LFD or HFD for 5 months and then treated with or without MnTBAP (10 mg/kg) daily for 5 weeks. At 15 min following an intraperitoneal injection of insulin (2 U/Kg), quadriceps muscles were excised and rapidly frozen in liquid nitrogen for subsequent Western blot analyses. (A) Representative PKB immunoblots for pThr308 and pSer473 PKB as well as total PKB-α and PKB-β isoforms. GAPDH was used as a loading control. Quantification of (B) pThr308 PKB, (C) pSer308 PKB, (D) PKB-α and (E) PKB-β content, each normalized to GAPDH. *, Denotes statistically significant difference from HFD-Vehicle. N = 5–6 mice per group.
Fig 6
Fig 6. MnTBAP treatment alters insulin-stimulated PKB phosphorylation but not content in EWAT from mice fed a HFD.
Mice were fed a LFD or HFD for 5 months and then treated with or without MnTBAP (10 mg/kg) daily for 5 weeks. At 15 min following an intraperitoneal injection of insulin (2 U/Kg), EWAT was excised and rapidly frozen in liquid nitrogen for subsequent Western blot experiments. (A) Representative PKB immunoblots for pThr308 and pSer473 PKB as well as total PKB-α and PKB-β isoforms. α-tubulin was used as a loading control. Quantification of (B) pThr308 PKB, (C) pSer308 PKB, (D) PKB-α and (E) PKB-β content, each normalized to α-tubulin. *, Denotes statistically significant difference from HFD-Vehicle. +, Denotes statistically significant difference from LFD-MnTBAP. N = 5–6 mice per group.
Fig 7
Fig 7. MnTBAP treatment increases Ho-1 mRNA levels in adipose tissue from mice fed a HFD.
The mRNA levels for Ho-1 from EWAT (A) and SWAT (B) of mice fed a LFD or HFD and treated with MnTBAP or vehicle. +, Denotes statistically significant difference from LFD-Vehicle. *, Denotes statistically significant difference from HFD-Vehicle.
Fig 8
Fig 8. The HO-1 inhibitor SnMP does not block MnTBAP’s ability to reduce body weight, adipose tissue mass, and caloric intake in mice fed HFD.
Mice were fed a LFD or HFD for 5 months and then treated with MnTBAP (10 mg/kg) alone or in combination with SnMP (20 mg/Kg) daily for 5 weeks. (A) Fed-state body weights at different treatment durations. (B) Epididymal white adipose tissue (EWAT) mass. (C) Caloric intake was assessed at various time points of MnTBAP or MnTBAP+SnMP treatment in mice previously fed a LFD or HFD for 5 months. *, Denotes statistically significant difference from LFD vehicle-treated mice. +, Denotes statistically significant difference from respective LFD mice. N = 5–6 mice per group.
Fig 9
Fig 9. SnMP improves MnTBAP’s ability to reduce blood glucose levels during IAGT tests.
Mice were fed a LFD or HFD for 5 months and then treated with MnTBAP (10 mg/kg) alone or in combination with SnMP (20 mg/Kg) daily for 5 weeks. Mice were simultaneously injected with 2.0 U/Kg insulin and 2.0 g/Kg glucose and blood glucose values were assessed at baseline and 20, 40, and 60 min following the injection (Panels A) and the area under the IAGT curve was calculated (Panels B). *, Denotes statistically significant difference from HFD-Vehicle. +, Denotes statistically significant difference from LFD-Vehicle mice. #, Denotes statistically significant difference from HFD-MnTBAP mice. N = 5 mice per group.

References

    1. Ogden CL, Carroll MD, Flegal KM. Prevalence of obesity in the United States. JAMA. 2014;312: 189–190. 10.1001/jama.2014.6228 - DOI - PubMed
    1. Centers for Disease Control and Prevention. National diabetes fact sheet:national estimates and general information on diabetes and prediabetes in the United States, Atlanta, GA: U.S. Department of Health and Human Services, Centers for Disease Control and Prevention; 2011.
    1. American Diabetes Association. Economic costs of diabetes in the U.S. in 2012. Diabetes Care. 2013;36: 1033–1046. 10.2337/dc12-2625 - DOI - PMC - PubMed
    1. Bashan N, Kovsan J, Kachko I, Ovadia H, Rudich A. Positive and negative regulation of insulin signaling by reactive oxygen and nitrogen species. Physiol Rev. 2009;89: 27–71. 10.1152/physrev.00014.2008 - DOI - PubMed
    1. Boden MJ, Brandon AE, Tid-Ang J, Preston E, Wilks D, Stuart E, et al. Overexpression of manganese superoxide dismutase ameliorates high-fat diet-induced insulin resistance in rat skeletal muscle. Am J Physiol Endocrinol Metab. 2012;303: E798–E805. 10.1152/ajpendo.00577.2011 - DOI - PMC - PubMed

Publication types

MeSH terms