. 2016 Mar;278(3):822-30.
doi: 10.1148/radiol.2015141922. Epub 2015 Sep 23.

Myeloperoxidase Nuclear Imaging for Epileptogenesis

Affiliations

Myeloperoxidase Nuclear Imaging for Epileptogenesis

Yinian Zhang et al. Radiology. 2016 Mar.

Erratum in

  • Myeloperoxidase Nuclear Imaging for Epileptogenesis.
    Zhang Y, Seeburg DP, Pulli B, Wojtkiewicz GR, Bure L, Atkinson W, Schob S, Iwamoto Y, Ali M, Zhang W, Rodriguez E, Milewski A, Keliher EJ, Wang C, Pan Y, Swirski FK, Chen JW. Zhang Y, et al. Radiology. 2017 Feb;282(2):614. doi: 10.1148/radiol.2017164044. Radiology. 2017. PMID: 28099101 Free PMC article. No abstract available.

Abstract

Purpose: To determine if myeloperoxidase (MPO) is involved in epileptogenesis and if molecular nuclear imaging can be used to noninvasively map inflammatory changes in epileptogenesis.

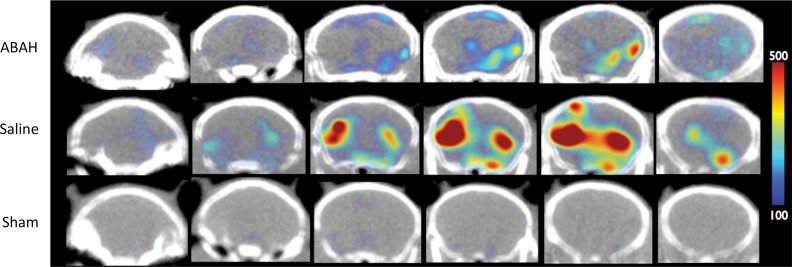
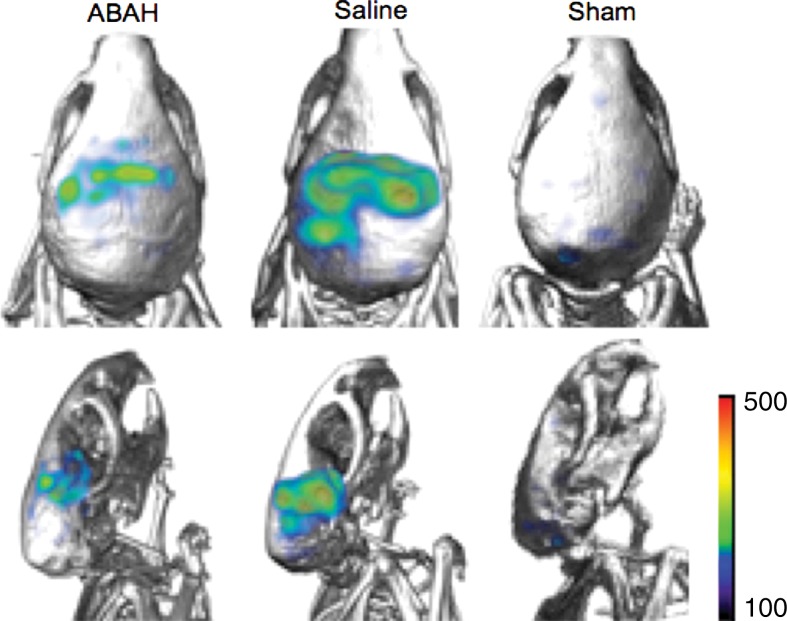
Materials and methods: The animal and human studies were approved by the institutional review boards. Pilocarpine-induced epileptic mice were treated with 4-aminobenzoic acid hydrazide (n = 46), a specific irreversible MPO inhibitor, or saline (n = 42). Indium-111-bis-5-hydroxytryptamide-diethylenetriaminepentaacetate was used to image brain MPO activity (n = 6 in the 4-aminobenzoic acid hydrazide and saline groups; n = 5 in the sham group) by using single photon emission computed tomography/computed tomography. The role of MPO in the development of spontaneous recurrent seizures was assessed by means of clinical symptoms and biochemical and histopathologic data. Human brain specimens from a patient with epilepsy and a patient without epilepsy were stained for MPO. The Student t test, one-way analysis of variance, and Mann-Whitney and Kruskal-Wallis tests were used. Differences were regarded as significant if P was less than .05.

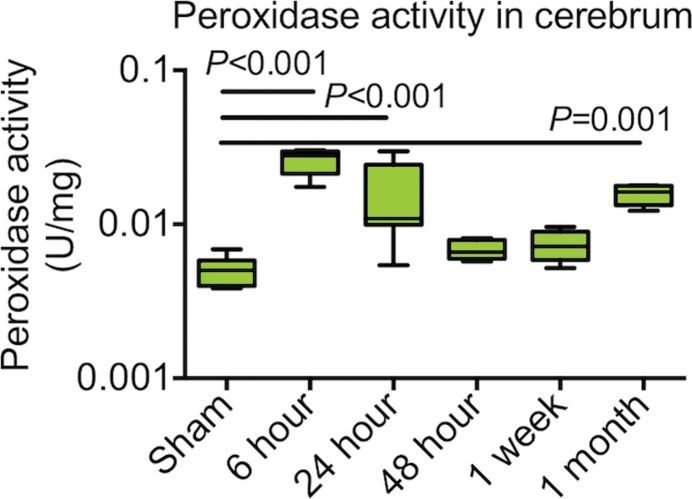
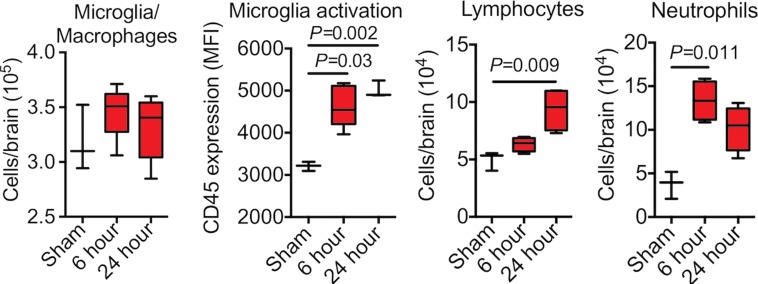
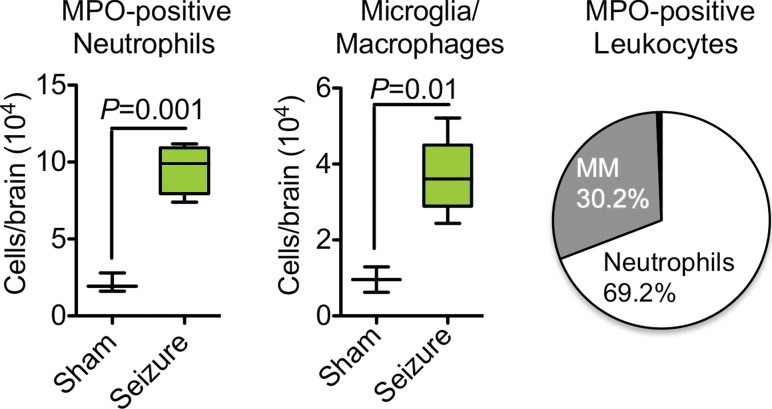
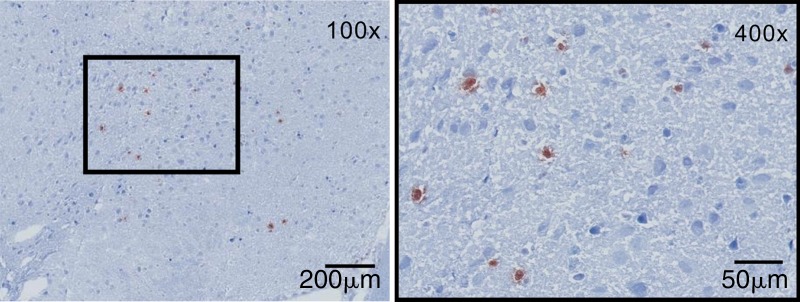
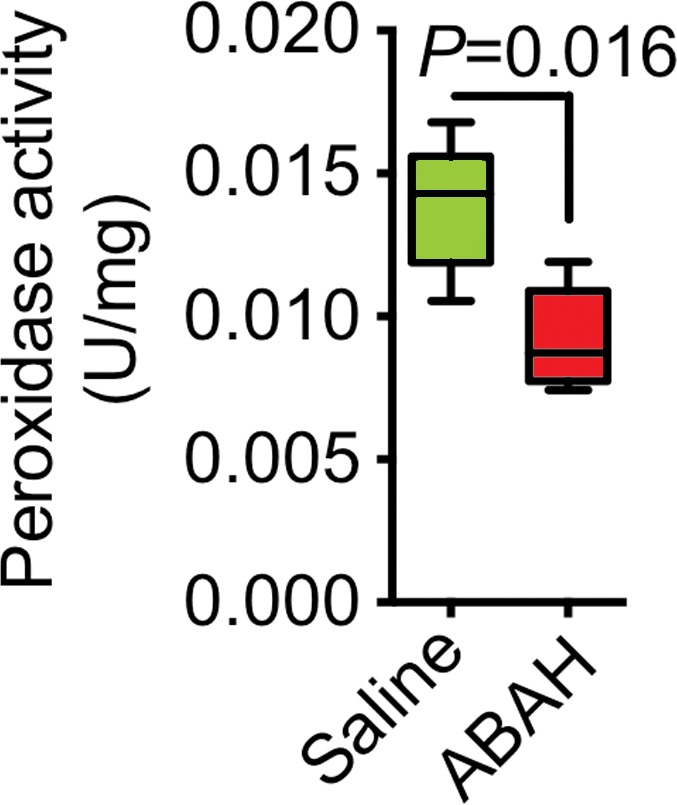
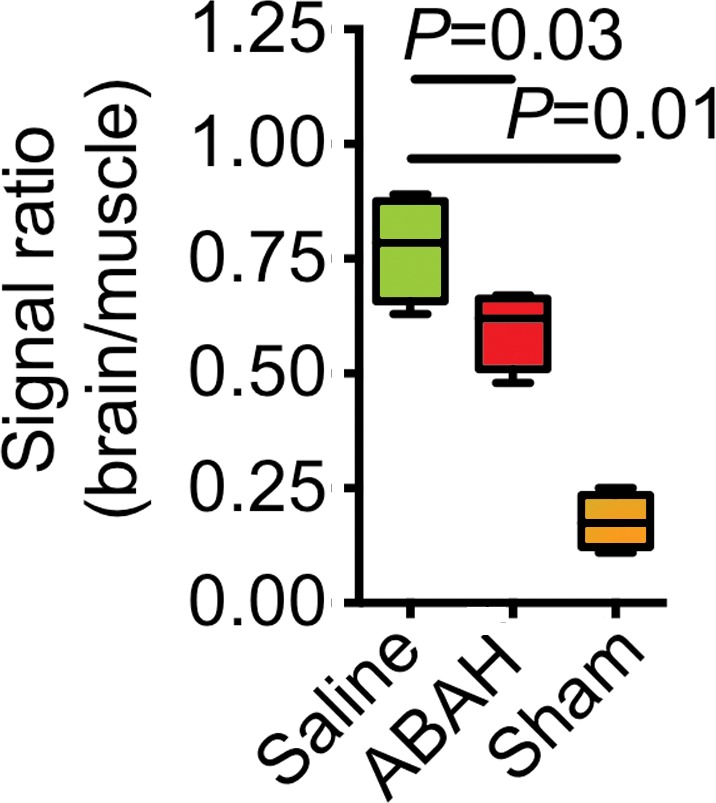
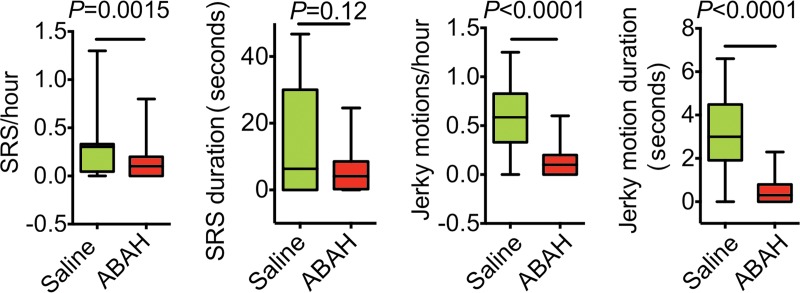
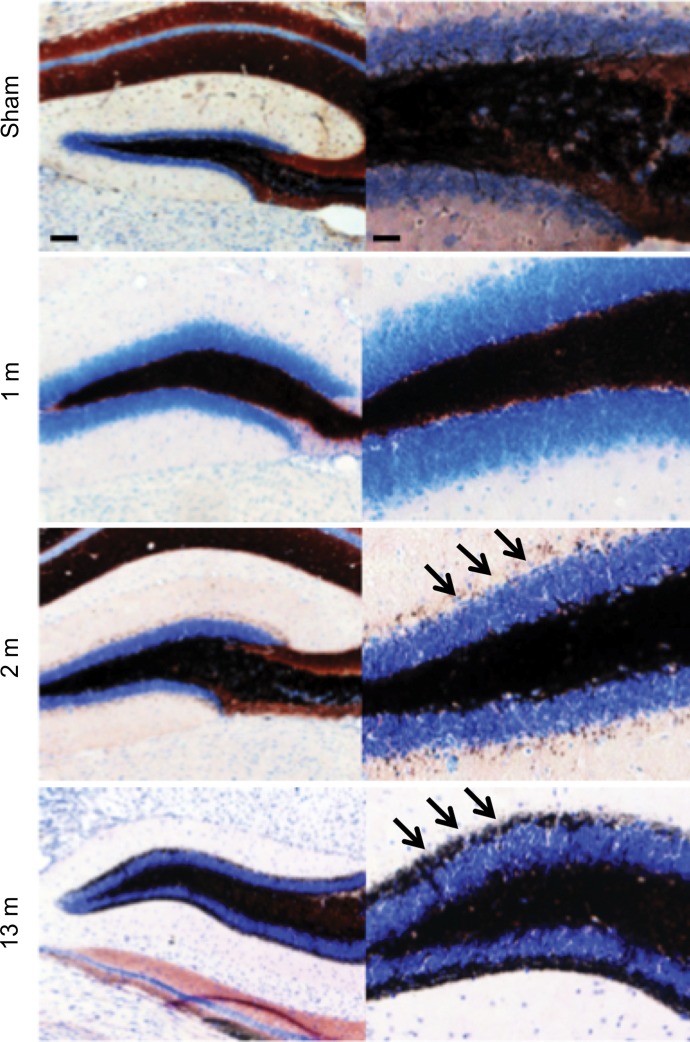
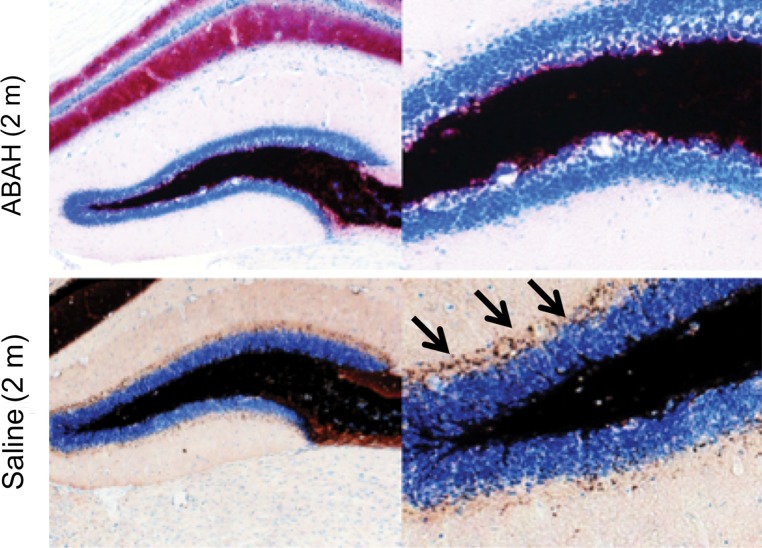
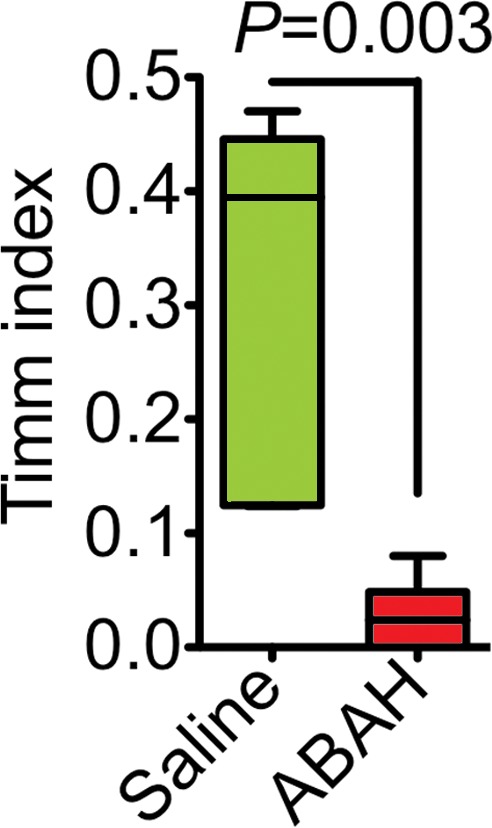
Results: MPO and leukocytes increased in the brain during epileptogenesis (P < .05). Blocking MPO delayed spontaneous recurrent seizures (99.6 vs 142 hours, P = .016), ameliorated the severity of spontaneous recurrent seizures (P < .05), and inhibited mossy fiber sprouting (Timm index, 0.31 vs 0.03; P = .003). Matrix metalloproteinase activity was upregulated during epileptogenesis in an MPO-dependent manner (1.44 vs 0.94 U/mg, P = .049), suggesting that MPO acts upstream of matrix metalloproteinases. MPO activity was mapped during epileptogenesis in vivo in the hippocampal regions. Resected temporal lobe tissue from a human patient with refractory epilepsy but not the temporal lobe tissue from a patient without seizures demonstrated positive MPO immunostaining, suggesting high translational potential for this imaging technology.

Conclusion: The findings of this study highlight an important role for MPO in epileptogenesis and show MPO to be a potential therapeutic target and imaging biomarker for epilepsy.


Figures

Figure 1a:
Figure 1a:
Plots of MPO and leukocytes in epileptogenesis. (a) Peroxidase activity after SE in cerebrum (n = 6 per group; data were obtained by using one-way analysis of variance, followed by the Bonferroni multiple-comparisons test in which the values from each day are compared with those of shams). (b) Microglia activation and numbers of lymphocytes and neutrophils were increased in mice with seizures (n = 6 per group; the Kruskal-Wallis test was used, followed by the Dunn multiple-comparisons test, as compared with sham values). All data are means ± standard errors of measurement. MFI = mean fluorescence intensity.
Figure 1b:
Figure 1b:
Plots of MPO and leukocytes in epileptogenesis. (a) Peroxidase activity after SE in cerebrum (n = 6 per group; data were obtained by using one-way analysis of variance, followed by the Bonferroni multiple-comparisons test in which the values from each day are compared with those of shams). (b) Microglia activation and numbers of lymphocytes and neutrophils were increased in mice with seizures (n = 6 per group; the Kruskal-Wallis test was used, followed by the Dunn multiple-comparisons test, as compared with sham values). All data are means ± standard errors of measurement. MFI = mean fluorescence intensity.
Figure 2a:
Figure 2a:
Sources of brain MPO. (a) Plots (left) and graph (right) show quantification of MPO-positive cells (n = 6 per group; the Mann-Whitney test was used). All data in the plots are means ± standard errors of measurement. (b) Photomicrographs (Timm stain; original magnification, ×100 [left] and ×400 [right]) show that MPO-positive cells were mainly found in the hippocampal and parahippocampal regions. MM = macrophages and microglia.
Figure 2b:
Figure 2b:
Sources of brain MPO. (a) Plots (left) and graph (right) show quantification of MPO-positive cells (n = 6 per group; the Mann-Whitney test was used). All data in the plots are means ± standard errors of measurement. (b) Photomicrographs (Timm stain; original magnification, ×100 [left] and ×400 [right]) show that MPO-positive cells were mainly found in the hippocampal and parahippocampal regions. MM = macrophages and microglia.
Figure 3a:
Figure 3a:
MPO activity and its product decreased with MPO inhibition ex vivo and in vivo. (a) Plot shows that peroxidase activity decreased with MPO inhibition 6 hours after SE (n = 6 per group; P = .02, according to results of the Student t test). (b) Representative SPECT/CT images show that in vivo MPO activity increased after SE and was partially blocked with MPO inhibition. (c) Three-dimensional representations of MPO activity in the entire mouse brains are shown for the same groups as those in in b. (d) Plot shows the quantification of imaging findings (according to the Kruskal-Wallis test, followed by the Dunn multiple-comparisons test). All data in plots are means ± standard errors of measurement.
Figure 3b:
Figure 3b:
MPO activity and its product decreased with MPO inhibition ex vivo and in vivo. (a) Plot shows that peroxidase activity decreased with MPO inhibition 6 hours after SE (n = 6 per group; P = .02, according to results of the Student t test). (b) Representative SPECT/CT images show that in vivo MPO activity increased after SE and was partially blocked with MPO inhibition. (c) Three-dimensional representations of MPO activity in the entire mouse brains are shown for the same groups as those in in b. (d) Plot shows the quantification of imaging findings (according to the Kruskal-Wallis test, followed by the Dunn multiple-comparisons test). All data in plots are means ± standard errors of measurement.
Figure 3c:
Figure 3c:
MPO activity and its product decreased with MPO inhibition ex vivo and in vivo. (a) Plot shows that peroxidase activity decreased with MPO inhibition 6 hours after SE (n = 6 per group; P = .02, according to results of the Student t test). (b) Representative SPECT/CT images show that in vivo MPO activity increased after SE and was partially blocked with MPO inhibition. (c) Three-dimensional representations of MPO activity in the entire mouse brains are shown for the same groups as those in in b. (d) Plot shows the quantification of imaging findings (according to the Kruskal-Wallis test, followed by the Dunn multiple-comparisons test). All data in plots are means ± standard errors of measurement.
Figure 3d:
Figure 3d:
MPO activity and its product decreased with MPO inhibition ex vivo and in vivo. (a) Plot shows that peroxidase activity decreased with MPO inhibition 6 hours after SE (n = 6 per group; P = .02, according to results of the Student t test). (b) Representative SPECT/CT images show that in vivo MPO activity increased after SE and was partially blocked with MPO inhibition. (c) Three-dimensional representations of MPO activity in the entire mouse brains are shown for the same groups as those in in b. (d) Plot shows the quantification of imaging findings (according to the Kruskal-Wallis test, followed by the Dunn multiple-comparisons test). All data in plots are means ± standard errors of measurement.
Figure 4:
Figure 4:
Plots show a reduction in recurrent seizure activity with MPO inhibition. There is decreased frequency and duration of both SRS and jerky motion over 60 days in the ABAH-treated group (according to repeated-measures one-way analysis of variance).
Figure 5a:
Figure 5a:
Mossy fiber sprouting at different time points after SE conversion and MPO in epileptic human brain. (a) Photomicrographs ( Timm stain; images on the left, scale bar = 250 μm [original magnification, ×40]; and images on the right, 25 μm [original magnification, ×400]) show that mossy fiber sprouting was detected 2 months after SE conversion in animals induced with pilocarpine (arrows); this further increased 13 months after SE (arrows). (b) Photomicrographs ( Timm stain; images on the left, original magnification of ×40; images on the right, original magnification of ×400) show that when compared with saline-treated control mice, ABAH-treated mice have nearly undetectable mossy fiber sprouting 2 months after SE. (c) Plot derived from quantitative analysis shows a marked decrease in mossy fiber sprouting 2 months after ABAH administration (n = 6 per group; P = .003, according to results of the Mann-Whitney test). Data are means ± standard errors of measurement.
Figure 5b:
Figure 5b:
Mossy fiber sprouting at different time points after SE conversion and MPO in epileptic human brain. (a) Photomicrographs ( Timm stain; images on the left, scale bar = 250 μm [original magnification, ×40]; and images on the right, 25 μm [original magnification, ×400]) show that mossy fiber sprouting was detected 2 months after SE conversion in animals induced with pilocarpine (arrows); this further increased 13 months after SE (arrows). (b) Photomicrographs ( Timm stain; images on the left, original magnification of ×40; images on the right, original magnification of ×400) show that when compared with saline-treated control mice, ABAH-treated mice have nearly undetectable mossy fiber sprouting 2 months after SE. (c) Plot derived from quantitative analysis shows a marked decrease in mossy fiber sprouting 2 months after ABAH administration (n = 6 per group; P = .003, according to results of the Mann-Whitney test). Data are means ± standard errors of measurement.
Figure 5c:
Figure 5c:
Mossy fiber sprouting at different time points after SE conversion and MPO in epileptic human brain. (a) Photomicrographs ( Timm stain; images on the left, scale bar = 250 μm [original magnification, ×40]; and images on the right, 25 μm [original magnification, ×400]) show that mossy fiber sprouting was detected 2 months after SE conversion in animals induced with pilocarpine (arrows); this further increased 13 months after SE (arrows). (b) Photomicrographs ( Timm stain; images on the left, original magnification of ×40; images on the right, original magnification of ×400) show that when compared with saline-treated control mice, ABAH-treated mice have nearly undetectable mossy fiber sprouting 2 months after SE. (c) Plot derived from quantitative analysis shows a marked decrease in mossy fiber sprouting 2 months after ABAH administration (n = 6 per group; P = .003, according to results of the Mann-Whitney test). Data are means ± standard errors of measurement.

References

    1. Perucca E, French J, Bialer M. Development of new antiepileptic drugs: challenges, incentives, and recent advances. Lancet Neurol 2007;6(9):793–804. - PubMed
    1. Bialer M, White HS. Key factors in the discovery and development of new antiepileptic drugs. Nat Rev Drug Discov 2010;9(1):68–82. - PubMed
    1. Vezzani A, French J, Bartfai T, Baram TZ. The role of inflammation in epilepsy. Nat Rev Neurol 2011;7(1):31–40. - PMC - PubMed
    1. Cacheaux LP, Ivens S, David Y, et al. . Transcriptome profiling reveals TGF-beta signaling involvement in epileptogenesis. J Neurosci 2009;29(28):8927–8935. - PMC - PubMed
    1. Fabene PF, Navarro Mora G, Martinello M, et al. . A role for leukocyte-endothelial adhesion mechanisms in epilepsy. Nat Med 2008;14(12):1377–1383. - PMC - PubMed

Publication types