. 2015 Sep 23;10(9):e0139023.
doi: 10.1371/journal.pone.0139023. eCollection 2015.

Neuroprotective Potential of Mesenchymal Stem Cell-Based Therapy in Acute Stages of TNBS-Induced Colitis in Guinea-Pigs

Affiliations

Neuroprotective Potential of Mesenchymal Stem Cell-Based Therapy in Acute Stages of TNBS-Induced Colitis in Guinea-Pigs

Ainsley M Robinson et al. PLoS One. .

Abstract

Background & aims: The therapeutic benefits of mesenchymal stem cells (MSCs), such as homing ability, multipotent differentiation capacity and secretion of soluble bioactive factors which exert neuroprotective, anti-inflammatory and immunomodulatory properties, have been attributed to attenuation of autoimmune, inflammatory and neurodegenerative disorders. In this study, we aimed to determine the earliest time point at which locally administered MSC-based therapies avert enteric neuronal loss and damage associated with intestinal inflammation in the guinea-pig model of colitis.

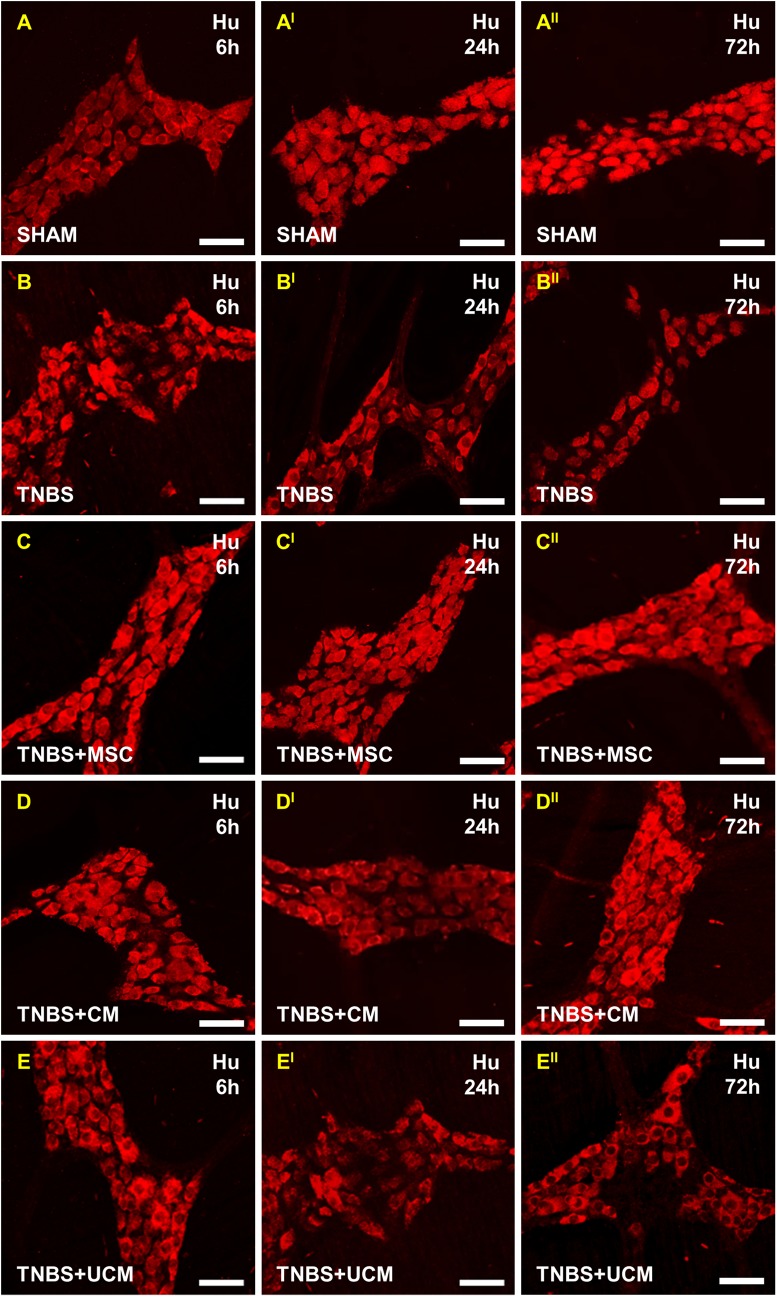
Methods: At 3 hours after induction of colitis by 2,4,6-trinitrobenzene-sulfonate (TNBS), guinea-pigs received either human bone marrow-derived MSCs, conditioned medium (CM), or unconditioned medium by enema into the colon. Colon tissues were collected 6, 24 and 72 hours after administration of TNBS. Effects on body weight, gross morphological damage, immune cell infiltration and myenteric neurons were evaluated. RT-PCR, flow cytometry and antibody array kit were used to identify neurotrophic and neuroprotective factors released by MSCs.

Results: MSC and CM treatments prevented body weight loss, reduced infiltration of leukocytes into the colon wall and the myenteric plexus, facilitated repair of damaged tissue and nerve fibers, averted myenteric neuronal loss, as well as changes in neuronal subpopulations. The neuroprotective effects of MSC and CM treatments were observed as early as 24 hours after induction of inflammation even though the inflammatory reaction at the level of the myenteric ganglia had not completely subsided. Substantial number of neurotrophic and neuroprotective factors released by MSCs was identified in their secretome.

Conclusion: MSC-based therapies applied at the acute stages of TNBS-induced colitis start exerting their neuroprotective effects towards enteric neurons by 24 hours post treatment. The neuroprotective efficacy of MSC-based therapies can be exerted independently to their anti-inflammatory effects.


Conflict of interest statement

Competing Interests: The authors have declared that no competing interests exist.

Figures

Fig 1
Fig 1. MSC homing within the inflamed colon.
Migration and homing of human bone marrow MSCs to the inflamed area of the guinea-pig colon was confirmed using anti-HLA-A,B,C antibody specific to human MHC class I. MSCs administered 3 hours after TNBS application were localized mostly in the lamina propria 6 hours after induction of colitis (A). Transmural engraftment of human MSCs into the colon wall to the level of the myenteric ganglia was evident 24 and 72 hours post induction of colitis (A I -A II ). At 6, 24 and 72 hours, HLA-A,B,C-IR cells were not detected in the distal colon from MSC-only treated guinea-pigs, validating absence of MSC homing to non-inflamed tissues (B-B II ). n = 3/group/time point. Scale bars = 50μm.
Fig 2
Fig 2. Body weight of guinea-pigs within 72 hours post induction of colitis or sham treatment.
No change in guinea-pig weight was observed in all groups at the 6 hour time point. Within 72 hours, administration of TNBS-only and treatment with UCM induced significant loss of body weight, while treatment with MSCs and CM after the induction of colitis prevented loss of body weight. n = 4/group/time point. *P<0.05 compared to sham, MSC and CM-treated groups, ^P<0.05 compared to sham and MSC-treated groups.
Fig 3
Fig 3. Gross morphological changes in the distal colon assessed in H&E stained cross sections.
An intact epithelial lining and systematic arrangement of colonic layers were evident in sections from sham-treated animals at all time points (A-A II ). Immune infiltrate, flattening of the glands, disruption to the epithelial lining and destruction of mucosal epithelium, goblet cell loss and muscular edema were observed in colon tissues from TNBS-administered (B-B II ) and UCM-treated (E-E II ) guinea-pigs at all time points. Sections from MSC and CM-treated animals revealed initiation of colonic repair at 6 hours post induction of colitis (C-D). Restoration of colonic architecture was observed at 24 (C I -D I ) and 72 hours (C II -D II ). n = 4/group/time point. Scale bars = 50μm.
Fig 4
Fig 4. Leukocyte infiltration in colon cross sections.
Cross sections of the distal colon were labelled with pan-leukocyte marker anti-CD45 antibody. At 6 hours, an increase in CD45-IR cells was observed in the mucosa of TNBS-only, MSC, CM and UCM-treated sections compared to sections from sham-treated animals (A-E). At 24 and 72 hours, elevated numbers of CD45-IR cells were prominent transmurally through the layers of the colon wall in TNBS-only (B I -B II ) and UCM-treated (E I -E II ) cross sections. Treatment with MSCs and CM attenuated the increase of CD45-IR cells at 24 (C I -D I ) and 72 hours (C II -D II ). n = 4/group/time point. Scale bars = 50μm.
Fig 5
Fig 5. Quantitative analysis of leucocyte numbers in colon cross sections and wholemount preparations.
Total number of leukocytes counted per 2mm2 area within the colon wall in cross sections (A). Total number of leukocytes quantified per 2mm2 area in LMMP preparations (B). n = 4/group/time point. ^P < .05, ^^P < .01, ^^^P < .001 compared to sham-treated group. ***P < .001 compared to sham, MSC and CM-treated groups.
Fig 6
Fig 6. Infiltration of leukocytes to the level of the myenteric plexus post induction of colitis.
CD45-IR cells in LMMP colon preparations. At 6 hours, a low level of leukocyte infiltration around the myenteric ganglia was observed in all groups (A-E). At 24 hours, leukocyte infiltration in LMMP preparations from TNBS-only (B I ) and UCM-treated (E I ) animals was elevated in comparison to sham (A I ), MSC (C I ) and CM-treated (D I ) groups. CD45-IR cells were still evident at 72 hours in preparations from TNBS-only (B II ) and UCM-treated (E II ) animals. Leukocytes in preparations from MSC and CM-treated groups returned to sham-treated levels by 72 hours (C II -D II ). n = 4/group/time point. Scale bars = 100μm.
Fig 7
Fig 7. Nerve fibers in cross sections of the distal colon.
Orderly distribution of fibers labelled by neuron specific anti-β-tubulin (III) antibody was observed in colon sections from sham-treated guinea-pigs at all time points (A-A II ). Disorganized, fragmented, and irregularly dispersed fibers were evident within the mucosa of sections from TNBS-only (B-B II ) and UCM-treated (E-E II ) animals at all time points. Damage to nerve fibers was present in sections from MSC and CM-treated animals at 6 hours (C-D), however re-growth of nerve fibers was observed at 24 (C I -D I ) and 72 hours (C II -D II ). n = 4/group/time point. Scale bars = 50μm.
Fig 8
Fig 8. Quantitative analysis of nerve fiber density and the total number of neurons in the myenteric ganglia.
Nerve fiber density quantified per 2mm2 area in cross sections of the distal colon (A). The total number of myenteric neurons per 2mm2 area in LMMP wholemount preparations (B). n = 4/group/time point. ^P < .05, ^^P < .01, ^^^P < .001 compared to sham-treated group. *P < .05, **P < .01, ***P < .001 compared to MSC and CM-treated groups.
Fig 9
Fig 9. Effects of MSC and CM treatments on the total number of myenteric neurons.
Myenteric neurons were identified by anti-Hu antibody in wholemount preparations of the distal colon. At 6 hours post TNBS administration, the number of myenteric neurons was similar across all groups (A-E). At 24 and 72 hours, significant loss of neurons was observed in sections from TNBS-only (B I -B II ) and UCM-treated (E I -E II ) compared to sections from sham-treated (A I -A II ) animals, but not in MSC (C I -C II ) and CM-treated (D I -D II ) groups. n = 4/group/time point. Scale bars = 50μm.
Fig 10
Fig 10. Effects of MSC and CM treatments on nNOS-IR myenteric neurons.
No changes in nNOS-IR neurons were observed at 6 hours in any group (A-E). At 24 and 72 hours, an increase in nNOS-IR neurons was observed in sections from TNBS-only (B I -B II ) and UCM-treated (E I -E II ) animals compared to sham (A I -A II ), but not in MSC and CM-treated groups (C I -C II , D I -D II ). n = 4/group/time point. Scale bars = 50μm.
Fig 11
Fig 11. Quantification of the number and proportion of nNOS-IR myenteric neurons.
The total number of nNOS-IR neurons identified by anti-nNOS antibody per 2mm2 area (A). The proportion of nNOS-IR neurons to the total number of neurons (B). n = 4/group/time point. *P < .05, **P < .01, ***P < .001 compared to sham, MSC and CM-treated groups.
Fig 12
Fig 12. Effects of MSC and CM treatments on ChAT-IR myenteric neurons.
No changes in the number of ChAT-IR myenteric neurons was observed in any group at 6 hours (A-E). Significant loss of ChAT-IR neurons was observed in sections from TNBS-only and UCM-treated animals at 24 and 72 hours (B I -B II , E I -E II ). The number of ChAT-IR myenteric neurons was unaffected in MSC and CM-treated groups at 24 and 72 hours (C I -C II , D I -D II ). n = 4/group/time point. Scale bars = 50μm.
Fig 13
Fig 13. Quantification of the number and proportion of ChAT-IR myenteric neurons.
The total number of ChAT-IR neurons quantified per 2mm2 area (A). The proportion of ChAT-IR neurons to the total number of neurons (B). n = 4/group/time point. ***P < .001 compared to sham, MSC and CM-treated groups.

Similar articles

Cited by

References

    1. Farrell D, Savage E. Symptom burden: a forgotten area of measurement in inflammatory bowel disease. Int J Nurs Prac. 2012;18: 497–500. - PubMed
    1. Abraham C, Cho JH. Inflammatory bowel disease. N Engl J Med. 2009; 361: 2066–78. 10.1056/NEJMra0804647 - DOI - PMC - PubMed
    1. Baumgart DC, Sandborn WJ. Inflammatory bowel disease: clinical aspects and established and evolving therapies. Lancet. 2007;369: 1641–57. - PubMed
    1. Bernstein CN, Fried M, Krabshuis JH, Cohen H, Eliakim R, Fedail S, et al. World gastroenterology organization practice guidelines for the diagnosis and management of IBD in 2010. Inflamm Bowel Dis. 2010;16: 112–24. 10.1002/ibd.21048 - DOI - PubMed
    1. Baumgart DC, Carding SR. Inflammatory bowel disease: cause and immunobiology. Lancet. 2007;369: 1627–40. - PubMed

Publication types

Substances

LinkOut - more resources