. 2015 Sep 1;56(10):6144-61.
doi: 10.1167/iovs.15-16569.

Endothelin-Mediated Changes in Gene Expression in Isolated Purified Rat Retinal Ganglion Cells

Affiliations

Endothelin-Mediated Changes in Gene Expression in Isolated Purified Rat Retinal Ganglion Cells

Shaoqing He et al. Invest Ophthalmol Vis Sci. .

Abstract

Purpose: A growing body of evidence suggests that the vasoactive peptides endothelins (ETs) and their receptors (primarily the ETB receptor) are contributors to neurodegeneration in glaucoma. However, actions of ETs in retinal ganglion cells (RGCs) are not fully understood. The purpose of this study was to determine the effects of ETs on gene expression in primary RGCs.

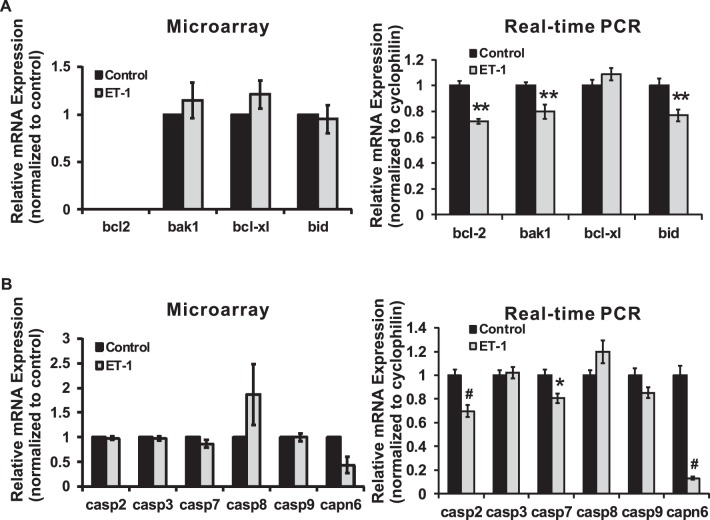
Methods: Primary RGCs isolated from rat pups were treated with 100 nM of ET-1, ET-2, or ET-3 for 24 hours. Total RNA was extracted followed by cDNA synthesis. Changes in gene expression in RGCs were detected using Affymetrix Rat Genome 230 2.0 microarray and categorized by DAVID analysis. Real-time PCR was used to validate gene expression, and immunocytochemistry and immunoblotting to confirm the protein expression of regulated genes.

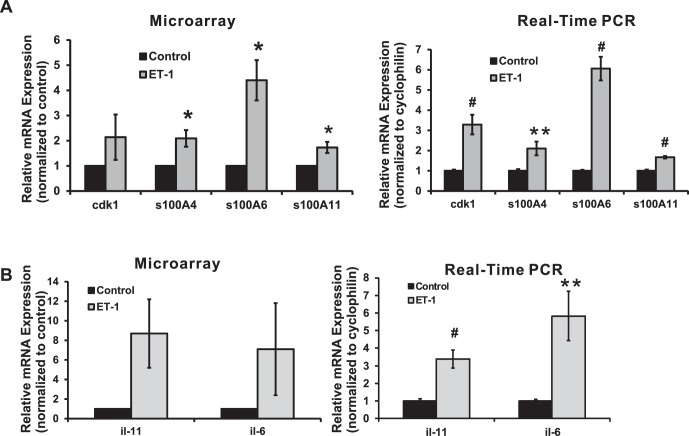
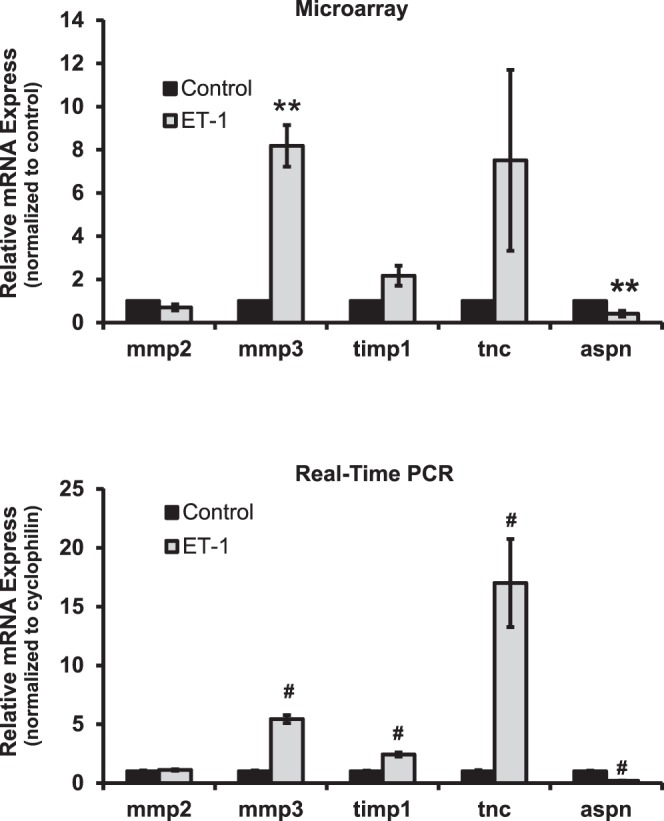
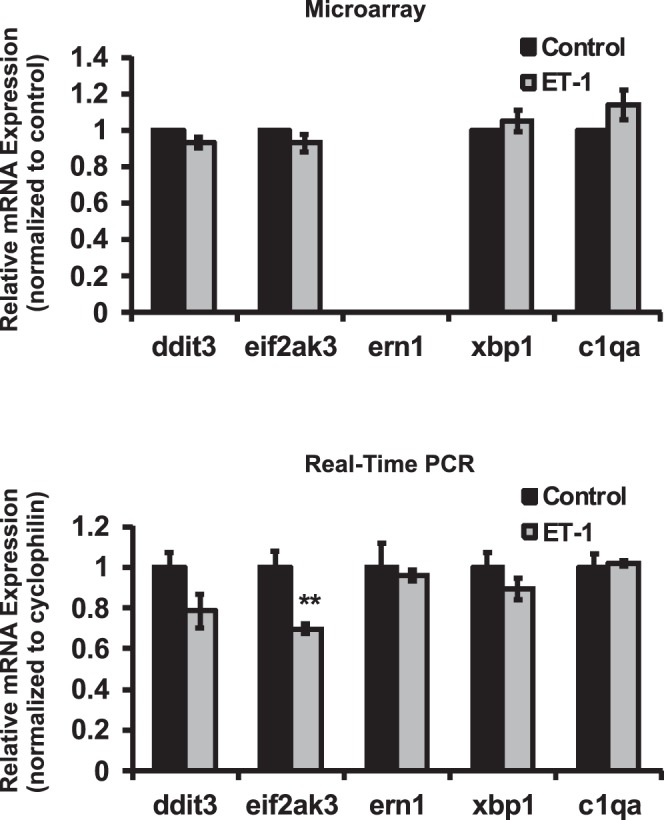
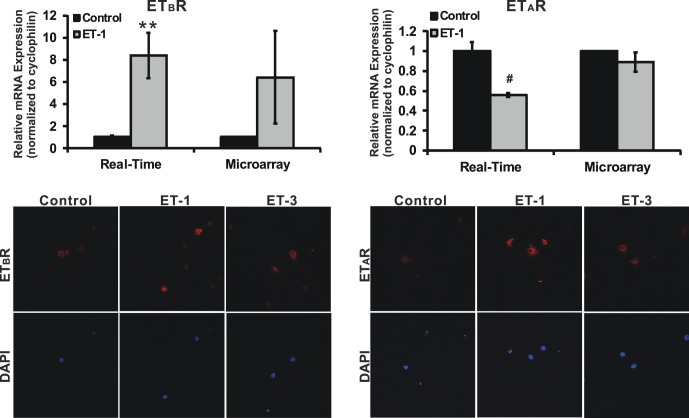
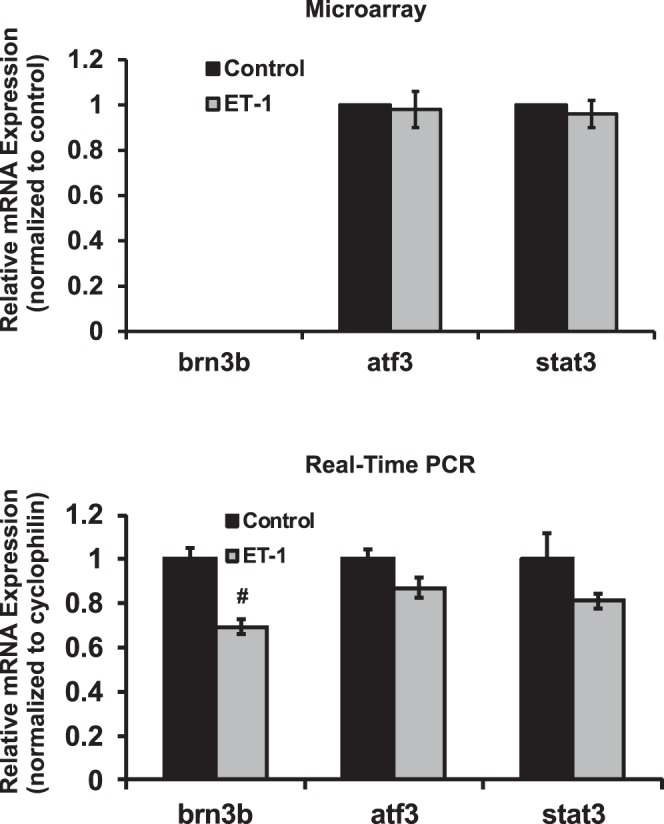
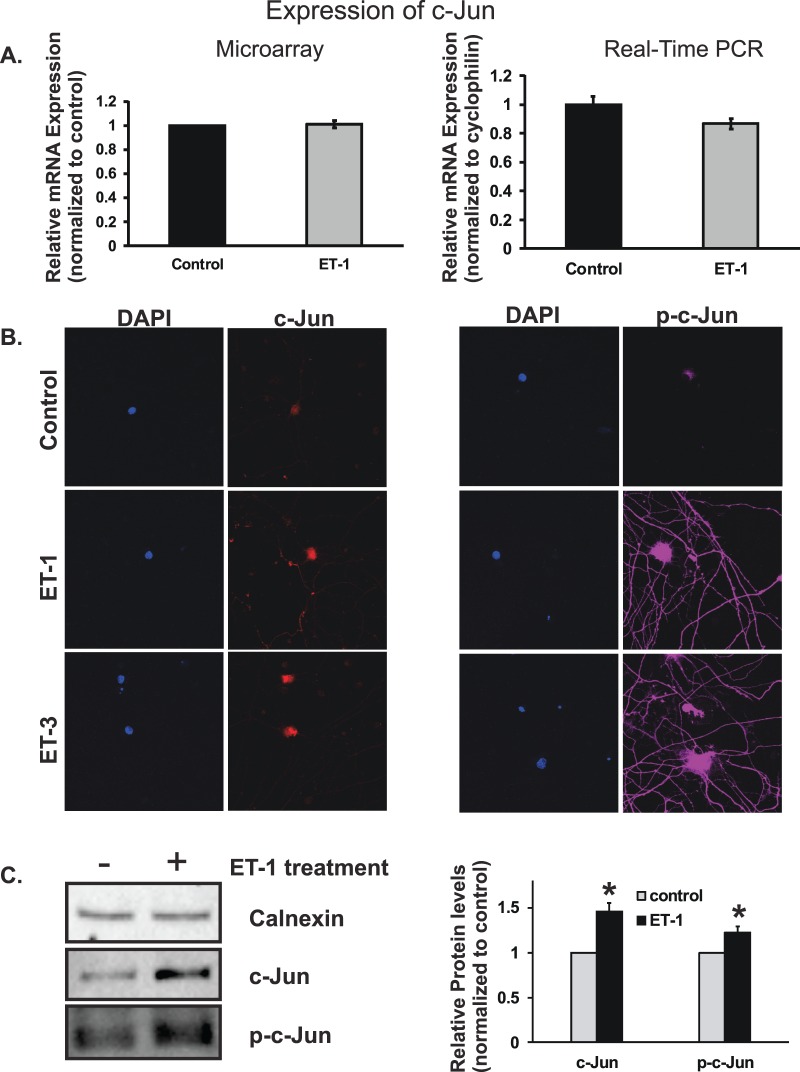
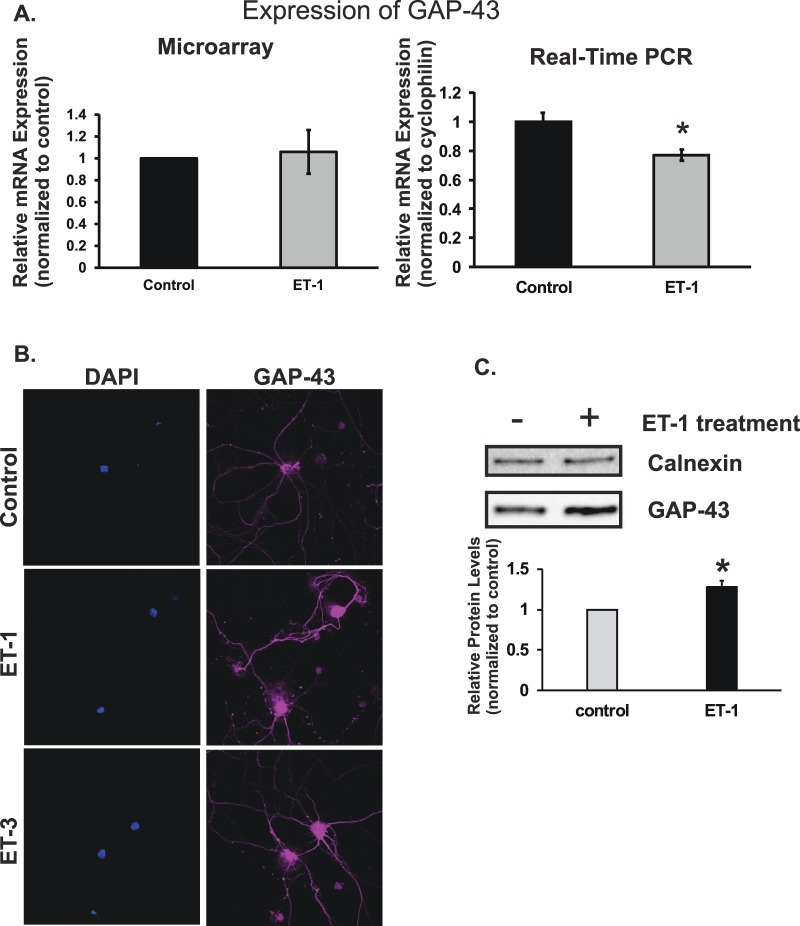
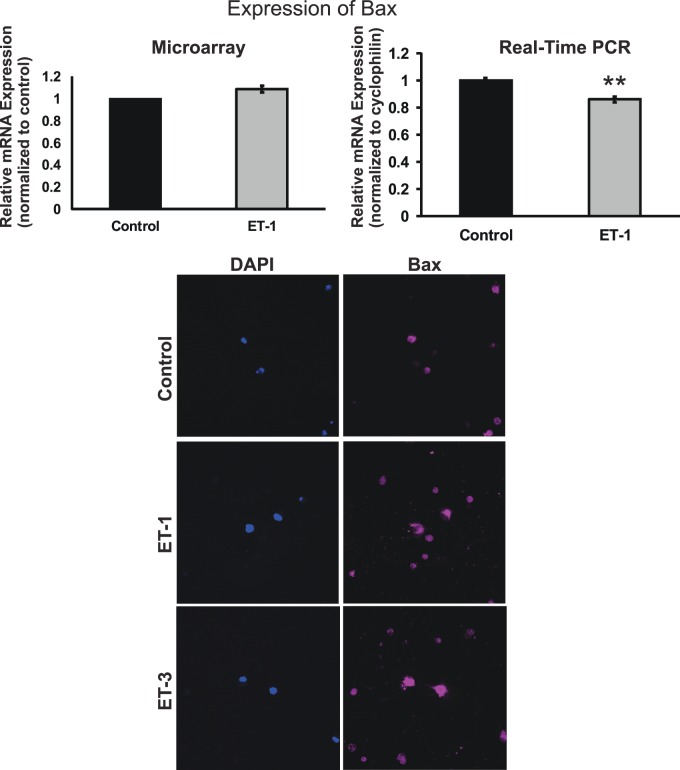
Results: There was more than 2-fold upregulation of 328, 378, or 372 genes, and downregulation of 48, 33, or 28 genes with ET-1, ET-2, or ET-3 treatment, respectively, compared to untreated controls. The Bcl-2 family, S100 family, matrix metalloproteinases, c-Jun, and ET receptors were the major genes or proteins that were regulated by endothelin treatment. Immunocytochemical staining revealed a significant increase in ETA receptor, ETB receptor, growth associated protein 43 (GAP-43), phosphorylated c-Jun, c-Jun, and Bax with ET-1 treatment. Protein levels of GAP-43 and c-Jun were confirmed by immunoblotting.

Conclusions: Expression of key proteins having regulatory roles in apoptosis, calcium homeostasis, cell signaling, and matrix remodeling were altered by treatment with endothelins. The elucidation of molecular mechanisms underlying endothelins' actions in RGCs will help understand endothelin-mediated neurodegenerative changes during ocular hypertension.


Figures

Figure 1
Figure 1
Calcium-associated genes, cdk1, and interleukins in response to ET-1 treatment in RGCs. Expression levels of genes were detected by microarray and real-time PCR using cDNA template synthesized from total RNA, which was extracted from RGCs following ET-1 treatment. (A) Expression of cdk1 and S100 family genes was detected by microarray and real-time PCR. An increased expression of 2.1-, 4.4-, and 1.7-fold in ET-1 treatment was detected in microarray for s100A4, s100A6, and s100A11, the same trend also was observed as an increase of 2.1-fold (n = 6, t-test, P = 0.01), 6.1-fold (n = 12, t-test, P ≤ 0.001), and 1.7-fold (n = 6, t-test, P ≤ 0.001) from real-time PCR, respectively (A). Statistical analysis was performed using t-test. (*P < 0.05, **P ≤ 0.01, #P ≤ 0.001). (B) Interleukin-6 and il-11 were detected by microarray and real-time PCR. Statistical analysis was performed using t-test. (*P < 0.05, **P ≤ 0.01, #P ≤ 0.001). Endothelin-1 treatment of RGC induced a 7.1- and 8.7-fold increase of il-6 and il-11 in microarray, although there was a large variation detected from three sets of data (B); real-time PCR confirmed this significant upregulation of mRNA level for il-6 and il-11 at 5.8- and 3.4-fold with t-test P < 0.01 (both with n = 12; relative mRNA levels (mean ± SEM) are represented in bar graph; in microarray, the vehicle control served as control; in real-time PCR, results were normalized to the expression of cyclophilin A, and values were compared to the vehicle-treated control cells).
Figure 2
Figure 2
Changes in expression of genes encoding extracellular matrix proteins in response to ET-1 treatment in RGCs. Expression of mmp2, mmp3, timp1, tnc, and aspn was detected by microarray and real-time PCR. There was no change detected in mRNA level of mmp2 in RGCs with ET-1 treatment from microarray and real-time PCR; however, a significant upregulation of mmp3 expression was detected in both assays (8.2-fold, n = 3 and 5.4-fold, n = 12, respectively) with ET-1 treatment. An appreciable 2.2-fold increase (P = 0.065, t-test, n = 3) of timp1 (an endogenous inhibitor of MMPs) was found by microarray, and a 2.4-fold increase (P < 0.001, t-test, n = 12) of timp1 was found in real-time PCR in RGCs treated with ET-1. The mRNA level of tnc in RGCs in response to ET-1 treatment was significantly upregulated to 7.5- and 17.0-fold in microarray and real-time PCR, respectively. There was a 2.4- and 5.3-fold decrease of mRNA of asporin (aspn) detected from microarray and real-time PCR after 24-hour treatment of ET-1 in RGCs. (mRNA levels [mean ± SEM] are represented in bar graph; in microarray, the vehicle-treated cells served as control; in real-time PCR, results were normalized to the expression of cyclophilin A, and values were compared to vehicle-treated control cells). Statistical analysis was performed using t-test (*P < 0.05, **P ≤ 0.01, #P ≤ 0.001).
Figure 3
Figure 3
Alterations in expression of ER-stress associated genes in RGCs treated with ET-1. Genes involved in ER stress pathways were determined by microarray and real-time PCR analysis. No appreciable changes of ddit3, eif2ak3, ern1, and xbp1 were detected at the mRNA level in ET-1–treated groups from microarray (no data of ern1 obtained from microarray). mRNA of ern1 and xbp1 also did not change in real-time PCR. However, ddit3 and eif2ak3 expression was decreased to 79% and 70% of control in real-time PCR. Only change of eif2ak3 in real-time PCR was statistically significant (0.005, n = 6, t-test). *P < 0.05, **P ≤ 0.01, #P ≤ 0.001; mRNA levels (mean ± SEM) are represented in bar graph; in microarray, the vehicle control served as control; in real-time PCR, results were normalized to the expression of cyclophilin A, and compared to vehicle-treated control cells.
Figure 4
Figure 4
Endothelin receptor expression in RGCs treated with ETs. mRNA and protein levels of ETB receptor and ETA receptor were investigated by microarray, real-time PCR, and immunocytochemistry. There was a 6.4-fold (n = 3) and 8.4-fold (n = 12) increase in mRNA of ETB receptor detected by microarray and real-time PCR respectively; however, there was either no change or a decrease to 56% of control (n = 9) in mRNA levels of ETA receptor in both assays. On the other hand, an enhanced staining of ETB receptor and ETA receptor was detected in RGCs treated with ET-1 or ET-3 compared to untreated controls. The staining of ETA and ETB receptors was detected mainly in soma of RGC cells. t-test, *P < 0.05, **P ≤ 0.01, #P ≤ 0.001; mRNA levels (mean ± SEM) are represented in bar graph; in microarray, the vehicle control served as normalization control; in real-time PCR, results were normalized to the expression of cyclophilin A, and values were compared to vehicle-treated control cells.
Figure 5
Figure 5
Expression of transcription factors brn3b, atf3 and stat3 in RGCs treated with ET-1. ET-1 treatment in RGCs decreased the expression of brn-3b to 70% of control in real-time PCR (P < 0.001, n = 6, t-test) and no data were obtained for brn-3b because of no hybridization oligos in microarray chip. There were no significant changes of atf3 and stat3 detected in ET-1–treated RGCs using microarray. *P < 0.05, **P ≤ 0.01, #P ≤ 0.001; mRNA levels (mean ± SEM) are represented in bar graph; in microarray, the vehicle control served as normalization control; in real-time PCR, results were normalized to the expression of cyclophilin A, and then compared to vehicle-treated control cells.
Figure 6
Figure 6
Messenger RNA and protein levels of c-Jun in RGCs treated with ET-1. Microarray, real-time PCR, and immunocytochemistry were used to determine mRNA and protein levels of c-Jun. c-Jun mRNA was not changed in RGC cells treated with ET-1 in microarray assay, even decreased in real-time PCR without statistical significance (A). Staining of c-Jun was increased in RGC cells treated with 100 nM ET-1 or ET-3 for 24 hours, and the staining was detected mainly in soma of RGCs (B). An enhanced staining of phosphorylated c-Jun (p-c-Jun) also was detected in RGCs treated ET-1 or ET-3, the staining was observed not only in the soma of RGC, but also in the neurites. There was no appreciable difference in the staining intensity for c-Jun and p-c-Jun between ET-1 and ET-3 treatments (*P < 0.05, **P < 0.01, #P < 0.001). The increased protein levels of c-Jun and p-c-Jun in response to ET-1 treatment in RGCs also was confirmed using immunoblotting and bar graph represents the densitometric analysis of the specific bands of c-Jun (n = 5, P < 0.05, t-test) and p-c-Jun (n = 3, P < 0.05, t-test; C). mRNA levels (mean ± SEM) are represented in bar graph; in microarray, the vehicle control served as normalization control; in real-time PCR, the data were normalized to the expression of cyclophilin A, and then the vehicle-treated cells served as control.
Figure 7
Figure 7
Levels of GAP-43 in response to ET-1 treatment; GAP-43 mRNA levels in RGCs treated with ET-1 were unchanged in microarray analysis and decreased to 77% of control by real-time PCR, respectively (A). The decrease of mRNA expression in ET-1 treatment detected by real-time PCR was statistically significant (P < 0.05, n = 6, t-test). Levels of GAP-43 protein tested by immunohistochemistry showed the higher intensity of staining in RGCs treated with ET-1 and ET-3 compared to vehicle control, and the enhanced staining was observed in somas and neurites (*P < 0.05, **P < 0.01, #P < 0.001, t-test; B). Endothelin-1–mediated upregulation of GAP-43 protein in RGCs was confirmed using immunoblotting and the densitometry analysis of the specific bands of GAP-43 was represented as bar graph (n = 4, P < 0.01, t-test, C). Messenger RNA levels (mean ± SEM) are represented in bar graph; in microarray, the vehicle control served as control; in real-time PCR, results were normalized to the expression of cyclophilin A, and compared to vehicle-treated control cells.
Figure 8
Figure 8
Messenger RNA and protein levels of Bax in RGCs. There was no change in the mRNA levels of bax detected in ET-1–treated RGCs from microarray, but a decrease to 86% of control was observed in ET-1–treated RGCs by real-time PCR, which was statistically significant (P = 0.001, t-test, n = 6). Endothelin-1 or ET-3 treatment in RGC boosted the protein level of Bax, the staining intensity of Bax was higher in ET-treated group compared to control (*P < 0.05, **P < 0.01, #P < 0.001); mRNA levels (mean ± SEM) are represented in bar graph; in microarray, the vehicle control served as control; in real-time PCR, results were normalized to the expression of cyclophilin A, and values were compared to vehicle-treated control cells.
Figure 9
Figure 9
Endothelin-1 mediated changes in expression of members of the Bcl-2 and caspase gene family. Endothelin-1 treatment of RGCs induced a significant decrease in the mRNA levels of bcl-2, bak1, and bid (P < 0.01, t-test, n = 3–6) determined by real-time PCR (A). A downregulation of mRNA expression of casp2 and casp7 was found by real-time PCR in RGCs treated with ET-1, which was statistically significant (B). Expression of capn6 was downregulated in ET-1–treated RGCs determined by microarray analysis, and the same trend also was detected in real-time PCR. Messenger RNA level of capn6 in ET-1 treatment in real-time was 12.9% of control (P < 0.001, t-test, n = 9 [B]). *P < 0.05, **P < 0.01, #P < 0.001; mRNA levels (mean ± SEM) are represented in bar graph; in microarray, the vehicle control served as control; in real-time PCR, results were normalized to the expression of cyclophilin A, and compared to vehicle-treated control cells.

Similar articles

Cited by

References

    1. Sokolovsky M. Endothelin receptor subtypes and their role in transmembrane signaling mechanisms. Pharmacol Ther. 1995; 68: 435–471. - PubMed
    1. Noske Whensen J Wiederholt M. Endothelin-like immunoreactivity in aqueous humor of patients with primary open-angle glaucoma and cataract. Graefes Arch Clin Exp Ophthalmol. 1997; 235: 551–552. - PubMed
    1. Tezel G,, Kass M,, Kolker A,, Becker B,, Wax M. Plasma and aqueous humor endothelin levels in primary open-angle glaucoma. J Glaucoma. 1997. ; 6: 83–89. - PubMed
    1. Kallberg ME,, Brooks DE,, Garcia-Sanchez GA,, Komaromy AM,, Szabo NJ,, Tian L. Endothelin 1 Levels in the aqueous humor of dogs with glaucoma. J Glaucoma. 2002; 11: 105–109. - PubMed
    1. Prasanna G,, Hulet C,, Desai D,, et al. Effect of elevated intraocular pressure on endothelin-1 in a rat model of glaucoma. Pharmacol Res. 2005. ; 51: 41–50. - PubMed

Publication types