. 2015 Nov;8(11):1467-78.
doi: 10.1242/dmm.021238. Epub 2015 Aug 20.

A gene expression resource generated by genome-wide lacZ profiling in the mouse

Affiliations

A gene expression resource generated by genome-wide lacZ profiling in the mouse

Elizabeth Tuck et al. Dis Model Mech. 2015 Nov.

Abstract

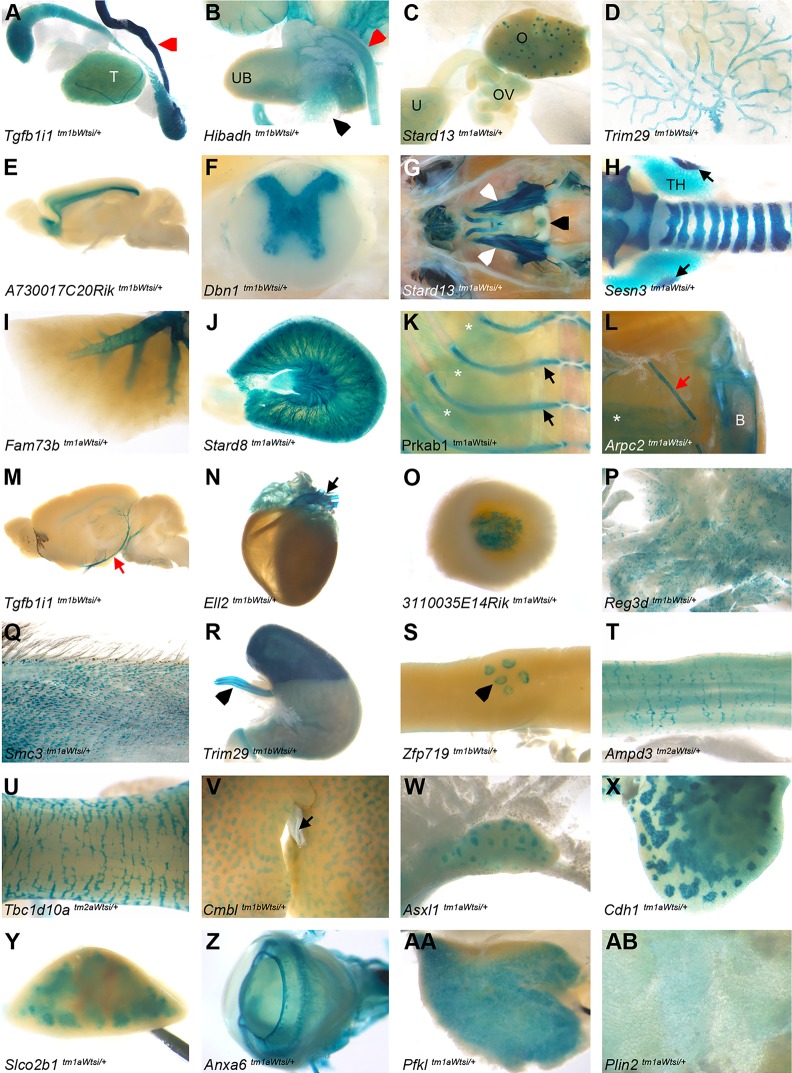
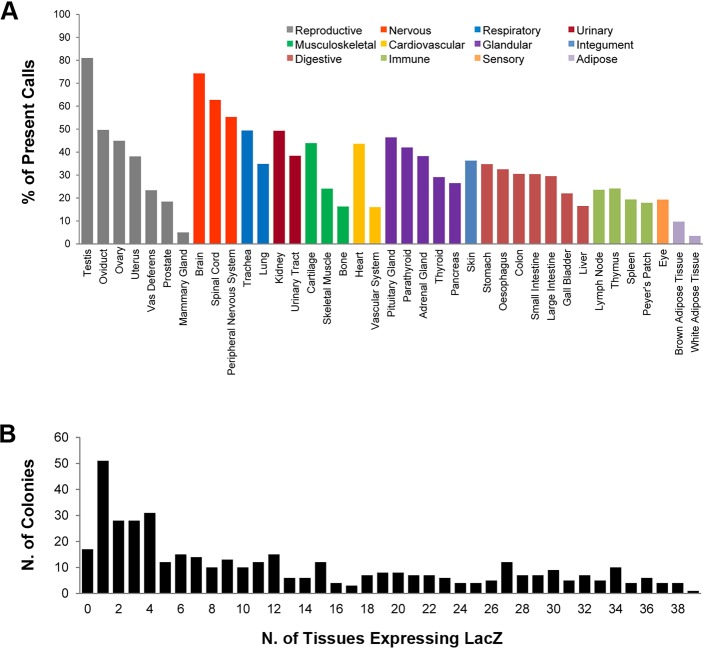
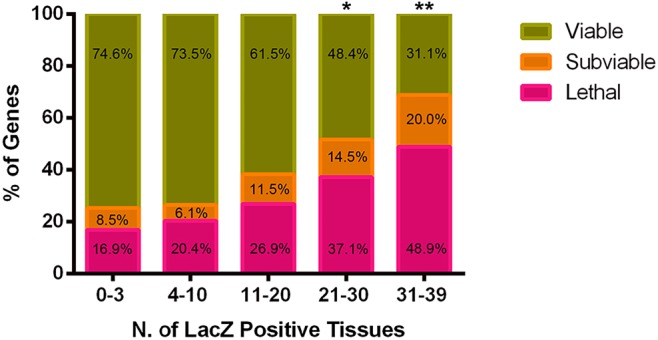
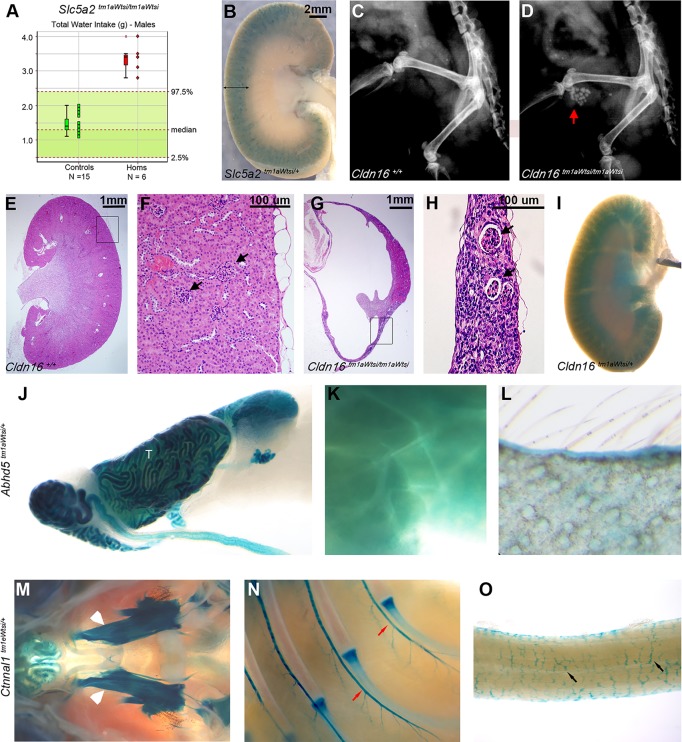
Knowledge of the expression profile of a gene is a critical piece of information required to build an understanding of the normal and essential functions of that gene and any role it may play in the development or progression of disease. High-throughput, large-scale efforts are on-going internationally to characterise reporter-tagged knockout mouse lines. As part of that effort, we report an open access adult mouse expression resource, in which the expression profile of 424 genes has been assessed in up to 47 different organs, tissues and sub-structures using a lacZ reporter gene. Many specific and informative expression patterns were noted. Expression was most commonly observed in the testis and brain and was most restricted in white adipose tissue and mammary gland. Over half of the assessed genes presented with an absent or localised expression pattern (categorised as 0-10 positive structures). A link between complexity of expression profile and viability of homozygous null animals was observed; inactivation of genes expressed in ≥ 21 structures was more likely to result in reduced viability by postnatal day 14 compared with more restricted expression profiles. For validation purposes, this mouse expression resource was compared with Bgee, a federated composite of RNA-based expression data sets. Strong agreement was observed, indicating a high degree of specificity in our data. Furthermore, there were 1207 observations of expression of a particular gene in an anatomical structure where Bgee had no data, indicating a large amount of novelty in our data set. Examples of expression data corroborating and extending genotype-phenotype associations and supporting disease gene candidacy are presented to demonstrate the potential of this powerful resource.

Keywords: Gene expression; Mouse; Resource; lacZ reporter.


Conflict of interest statement

Competing interests

The authors declare no competing or financial interests.

Figures

Fig. 1.
Fig. 1.
The endogenous expression pattern of each gene was assessed in up to 47 tissues. lacZ reporter gene whole-mount analysis was performed to ascertain the expression profile of each gene of interest. Examples are presented of expression in each of the entities annotated. The genotype is stated for each panel. (A) Testis (T); epididymis was excluded because of endogenous background staining. (B) Male urogenital system with prostate (black arrowhead) and urinary tract staining on the urinary bladder (UB). (A,B) Vas deferens (red arrowhead). (C) Female reproductive system with the ovary (O), oviduct (OV) and uterus (U). (D) Mammary gland. (E) Brain (inner cerebral cortex; see Fig. 3 for expression in other annotated brain sub-structures). (F) Spinal cord grey matter. (G) Cranial cavity including the pituitary (black arrowhead) and peripheral nerve (trigeminal ganglia) staining (white arrowheads). (H) Trachea, thyroid (TH) and parathyroid glands (arrows). (I) Lung. (J) Kidney. (K) Cartilaginous rib (black arrows). (K,L) Skeletal muscle (asterisks). (L) Hindlimb with bone staining (B) on the tibia. (L,M) Vascular staining on blood vessels (red arrow). (N) Heart and aorta (arrow). (O) Adrenal medulla. (P) Pancreas. (Q) Skin. (R) Stomach and oesophagus (arrowhead). (S) Small intestine and Peyer's patches (arrowhead). (T) Large intestine. (U) Colon. (V) Liver and gall bladder (arrow). (W) Mesenteric lymph nodes. (X) Thymus. (Y) Spleen. (Z) Eye. (AA) Brown adipose tissue. (AB) White adipose tissue.
Fig. 2.
Fig. 2.
Distribution and extent of expression. (A) The relative percentage of genes for which lacZ reporter gene expression was detected for each of the 39 standard tissues, grouped by system. The percentage was calculated based on 424 genes, excluding instances of no data (Table S1). (B) For each gene, the total number of lacZ reporter-positive tissues is presented. The most common profile was expression in a single tissue (51 lines), and over half of the lines assessed (54.0%) presented with an absent or localised expression pattern (0-10 tissues).
Fig. 3.
Fig. 3.
The granularity of annotation was extended in the brain. (A) The percentage of genes for which lacZ reporter gene expression was detected in the brain, spinal cord, peripheral nervous system and seven selected brain sub-structures. The percentage was calculated based on the subset of 125 genes for which the extended brain annotation was performed (Table S1). (B-G) Examples of expression patterns in the brain included the following: (B) ubiquitous expression of Slc25a28; (C,E) olfactory lobe, cerebral cortex, hippocampus, striatum, hypothalamus, cerebellum and brainstem expression of Dpm1 (C) and Ankrd6 (E); (D) olfactory lobe, cerebral cortex, hippocampus, hypothalamus, cerebellum and brainstem expression of Medag; (F) cerebral cortex, hippocampus and brainstem expression of 3110035E14Rik; and (G) olfactory lobe, cerebral cortex and striatum expression of Kcnh4. Olfactory lobe (OL), cerebral cortex (CC), hippocampus (HPC), striatum (STR), hypothalamus (HY), cerebellum (CB) and brainstem (BS). Scale bar: 2 mm.
Fig. 4.
Fig. 4.
Demonstration of additional granularity within the image resource. The pattern of expression within each structure was not routinely annotated. Examples are presented of different classes of expression pattern found in lung, liver and ovary. The genotype is stated for each panel. In the lung examples (A-C), primary bronchi (white arrowhead), pulmonary bronchi (red arrowhead) and terminal bronchiole (black arrowhead) sub-structures are indicated. In the liver (D-F), the gall bladder is labelled (GB). (D) Diffuse expression throughout the liver. (E) Expression in portal areas delineates the classic portal lobules. (F) Specific expression in the GB, with punctate expression in the liver parenchyma that we speculate corresponds to biliary structures/ductules. In the ovary (G,H,I), the corpora lutea are labelled (CL). (G) Diffuse expression excluding the CL. (H) Selective expression in CL. (I) Selective expression in the ova within the ovarian follicles (black arrow).
Fig. 5.
Fig. 5.
The complexity of expression profile relates to homozygous viability. For each gene, the total number of lacZ reporter-positive tissues was calculated and grouped into one of five categories (0-3, 4-10, 11-20, 21-30 and 31-39 positive structures). Within each category, the percentage of genes for which homozygous mice were lethal, subviable and viable at postnatal day 14 (Table S3) is presented. Fisher's exact test was used to compare the ratio of outcomes in the 0-3 group with each of the other groups (*P<0.001; **P<0.0001).
Fig. 6.
Fig. 6.
Expression data confirm and extend existing knowledge. lacZ reporter gene expression in Sgol2tm1aWtsi/+ mice in the following tissues: (A) testis (T); (B) ovary (black arrows); (C) Peyer's patches (black arrowhead); and (D) mesenteric lymph node (red arrows). (E,F) Expression in Apootm1bWtsi/Y mice in heart (E) and pancreas (F).
Fig. 7.
Fig. 7.
Expression data inform genotype-phenotype associations. (A) Increased water intake of Slc5a2tm1aWTsi/tm1aWTsi males (n=6; red symbols) over a 21 h interval compared with local controls (n=15; green symbols) and the 95% reference range (n=656). Each mouse is represented as a single symbol on the graph. Median, 25th and 75th percentiles (box) and the lowest and highest data point still within 1.5× the interquartile range (whiskers) are shown. (B) lacZ reporter gene expression in Sgol2tm1aWtsi/+ mice in kidney cortex (scale bar: 2 mm). (C,D) Urolithiasis (red arrow) shown by X-ray in all Cldn16tm1aWtsi/tm1aWtsi males (n=7; D) compared with wild-type controls (C). (G,H) Histopathology showed hydronephrosis in both sexes [glomeruli, black arrows; scale bar: 1 mm (G) and 100 μm (H)] compared with wild type (E,F). lacZ reporter gene expression in the following tissues: (I) kidney cortex of Cldn16tm1aWtsi/+ mice; testis (T; J), brown adipose tissue (K) and skin (L) of Abhd5tm1aWtsi/+ mice; and trigeminal ganglia (white arrowheads; M), intercostal nerves (red arrows; N) and enteric nervous system (black arrows; O) of the large intestine of Ctnnal1tm1eWtsi/+ mice.

Comment in

References

    1. Adams N. C. and Gale N. W. (2006). High resolution gene expression analysis in mice using genetically inserted reporter genes. In Principle and Practice Mammalian and Avian Transgenesis - New Approaches (ed. Pease S. and Lois C.), pp. 132-172. Springer.
    1. Adissu H. A., Estabel J., Sunter D., Tuck E., Hooks Y., Carragher D. M., Clarke K., Karp N. A., Sanger Mouse Genetics Project, Newbigging S. et al. (2014). Histopathology reveals correlative and unique phenotypes in a high-throughput mouse phenotyping screen. Dis. Model. Mech. 7, 515-524. 10.1242/dmm.015263 - DOI - PMC - PubMed
    1. Angelini C., Philippart M., Borrone C., Bresolin N., Cantini M. and Lucke S. (1980). Multisystem triglyceride storage disorder with impaired long-chain fatty acid oxidation. Ann. Neurol. 7, 5-10. 10.1002/ana.410070104 - DOI - PubMed
    1. Bassett J. H. D., Gogakos A., White J. K., Evans H., Jacques R. M., van der Spek A. H., Sanger Mouse Genetics Project, Ramirez-Solis R., Ryder E., Sunter D. et al. (2012). Rapid-throughput skeletal phenotyping of 100 knockout mice identifies 9 new genes that determine bone strength. PLoS Genet. 8, e1002858 10.1371/journal.pgen.1002858 - DOI - PMC - PubMed
    1. Bastian F., Parmentier G., Roux J., Moretti S., Laudet V. and Robinson-Rechavi M. (2008). Bgee: integrating and comparing heterogeneous transcriptome data among species. In Data Integration in the Life Sciences (ed. Bairoch, Amos; Cohen-Boulakia, Sarah; Froidevaux, Christine), pp. 124-131. Berlin; Heidelberg: Springer.

Publication types