. 2015 Nov;8(11):1457-66.
doi: 10.1242/dmm.022525. Epub 2015 Sep 17.

Hyperactivity and attention deficits in mice with decreased levels of stress-inducible phosphoprotein 1 (STIP1)

Affiliations

Hyperactivity and attention deficits in mice with decreased levels of stress-inducible phosphoprotein 1 (STIP1)

Flavio H Beraldo et al. Dis Model Mech. 2015 Nov.

Abstract

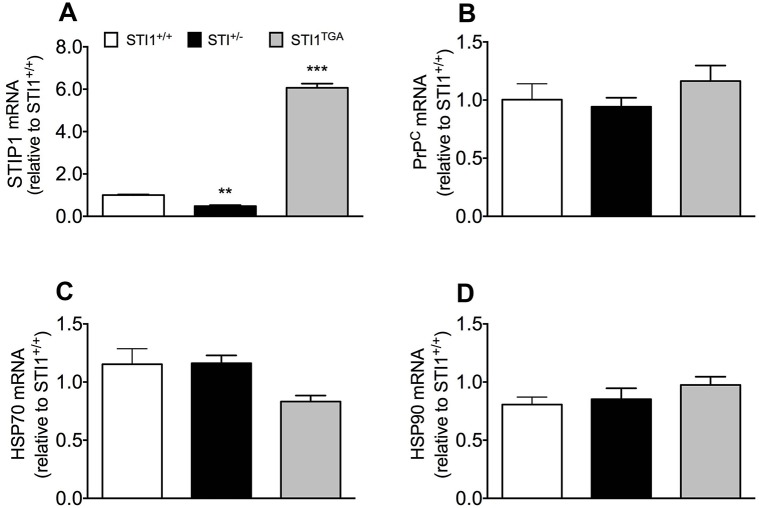
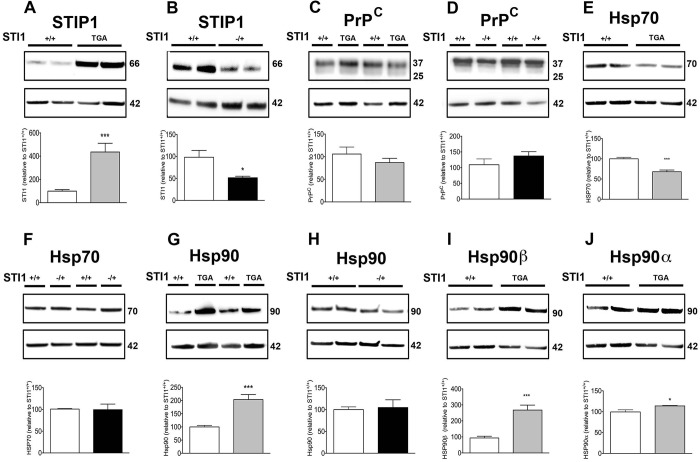
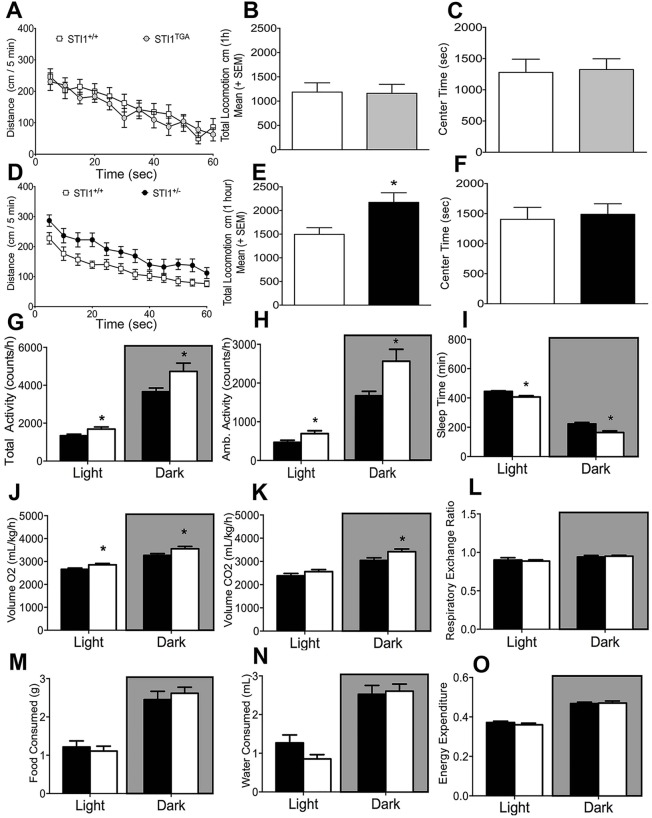
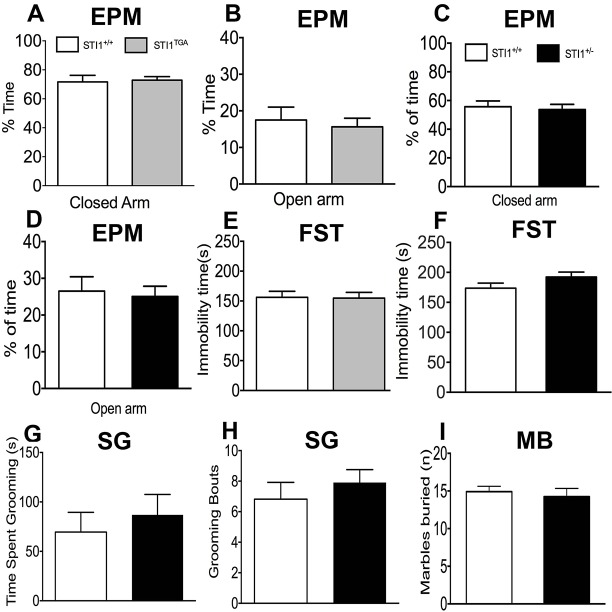
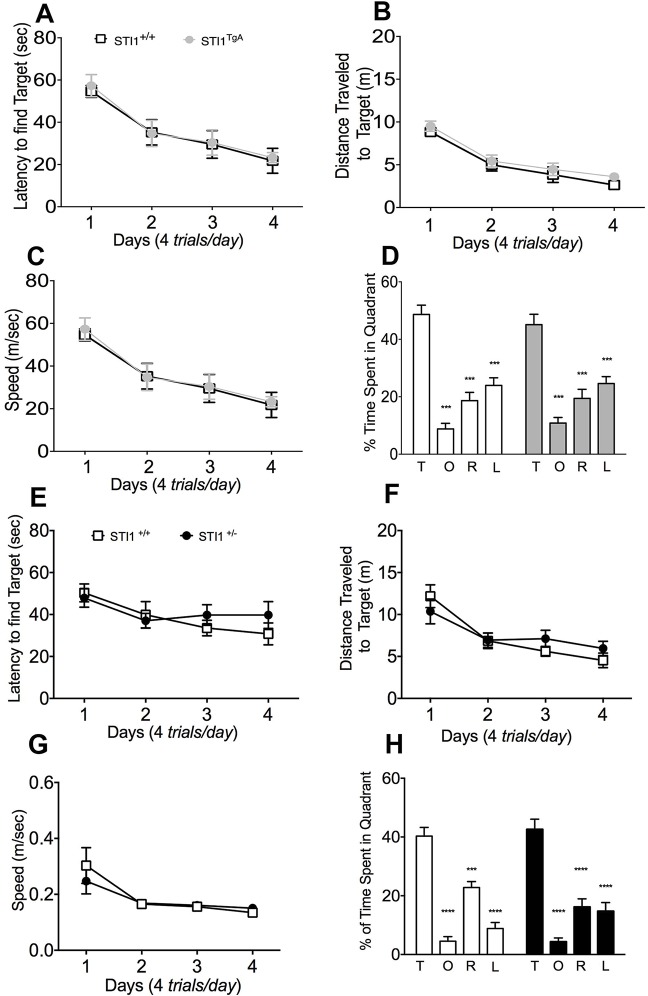
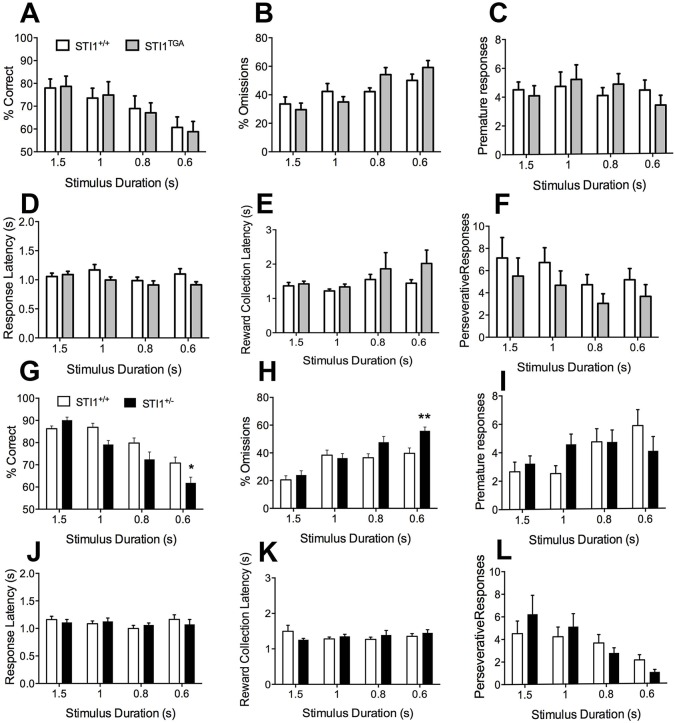
Stress-inducible phosphoprotein I (STIP1, STI1 or HOP) is a co-chaperone intermediating Hsp70/Hsp90 exchange of client proteins, but it can also be secreted to trigger prion protein-mediated neuronal signaling. Some mothers of children with autism spectrum disorders (ASD) present antibodies against certain brain proteins, including antibodies against STIP1. Maternal antibodies can cross the fetus blood-brain barrier during pregnancy, suggesting the possibility that they can interfere with STIP1 levels and, presumably, functions. However, it is currently unknown whether abnormal levels of STIP1 have any impact in ASD-related behavior. Here, we used mice with reduced (50%) or increased STIP1 levels (fivefold) to test for potential ASD-like phenotypes. We found that increased STIP1 regulates the abundance of Hsp70 and Hsp90, whereas reduced STIP1 does not affect Hsp70, Hsp90 or the prion protein. Interestingly, BAC transgenic mice presenting fivefold more STIP1 show no major phenotype when examined in a series of behavioral tasks, including locomotor activity, elevated plus maze, Morris water maze and five-choice serial reaction time task (5-CSRTT). In contrast, mice with reduced STIP1 levels are hyperactive and have attentional deficits on the 5-CSRTT, but exhibit normal performance for the other tasks. We conclude that reduced STIP1 levels can contribute to phenotypes related to ASD. However, future experiments are needed to define whether it is decreased chaperone capacity or impaired prion protein signaling that contributes to these phenotypes.

Keywords: ASD; Attention deficits; Autism; BAC; Mouse model; Stress-inducible phosphoprotein 1; Touchscreen.


Conflict of interest statement

Competing interests

The authors declare no competing or financial interests.

Figures

Fig. 1.
Fig. 1.
Analyses of mRNA for STIP1 partners in STI1+/+, STI1−/+ and STI1TGA mouse brains. (A) STIP1 mRNA expression (n=9 STI1+/+, n=5 STI1TGA and n=4 STI1−/+). (B) PrPC mRNA expression (n=8 STI1+/+, n=4 STI1TGA and n=7 STI1−/+). (C) Hsp70 mRNA expression (n=8 STI1+/+, n=4 STI1TGA and n=7 STI1−/+). (D) Hsp90 mRNA expression (n=3 STI1+/+, n=4 STI1TGA and n=4 STI1−/+). Results are presented as means±s.e.m.; data were analyzed and compared by one-way ANOVA and Bonferroni multiple comparisons post-hoc test; **P<0.001 and ***P<0.0001 compared with control.
Fig. 2.
Fig. 2.
Analyses of protein levels for STIP1 partners in STI1+/+, STI−/+ and STI1TGA mouse brains. (A,B) STIP1 expression in STI1TGA (n=9 STI1+/+ and n=8 STI1TGA) and STI1−/+ mice (n=8 STI1+/+ and n=8 STI1−/+). (C,D) PrPC expression in STI1TGA (n=6 STI1+/+ and n=6 STI1TGA) and STI1−/+ mice (n=6 STI1+/+ and n=9 STI1−/+). (E,F) Hsp70 expression in STI1TGA (n=5 STI1+/+ and n=4 STI1TGA) and STI1−/+ mice (n=5 STI1+/+ and n=4 STI1−/+). (G,H) HSP90 expression in STI1TGA (n=10 STI1+/+ and n=14 STI1TGA) and STI1−/+ mice (n=6 STI1+/+ and n=6 STI1−/+). (I,J) Hsp90β (n=10 STI1+/+ and n=8 STI1TGA) and Hsp90α (n=5 STI1+/+ and n=4 STI1TGA) in STI1TGA mice. Results are presented as means±s.e.m.; data were analyzed and compared by Student's t-test; *P<0.05 and ***P<0.0001 compared with control.
Fig. 3.
Fig. 3.
Locomotor activity in STI1TGA and STI1−/+mice and metabolic analyses in STI1−/+mice. (A) Horizontal locomotor activity in an open-field for STI1TGA (n=14) and STI+/+ control mice (n=14). (B) Cumulative 1 h locomotion for STI1TGA (n=14) and STI+/+ control mice (n=14). (C) Time spent in the center of the locomotion boxes for STI1TGA (n=14) and STI+/+ control mice (n=14). (D) Horizontal locomotor activity in an open-field for STI1−/+ (n=8) and STI+/+ control mice (n=8). (E) Cumulative 1 h locomotion for STI1−/+ (n=22) and STI+/+ control mice (n=24). (F) Time spent in the center of the locomotion boxes for STI1−/+ (n=22) and STI+/+ control mice (n=24). (G) Total activity in metabolic cages for STI1−/+ (n=8) and STI+/+ control mice (n=8). (H) Ambulatory activity in metabolic cages for STI1−/+ (n=8) and STI+/+ control mice (n=8). (I) Sleep time for STI1−/+ (n=8) and STI+/+ control mice (n=8). (J) VO2 for STI1−/+ (n=8) and STI+/+ control mice (n=8). (K) VCO2 for STI1−/+ (n=8) and STI+/+ control mice (n=8). (L) Respiratory exchange ratio for STI1−/+ (n=8) and STI+/+ control mice (n=8). (M) Food consumption for STI1−/+ (n=8) and STI+/+ control mice (n=8). (N) Water consumption for STI1−/+ (n=8) and STI+/+ control mice (n=8). (O) Energy expenditure for STI1−/+ (n=8) and STI+/+ control mice (n=8). Results are presented as means±s.e.m.; data were analyzed and compared by Student's t-test; *P<0.05 compared with control.
Fig. 4.
Fig. 4.
Anxiety-like behavior, depression-like behavior, social behavior and compulsivity in STI1TGA and STI1−/+ mice. (A) Percentage of time spent in the closed arm for STI1TGA (n=17) and control mice (n=14). (B) Percentage of time spent in the open arm for STI1TGA (n=17) and control mice (n=14). (C) Percentage of time spent in the closed arm for STI1−/+ (n=13) and control mice (n=10). (D) Percentage of time spent in the open arm for STI1−/+ (n=13) and control mice (n=10). (E) Immobility time in the forced-swimming test for STI1TGA (n=17) and control mice (n=14). (F) Immobility time in the forced-swimming test for STI1−/+ (n=6) and control mice (n=8). (G,H) Time spent grooming and number of grooming bouts for STI1−/+ (n=11) and control mice (n=11). (I) Marbles buried by STI1−/+ (n=12) and control mice (n=12).
Fig. 5.
Fig. 5.
Spatial memory in STI1TGA and STI1−/+ mice. For the tests, n=14 STI1+/+ and 14 STI1TGA mice were used to test spatial memory in STI1TGA mice and n=11 STI1+/+ and 11 STI1−/+ for STI1−/+ mice. (A) Latency to find the platform. (B) Distance traveled. (C) Speed for STI1TGA mice. (D) Percentage time spent by STI1TGA mice and controls in target quadrant (T) and in opposite (O), right (R) and left (L) quadrants was measured on day 5 in a 60 s probe trial with the platform removed. (E) Latency to find the platform. (F) Distance traveled. (G) Speed for STI1−/+ mice. (H) Percentage time spent by STI1−/+ mice and controls in each quadrant was measured on day 5 in a 60 s probe trial with the platform removed. Results are presented as means±s.e.m.; data were analyzed and compared by two-way ANOVA; ***P<0.001 and ****P<0.0001 compared with time spent in target quadrant.
Fig. 6.
Fig. 6.
Five-choice serial reaction time task used to measure attention in STI1TGA and STI1−/+. For the tests, n=10 STI1+/+ and 10 STI1TGA mice were used to test attention in STI1TGA mice and n=13 STI1+/+ and 13 STI1−/+ for STI1−/+ mice. (A) Accuracy during probe trial sessions. (B) Rate of omission. (C) Premature responses. (D) Response latency. (E) Reward collection latency. (F) Perseverative responses for STI1TGA mice. (G) Accuracy during probe trial sessions. (H) Rate of omission. (I) Premature responses. (J) Response latency. (K) Reward collection latency. (L) Perseverative response for STI1−/+ mice. Results are presented as means±s.e.m.; data were analyzed and compared by RM-ANOVA; *P<0.05, **P<0.001 compared with control.

References

    1. Abbas-Terki T., Briand P.-A., Donze O. and Picard D. (2002). The Hsp90 co-chaperones Cdc37 and Sti1 interact physically and genetically. Biol. Chem. 383, 1335-1342. 10.1515/BC.2002.152 - DOI - PubMed
    1. Bauman M. D., Iosif A.-M., Ashwood P., Braunschweig D., Lee A., Schumann C. M., Van de Water J. and Amaral D. G. (2013). Maternal antibodies from mothers of children with autism alter brain growth and social behavior development in the rhesus monkey. Transl. Psychiatry 3, e278 10.1038/tp.2013.47 - DOI - PMC - PubMed
    1. Beraldo F. H., Arantes C. P., Santos T. G., Queiroz N. G. T., Young K., Rylett R. J., Markus R. P., Prado M. A. M. and Martins V. R. (2010). Role of alpha7 nicotinic acetylcholine receptor in calcium signaling induced by prion protein interaction with stress-inducible protein 1. J. Biol. Chem. 285, 36542-36550. 10.1074/jbc.M110.157263 - DOI - PMC - PubMed
    1. Beraldo F. H., Soares I. N., Goncalves D. F., Fan J., Thomas A. A., Santos T. G., Mohammad A. H., Roffe M., Calder M. D., Nikolova S. et al. (2013). Stress-inducible phosphoprotein 1 has unique cochaperone activity during development and regulates cellular response to ischemia via the prion protein. FASEB J. 27, 3594-3607. 10.1096/fj.13-232280 - DOI - PubMed
    1. Braunschweig D., Duncanson P., Boyce R., Hansen R., Ashwood P., Pessah I. N., Hertz-Picciotto I. and Van de Water J. (2012a). Behavioral correlates of maternal antibody status among children with autism. J. Autism Dev. Disord. 42, 1435-1445. 10.1007/s10803-011-1378-7 - DOI - PMC - PubMed

Publication types

MeSH terms