. 2015 Sep 23:13:242.
doi: 10.1186/s12916-015-0462-9.

Metabolomic profiles of hepatocellular carcinoma in a European prospective cohort

Affiliations

Metabolomic profiles of hepatocellular carcinoma in a European prospective cohort

Anne Fages et al. BMC Med. .

Abstract

Background: Hepatocellular carcinoma (HCC), the most prevalent form of liver cancer, is difficult to diagnose and has limited treatment options with a low survival rate. Aside from a few key risk factors, such as hepatitis, high alcohol consumption, smoking, obesity, and diabetes, there is incomplete etiologic understanding of the disease and little progress in identification of early risk biomarkers.

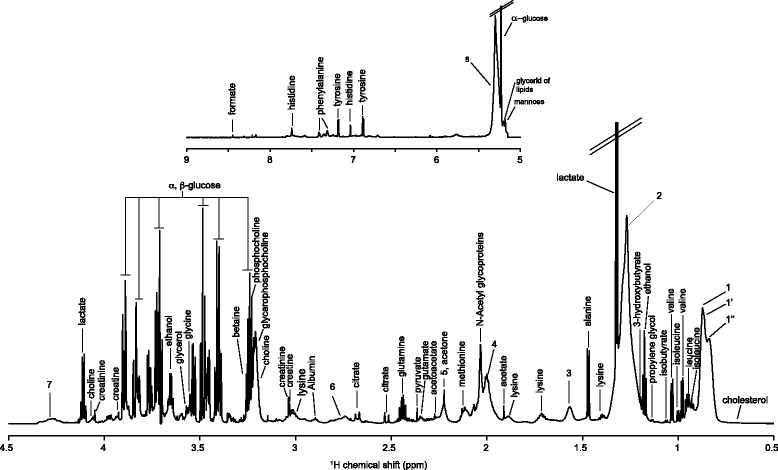
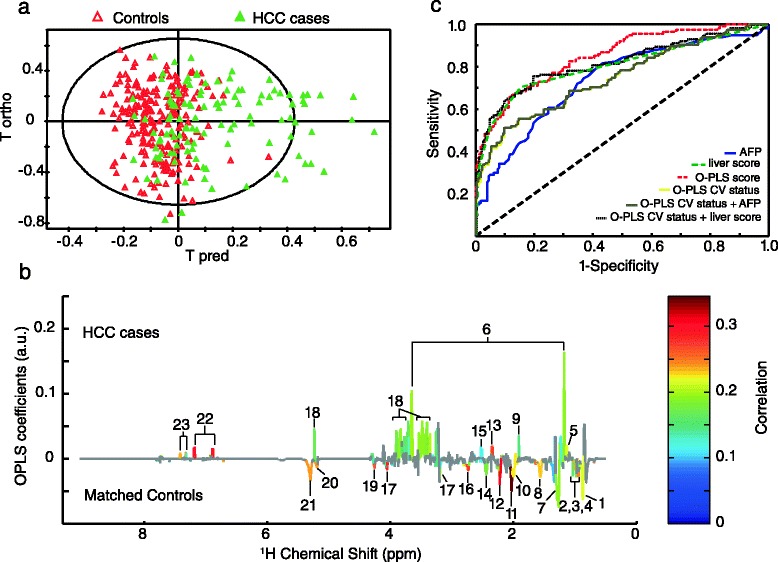
Methods: To address these aspects, an untargeted nuclear magnetic resonance metabolomic approach was applied to pre-diagnostic serum samples obtained from first incident, primary HCC cases (n = 114) and matched controls (n = 222) identified from amongst the participants of a large European prospective cohort.

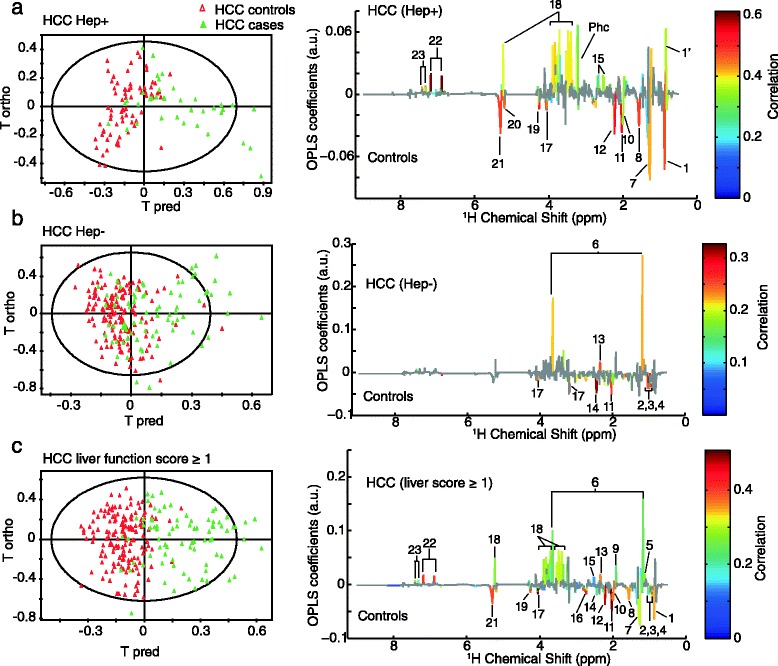
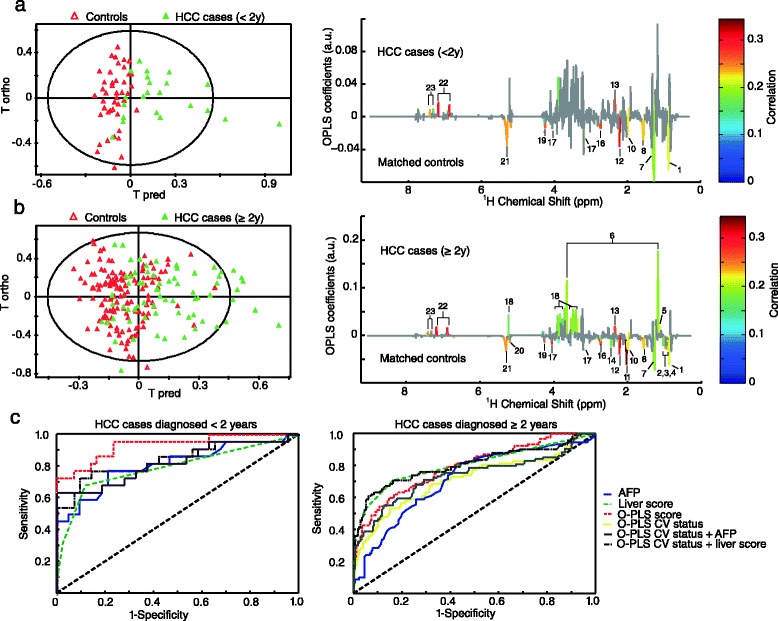
Results: A metabolic pattern associated with HCC risk comprised of perturbations in fatty acid oxidation and amino acid, lipid, and carbohydrate metabolism was observed. Sixteen metabolites of either endogenous or exogenous origin were found to be significantly associated with HCC risk. The influence of hepatitis infection and potential liver damage was assessed, and further analyses were made to distinguish patterns of early or later diagnosis.

Conclusion: Our results show clear metabolic alterations from early stages of HCC development with application for better etiologic understanding, prevention, and early detection of this increasingly common cancer.


Figures

Fig. 1
Fig. 1
Mean 1H Carr-Purcell-Meiboom-Gill NMR spectrum of serum samples with metabolite assignment. 1, CH 3 bond of lipids, mainly VLDL; 1’, CH 3 bond of lipids, mainly LDL; 1”, CH 3 bond of lipids, mainly HDL; 2, CH 2 bond of lipids; 3, CH 2-CH2-COOC bond of lipids; 4, CH 2-CH = bond of lipids; 5, CH2-CH 2-COOC bond of lipids; 6, =CH-CH 2-CH = bond of lipids; 7, Lipid O-CH 2; 8, CH = CH bond of lipids
Fig. 2
Fig. 2
NMR Metabolomic discrimination between HCC cases (n = 114) and matched controls (n = 222) based on 1H Carr-Purcell-Meiboom-Gill NMR data. (a) Orthogonal partial least-square (O-PLS) score plot of NMR spectra, R2 = 35 %, Q2 = 21 %. (b) O-PLS metabolic signature colored according to the correlation between NMR variables and case–control status after significance to ANOVA tests followed by Benjamini-Hochberg multiple correction (non-significant NMR variables are colored in grey). The validation of the model is presented in Additional file 1: Figure S1a. 1, CH 3 bond of lipids mainly very-low-density lipoproteins; 2, Leucine; 3, Isoleucine; 4, Valine; 5, Propylene glycol; 6, Ethanol; 7, CH 2 bond of lipids; 8, CH 2-CH2-COOC bond of lipids; 9, Acetate; 10, CH 2-CH = bond of lipids; 11, N-acetyl glycoproteins; 12, Acetone and CH2-CH 2-COOC bond of lipids; 13, Glutamate; 14, Glutamine; 15, Citrate; 16, =CH-CH 2-CH = bond of lipids; 17, Choline; 18, Glucose; 19, Lipid O-CH 2; 20, Mannose and lipids; 21, CH = CH bond of lipids; 22, Tyrosine; 23 Phenylalanine. An equivalent metabolic signature obtained from 1H NOESY NMR data is presented in Additional file 1: Figure S1b. (c) ROC analyses including AFP, liver function score, O-PLS score, O-PLS cross-validated (CV) status, and a combination between O-PLS CV status and AFP or liver function score. The ROC of O-PLS CV status and the combination of O-PLS CV status and AFP overlap. The characteristics of each model are presented in Table 3
Fig. 3
Fig. 3
Stratification of the analysis by hepatitis infection status and liver function score. (a) O-PLS score plot including HCC cases infected by HBV or HCV (n = 37) and matched controls (n = 72), R2 = 45 % and Q2 = 34 %, and the metabolic signature. (b) O-PLS score plot including HCC cases with HBV/HCV free (n = 77) and matched controls (n = 150), R2 = 28 % and Q2 = 12 %, and the metabolic signature colored for correlation after significance to ANOVA tests (Benjamini-Hochberg multiple corrected). (c) O-PLS score plot including HCC cases with liver function score ≥1 (n = 80) and matched controls (n = 155), R2 = 58 % and Q2 = 43 %, and the metabolic signature colored for correlation after significance to ANOVA tests (Benjamini-Hochberg multiple corrected). The validations of the O-PLS models are presented in Additional file 1: Figure S2. 1, CH 3 bond of lipids mainly VLDL; 1’, CH 3 bond of lipids, mainly LDL; 2, Leucine; 3, Isoleucine; 4, Valine; 5, Propylene glycol; 6, Ethanol; 7, CH 2 bond of lipids; 8, CH 2-CH2-COOC bond of lipids; 9, Acetate; 10, CH2-CH = bond of lipids; 11, N-acetyl glycoproteins; 12, Acetone and CH2-CH 2-COOC bond of lipids; 13, Glutamate; 14, Glutamine; 15, citrate; 16 = CH-CH 2-CH = bond of lipids; 17, Choline; 18, Glucose; 19, Lipid O-CH 2; 20, mannose and lipids; 21, CH = CH bond of lipids; 22, Tyrosine; 23 Phenylalanine. Phc, Phosphocholine
Fig. 4
Fig. 4
Analyses stratified by the interval between recruitment into the EPIC cohort and clinical diagnosis of HCC (<2 years after recruitment vs. ≥2 years after recruitment). (a) O-PLS score plot including HCC cases that were diagnosed <2 years (n = 22) after blood collection and matched controls (n = 43), R2 = 45 % and Q2 = 33 %, and the metabolic signature colored for correlation after significance to ANOVA tests (Benjamini-Hochberg multiple corrected). (b) O-PLS score plot including HCC cases that were diagnosed ≥2 years after blood collection (n = 92) and their matched controls (n = 179), R2 = 27 % and Q2 = 16 %, and the metabolic signature colored for correlation after significance to ANOVA tests (Benjamini-Hochberg multiple corrected). (c) ROC analyses for each stratified group including AFP, liver function score, O-PLS score, O-PLS cross validated (CV) status, and a combination between O-PLS CV status and AFP or liver function score. The ROC curves of the O-PLS CV status and the O-PLS CV status + AFP are almost overlapped for the ROC analysis performed on cases diagnosed <2 years. The characteristics of each model are presented in Table 3. The validations of the O-PLS models are presented in Additional file 1: Figure S3. 1, CH 3 bond of lipids mainly VLDL; 2, Leucine; 3, Isoleucine; 4, Valine; 5, Propylene glycol; 6, Ethanol; 7, CH 2 bond of lipids; 8, CH 2-CH2-COOC bond of lipids; 9, Acetate; 10, CH2-CH = bond of lipids; 11, N-acetyl glycoproteins; 12, Acetone and CH2-CH 2-COOC bond of lipids; 13, Glutamate; 14, Glutamine; 15, Citrate; 16 = CH-CH 2-CH = bond of lipids; 17, Choline; 18, Glucose; 19, Lipid O-CH 2; 20, Mannose and lipids; 21, CH = CH bond of lipids; 22, Tyrosine; 23, Phenylalanine

References

    1. Ferlay J, Soerjomataram I, Ervik M, Dikshit R, Eser S, Mathers C, et al. GLOBOCAN 2012 v1.0, Cancer Incidence and Mortality Worldwide 2013. http://globocan.iarc.fr, accessed on 30/01/2015. - PubMed
    1. El-Serag HB. Hepatocellular carcinoma. N Engl J Med. 2011;365:1118–27. doi: 10.1056/NEJMra1001683. - DOI - PubMed
    1. Chen Y, Wang X, Wang J, Yan Z, Luo J. Excess body weight and the risk of primary liver cancer: an updated meta-analysis of prospective studies. Eur J Cancer. 2012;48:2137–45. doi: 10.1016/j.ejca.2012.02.063. - DOI - PubMed
    1. Chuang SC, La Vecchia C, Boffetta P. Liver cancer: descriptive epidemiology and risk factors other than HBV and HCV infection. Cancer Lett. 2009;286:9–14. doi: 10.1016/j.canlet.2008.10.040. - DOI - PubMed
    1. Wang P, Kang D, Cao W, Wang Y, Liu Z. Diabetes mellitus and risk of hepatocellular carcinoma: a systematic review and meta-analysis. Diabetes Metab Res Rev. 2012;28:109–22. doi: 10.1002/dmrr.1291. - DOI - PubMed

Publication types