

Proteome-wide quantitative multiplexed profiling of protein expression: carbon-source dependency in Saccharomyces cerevisiae
- PMID: 26399295
- PMCID: PMC4710237
- DOI: 10.1091/mbc.E15-07-0499
Proteome-wide quantitative multiplexed profiling of protein expression: carbon-source dependency in Saccharomyces cerevisiae
Abstract
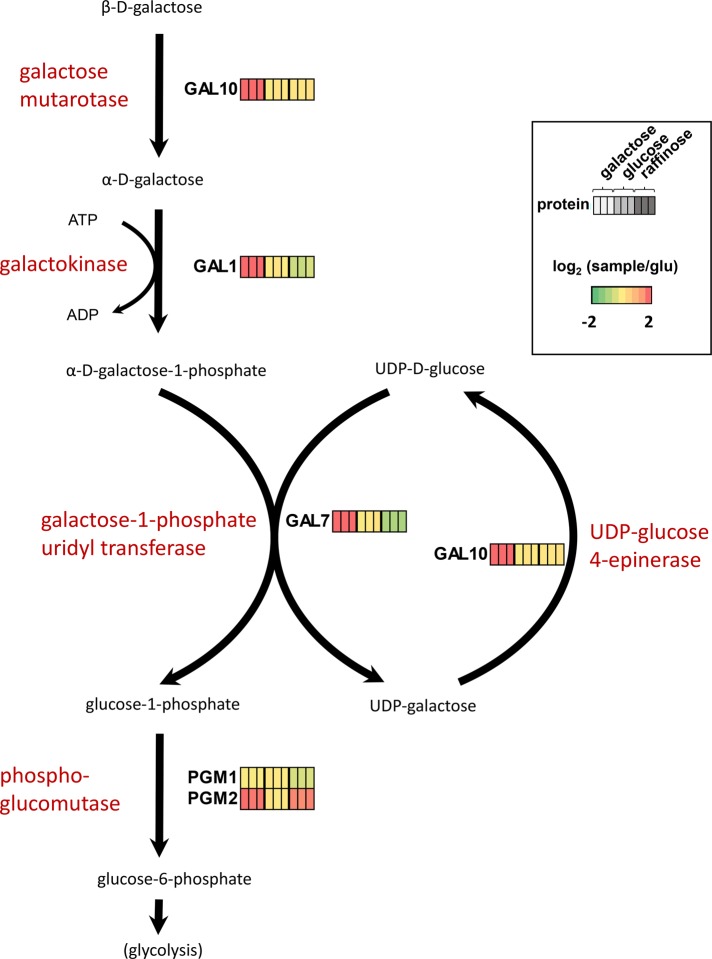
The global proteomic alterations in the budding yeast Saccharomyces cerevisiae due to differences in carbon sources can be comprehensively examined using mass spectrometry-based multiplexing strategies. In this study, we investigate changes in the S. cerevisiae proteome resulting from cultures grown in minimal media using galactose, glucose, or raffinose as the carbon source. We used a tandem mass tag 9-plex strategy to determine alterations in relative protein abundance due to a particular carbon source, in triplicate, thereby permitting subsequent statistical analyses. We quantified more than 4700 proteins across all nine samples; 1003 proteins demonstrated statistically significant differences in abundance in at least one condition. The majority of altered proteins were classified as functioning in metabolic processes and as having cellular origins of plasma membrane and mitochondria. In contrast, proteins remaining relatively unchanged in abundance included those having nucleic acid-related processes, such as transcription and RNA processing. In addition, the comprehensiveness of the data set enabled the analysis of subsets of functionally related proteins, such as phosphatases, kinases, and transcription factors. As a resource, these data can be mined further in efforts to understand better the roles of carbon source fermentation in yeast metabolic pathways and the alterations observed therein, potentially for industrial applications, such as biofuel feedstock production.
© 2015 Paulo et al. This article is distributed by The American Society for Cell Biology under license from the author(s). Two months after publication it is available to the public under an Attribution–Noncommercial–Share Alike 3.0 Unported Creative Commons License (http://creativecommons.org/licenses/by-nc-sa/3.0).
Figures


References
-
- Back SH, Schroder M, Lee K, Zhang K, Kaufman RJ. ER stress signaling by regulated splicing: IRE1/HAC1/XBP1. Methods. 2005;35:395–416. - PubMed
-
- Beausoleil SA, Villen J, Gerber SA, Rush J, Gygi SP. A probability-based approach for high-throughput protein phosphorylation analysis and site localization. Nat Biotechnol. 2006;24:1285–1292. - PubMed
-
- Blank LM, Sauer U. TCA cycle activity in Saccharomyces cerevisiae is a function of the environmentally determined specific growth and glucose uptake rates. Microbiology. 2004;150:1085–1093. - PubMed
-
- Blinnikova EI, Mirjuschenko FL, Shabalin YA, Egorov SN. Vesicular transport of extracellular acid phosphatases in yeast Saccharomyces cerevisiae. Biochemistry (Mosc) 2002;67:485–490. - PubMed
Publication types
MeSH terms
Substances
Grants and funding
LinkOut - more resources
Full Text Sources
Molecular Biology Databases
Research Materials
