. 2015 Sep 24:5:14366.
doi: 10.1038/srep14366.

Inhibitory luminopsins: genetically-encoded bioluminescent opsins for versatile, scalable, and hardware-independent optogenetic inhibition

Affiliations

Inhibitory luminopsins: genetically-encoded bioluminescent opsins for versatile, scalable, and hardware-independent optogenetic inhibition

Jack K Tung et al. Sci Rep. .

Abstract

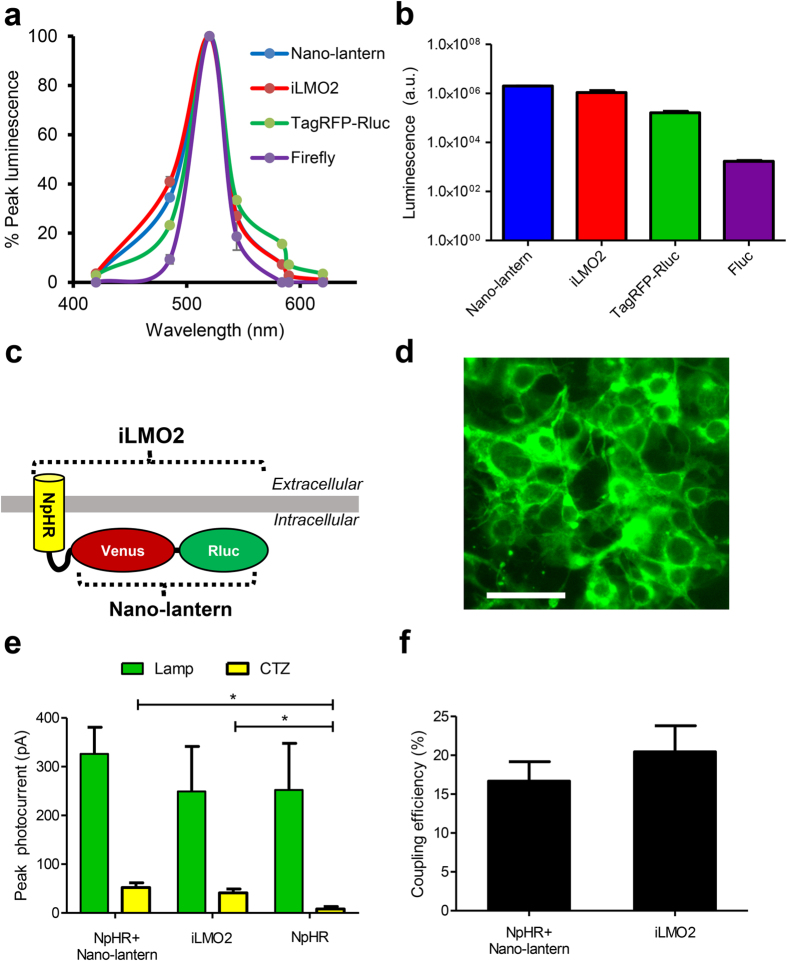
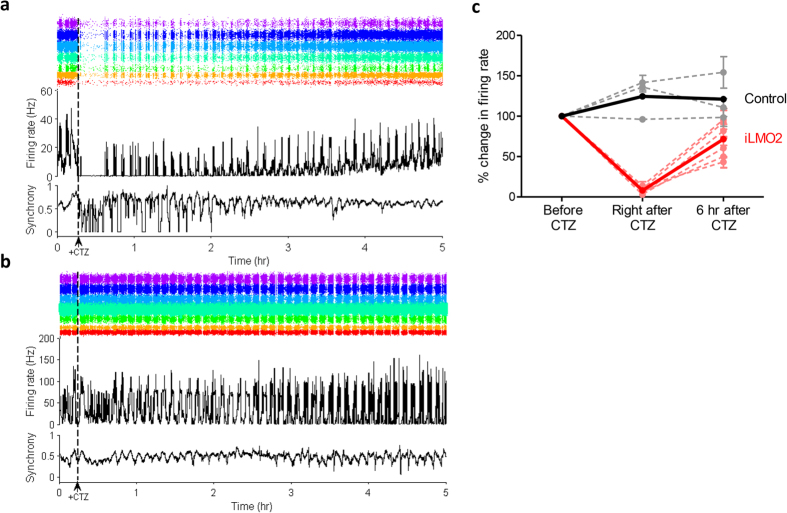
Optogenetic techniques provide an unprecedented ability to precisely manipulate neural activity in the context of complex neural circuitry. Although the toolbox of optogenetic probes continues to expand at a rapid pace with more efficient and responsive reagents, hardware-based light delivery is still a major hurdle that limits its practical use in vivo. We have bypassed the challenges of external light delivery by directly coupling a bioluminescent light source (a genetically encoded luciferase) to an inhibitory opsin, which we term an inhibitory luminopsin (iLMO). iLMO was shown to suppress action potential firing and synchronous bursting activity in vitro in response to both external light and luciferase substrate. iLMO was further shown to suppress single-unit firing rate and local field potentials in the hippocampus of anesthetized rats. Finally, expression of iLMO was scaled up to multiple structures of the basal ganglia to modulate rotational behavior of freely moving animals in a hardware-independent fashion. This novel class of optogenetic probes demonstrates how non-invasive inhibition of neural activity can be achieved, which adds to the versatility, scalability, and practicality of optogenetic applications in freely behaving animals.


Figures

Figure 1
Figure 1. NpHR can be activated by both external light and luciferase-derived bioluminescence in HEK293 cells expressing iLMO2.
(a) Emission spectra and (b) Total luminescence measured from transfected HEK293 cells expressing various luciferases (Nano-lantern, TagRFP-Rluc, Firefly) and iLMO2. (c) Schematic representation of the iLMO2 fusion protein. (d) Fluorescence image showing membrane-localized expression of iLMO2 in transfected HEK293 cells. Scale bar: 50 μm (e) Average peak photocurrent responses to green lamp illumination and CTZ measured from HEK293 cells transfected with NpHR and Nano-lantern separately (NpHR + Nano-lantern), iLMO2 fusion protein, or NpHR alone (n = 5 for each group). Mean responses to CTZ were significantly different (*p < 0.05) but responses to green lamp illumination were not (p > 0.05) by one-way ANOVA with Bonferroni posthoc test. (f) Coupling efficiency (peak photocurrent from CTZ divided by peak photocurrent from lamp) of transfected HEK293 cells expressing NpHR and Nano-lantern separately (NpHR + Nano-lantern) (n = 5) and iLMO2 fusion protein (n = 5). Error bars indicate standard error of the mean.
Figure 2
Figure 2. iLMO2 is able to suppress action potential firing in vitro.
(a) Left: fluorescence micrograph depicting dissociated cortical neurons expressing iLMO2. Right: bioluminescence image taken in the same field of view after addition of CTZ. Scale bar: 20 μm. (b) Representative voltage clamp recordings of a neuron expressing iLMO2 demonstrate hyperpolarizing outward photocurrents in response to CTZ (left, dashed line indicates time of CTZ addition) and green lamp illumination (right, green bar denotes period of illumination). Note that the outward current induced by CTZ coincides with an increase in luminescence (top left). (c) Average peak photocurrent response to CTZ and green lamp illumination in neurons expressing iLMO2 fusion protein (n = 8). (d) Representative current clamp recordings from neurons expressing iLMO2 demonstrate complete suppression of action potentials (evoked by 1 Hz threshold-level current injections) in response to CTZ (left, dashed line indicates time of CTZ addition) and green lamp illumination (right, green bar denotes period of illumination). A sustained hyperpolarizing response coincides with an increase in luminescence after CTZ addition. (e) Average percent inhibition of spontaneous (n = 3) and evoked (n = 6 for threshold-level current injections; n = 4 for supra-threshold) action potentials in cortical neurons expressing iLMO2. Error bars indicate standard error of the mean.
Figure 3
Figure 3. iLMO2 is able to suppress synchronous bursting activity in vitro.
(a) A representative multielectrode array recording of a culture transduced with iLMO2 fusion protein shows complete inhibition of spontaneous bursting activity after addition of CTZ (dashed line). Spontaneous bursting activity eventually returns to baseline levels over a period of several hours. In both (a) and (b) the middle trace shows array-wide firing rate, top trace shows corresponding raster (each color corresponds to a different electrode), and bottom trace depicts synchrony across two random electrodes. (b) Representative multielectrode array recording of a sister control culture (un-transduced) showing no effect of CTZ on spontaneous bursting activity. (c) Average change in multi-unit firing rate (9 channels per culture) of 10 min intervals before, immediately after, and 6 hours after addition of CTZ in iLMO2 expressing (dotted red lines, n = 6) and sister control cultures (dotted black lines, n = 3). Solid bold lines represent averages for each group of cultures. Error bars indicate standard error of the mean.
Figure 4
Figure 4. iLMO2 is able to suppress neural activity in anesthetized rats.
(a) Left: photograph depicting a cannula-electrode in which a guide cannula (white asterisk) was glued to a 16-channel microwire array (row 1 targeting CA1, row 2 targeting CA3) so that an optical fiber inserted through an injection cannula (white arrow) can be positioned 1–2 mm away from electrode tips. Scale bar: 1 mm. Right: Histology depicting tips of electrode tracks (asterisks) targeted to the pyramidal cell layer (outlined) of the dorsal hippocampus. Note robust expression of iLMO2 (green) in the pyramidal cells around electrode holes. DAPI stain (blue) highlights nuclei of migratory glial cells around electrode tips. Scale bar: 100 μm. (b) Example of single-units sorted using super-paramagnetic clustering. (c) Population average (n = 6) of normalized single-unit firing rate over time (middle, SEM shaded) with corresponding raster (top, each color corresponds to different unit) and spectrogram (bottom) for a representative CTZ injection trial (injected at time = 0, vertical dashed line). (d) Population average (n = 6) of normalized single-unit firing rate, raster, and spectrogram for the same units shown in (c) for a representative vehicle injection trial (injected at time = 0, vertical dashed line). (e) Normalized single-unit firing rate averaged across all intracerebral CTZ (red) and vehicle (blue) injection trials (n = 5 trials each, same 24 units for each group) from the same animal shown above. Injections occurred at t = 0 denoted by vertical dashed line. (f) Average peak change in single-unit firing rate to light, CTZ, and vehicle across all animals (n = 3). Error bars indicate standard error of the mean.
Figure 5
Figure 5. iLMO2 can be expressed in multiple structures of the basal ganglia and is able to induce ipsilateral rotation in awake rats.
(a) Intravenous administration of CTZ was able to significantly increase net ipsilateral rotations over mean baseline rate in rats unilaterally expressing iLMO2 in the striatum and globus pallidus. CTZ or vehicle was injected through a jugular venous catheter at t = 0 (dashed line). The response to CTZ was significantly different than vehicle by two-way ANOVA with Bonferroni posthoc test (*p < 0.05; n = 5 trials for CTZ, n = 6 trials for vehicle across 3 animals). (b) Expression of iLMO2 (green) was found throughout the entire striatum and globus pallidus (STR-striatum, GP-globus pallidus is outlined). Neurons in the globus pallidus expressed iLMO2 (bottom right) and sent labeled projections to the subthalamic nucleus (STN, bottom left). Blue: DAPI. (c) Bioluminescence image of a rat expressing iLMO2 after CTZ was administered intravenously under anesthesia. (d) Bioluminescence image of an acute brain slice showing activation of iLMO2 throughout the striatum and globus pallidus after addition of CTZ. Color bar indicates relative luminescence intensity.

References

    1. Fenno L., Yizhar O. & Deisseroth K. The Development and Application of Optogenetics. Annu. Rev. Neurosci. 34, 110301101035033 (2010). - PMC - PubMed
    1. Sparta D. R. et al. Construction of implantable optical fibers for long-term optogenetic manipulation of neural circuits. Nat. Protocols 7(1), 12–23 (2012). - PMC - PubMed
    1. AM A. et al. An optical neural interface: in vivo control of rodent motor cortex with integrated fiberoptic and optogenetic technology. J Neural Eng. 4, S143–56 (2007). - PubMed
    1. Al-Juboori S. et al. Light scattering properties vary across different regions of the adult mouse brain. PLoS ONE 8(7), e67626, 10.1371/journal.pone.0067626. - DOI - PMC - PubMed
    1. Yizhar O., Fenno L. E., Davidson T. J., Mogri M. & Deisseroth K. Optogenetics in neural systems. Neuron 71, 9–34 (2011). - PubMed

Publication types